| Tissue | Expression Dynamics | Abbreviation |
| Breast | 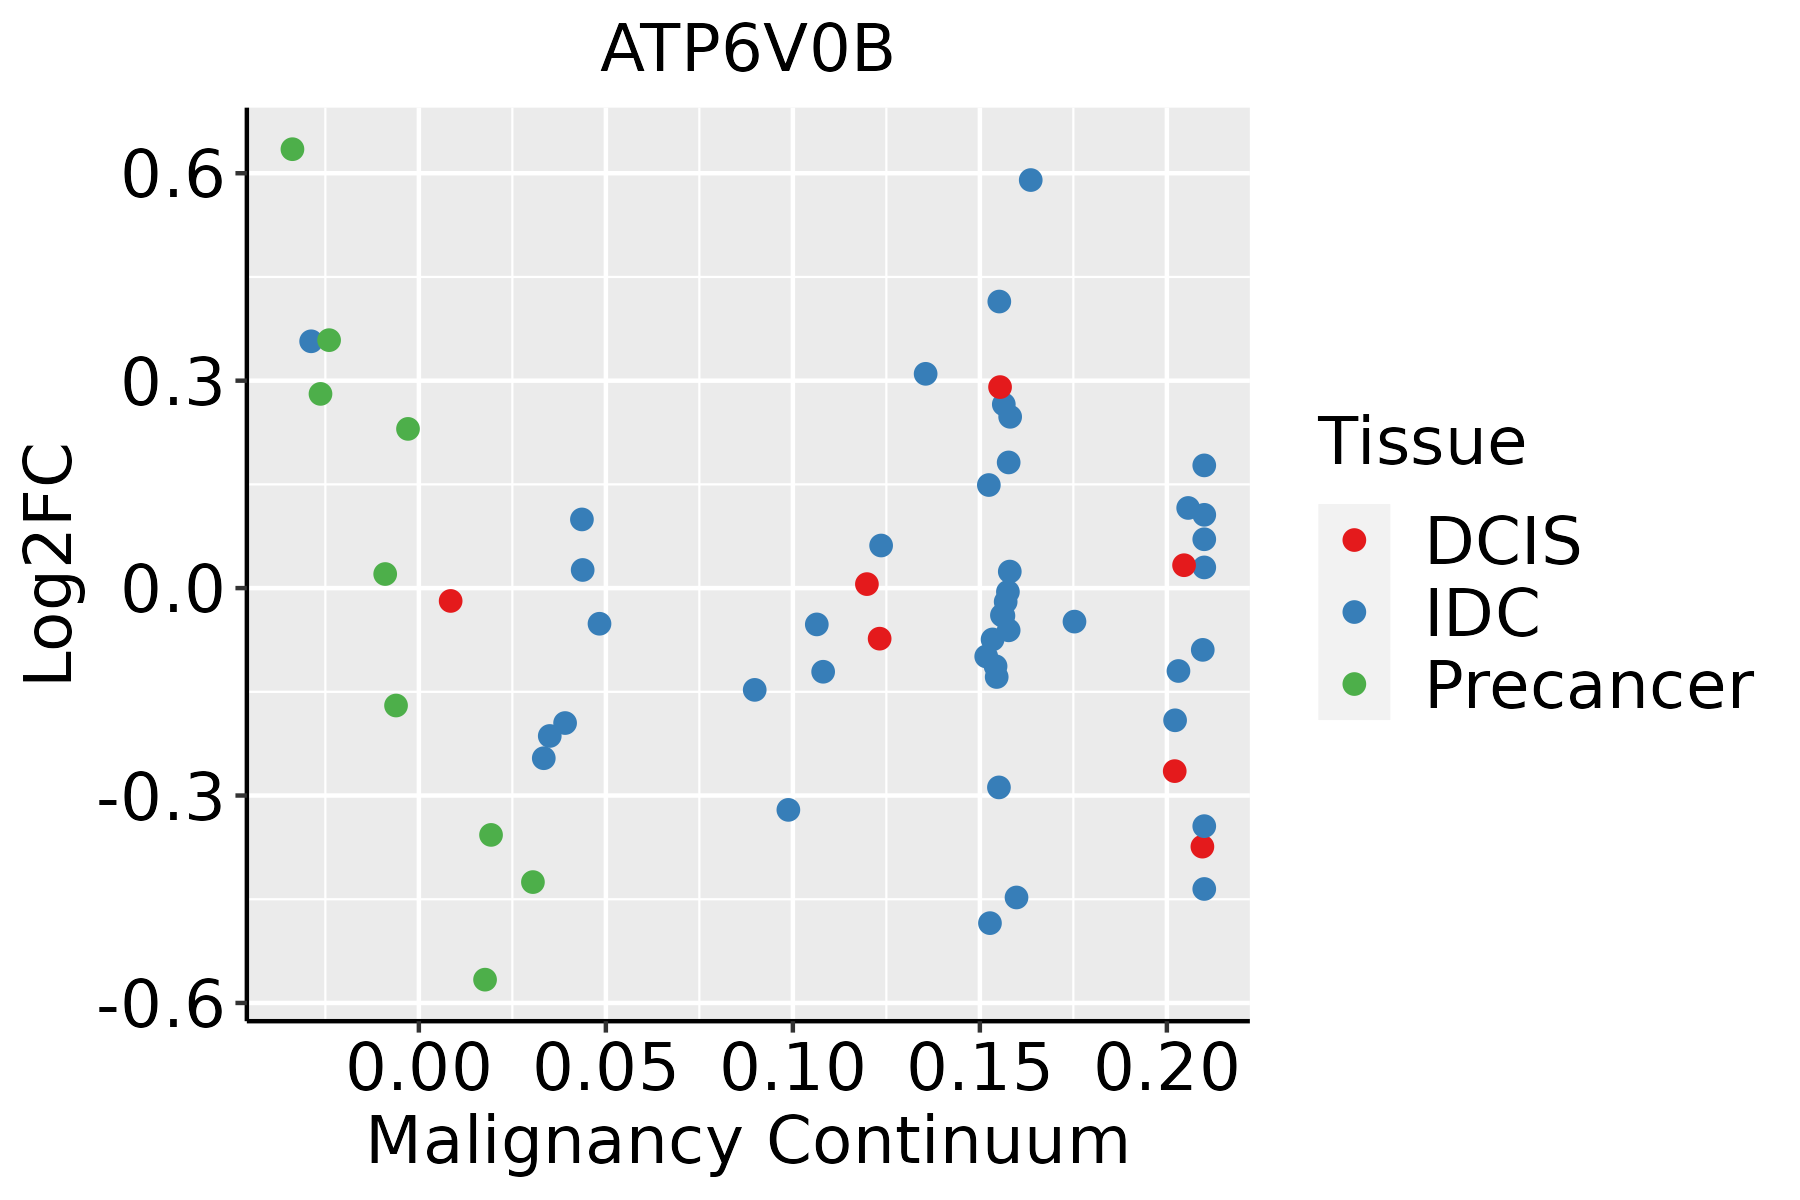 | IDC: Invasive ductal carcinoma |
| DCIS: Ductal carcinoma in situ |
| Precancer(BRCA1-mut): Precancerous lesion from BRCA1 mutation carriers |
| Cervix | 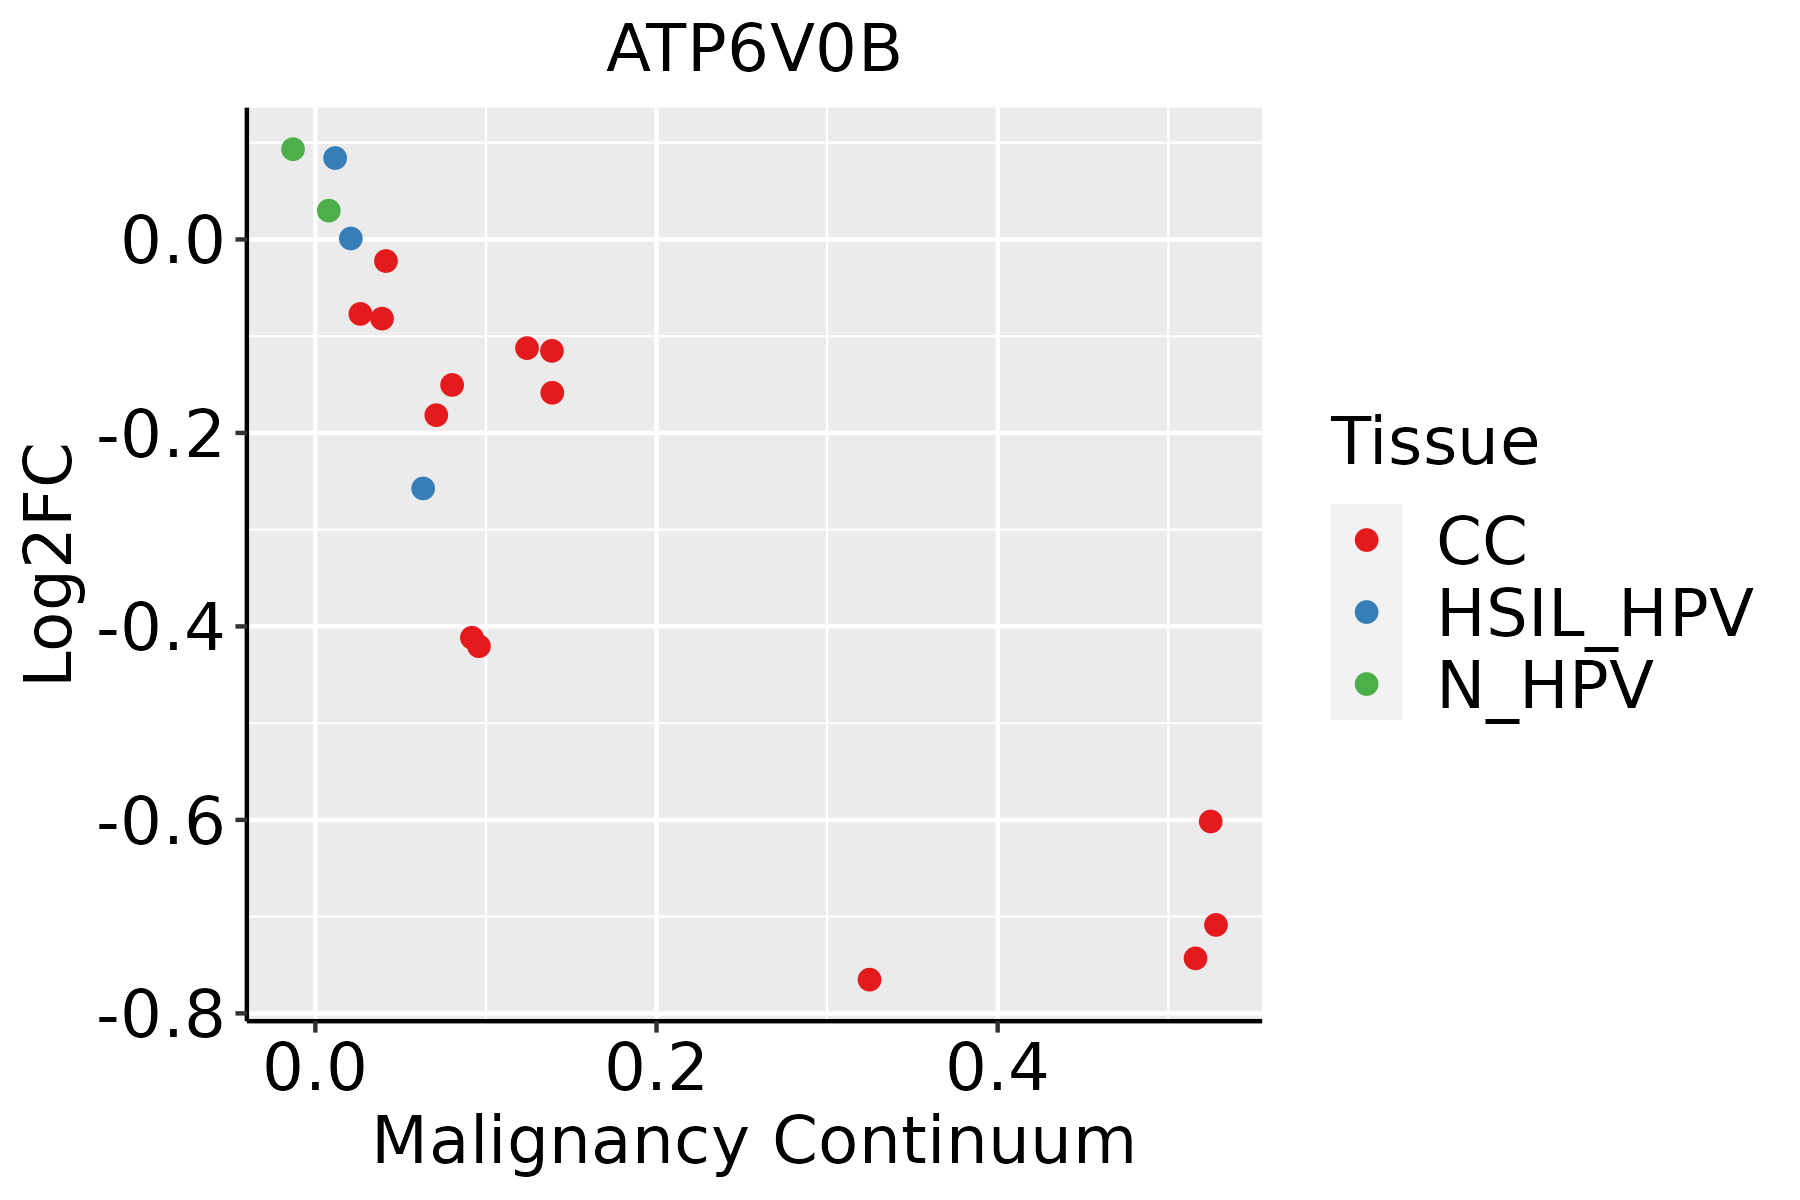 | CC: Cervix cancer |
| HSIL_HPV: HPV-infected high-grade squamous intraepithelial lesions |
| N_HPV: HPV-infected normal cervix |
| Colorectum (GSE201348) | 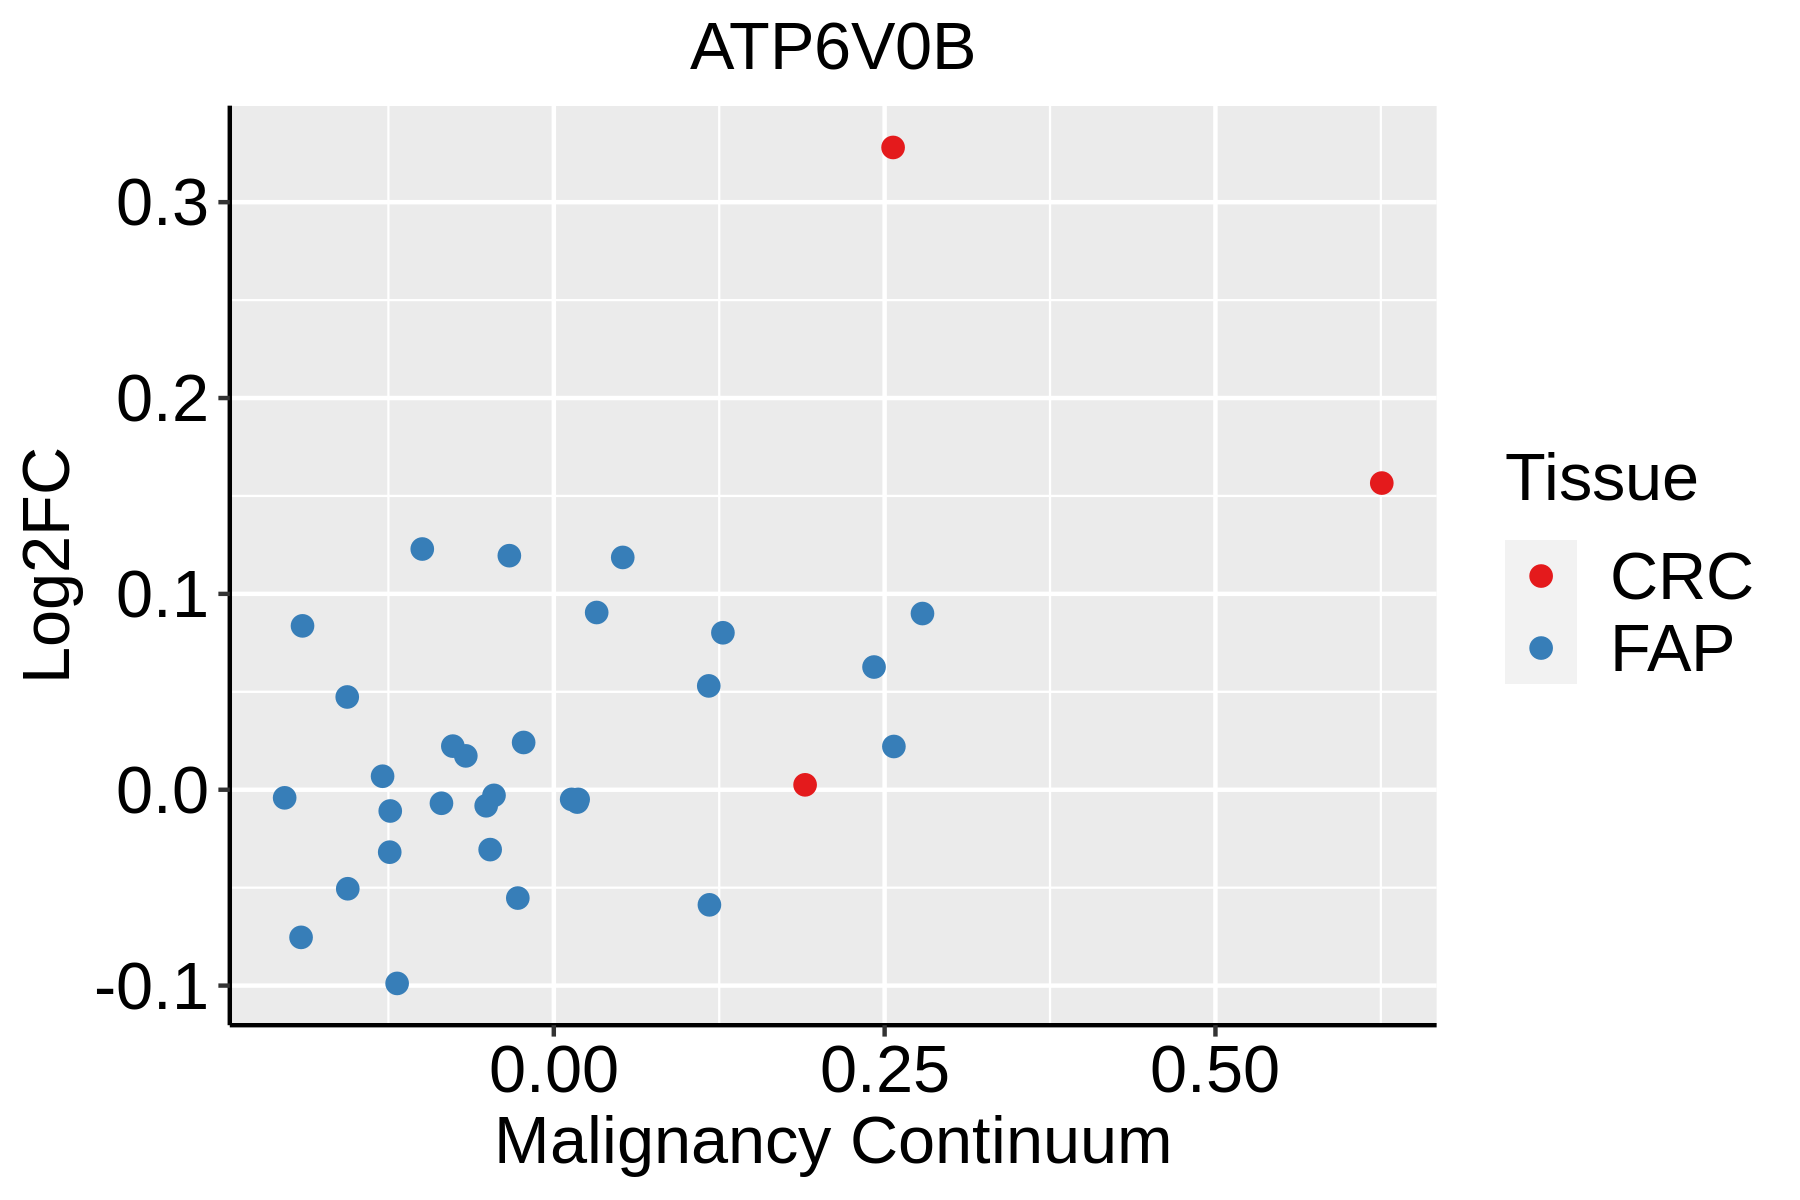 | FAP: Familial adenomatous polyposis |
| CRC: Colorectal cancer |
| Colorectum (HTA11) | 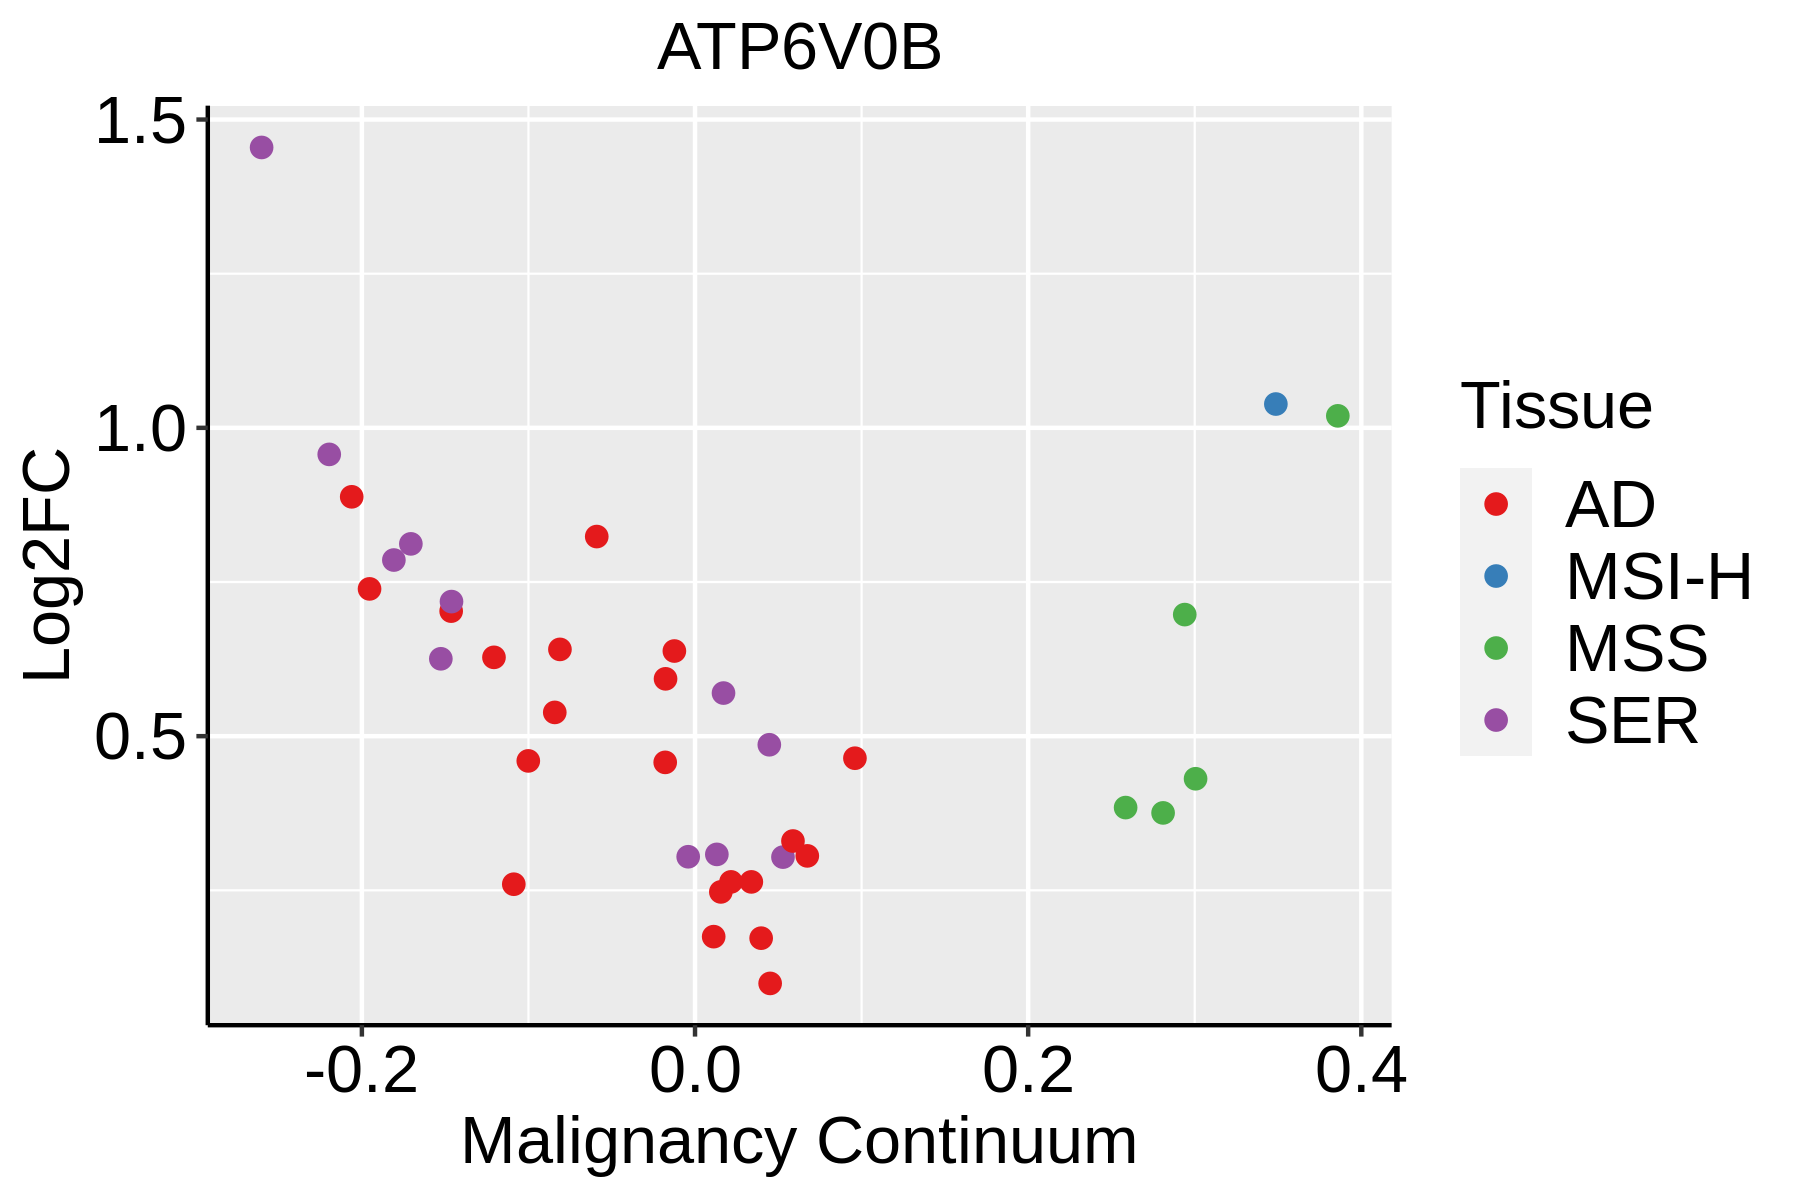 | AD: Adenomas |
| SER: Sessile serrated lesions |
| MSI-H: Microsatellite-high colorectal cancer |
| MSS: Microsatellite stable colorectal cancer |
| Endometrium | 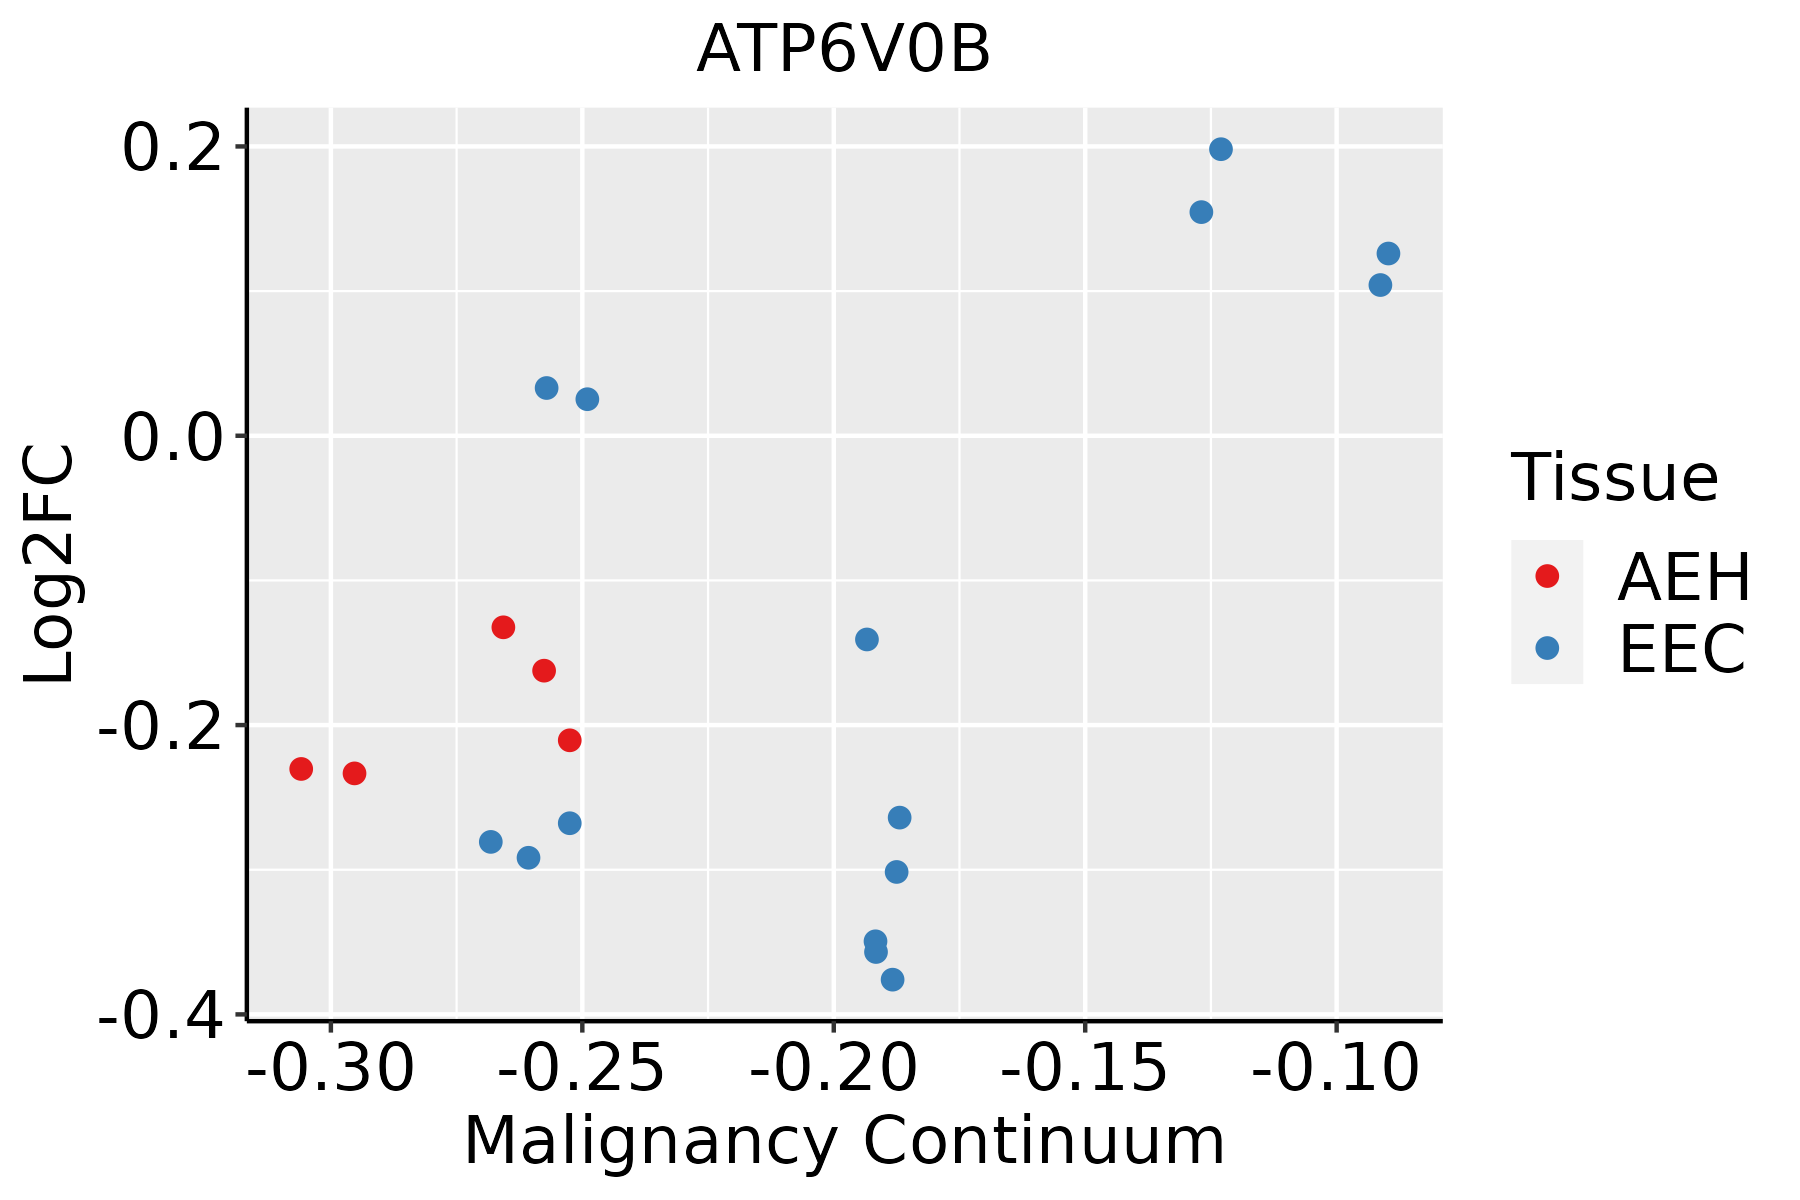 | AEH: Atypical endometrial hyperplasia |
| EEC: Endometrioid Cancer |
| Esophagus | 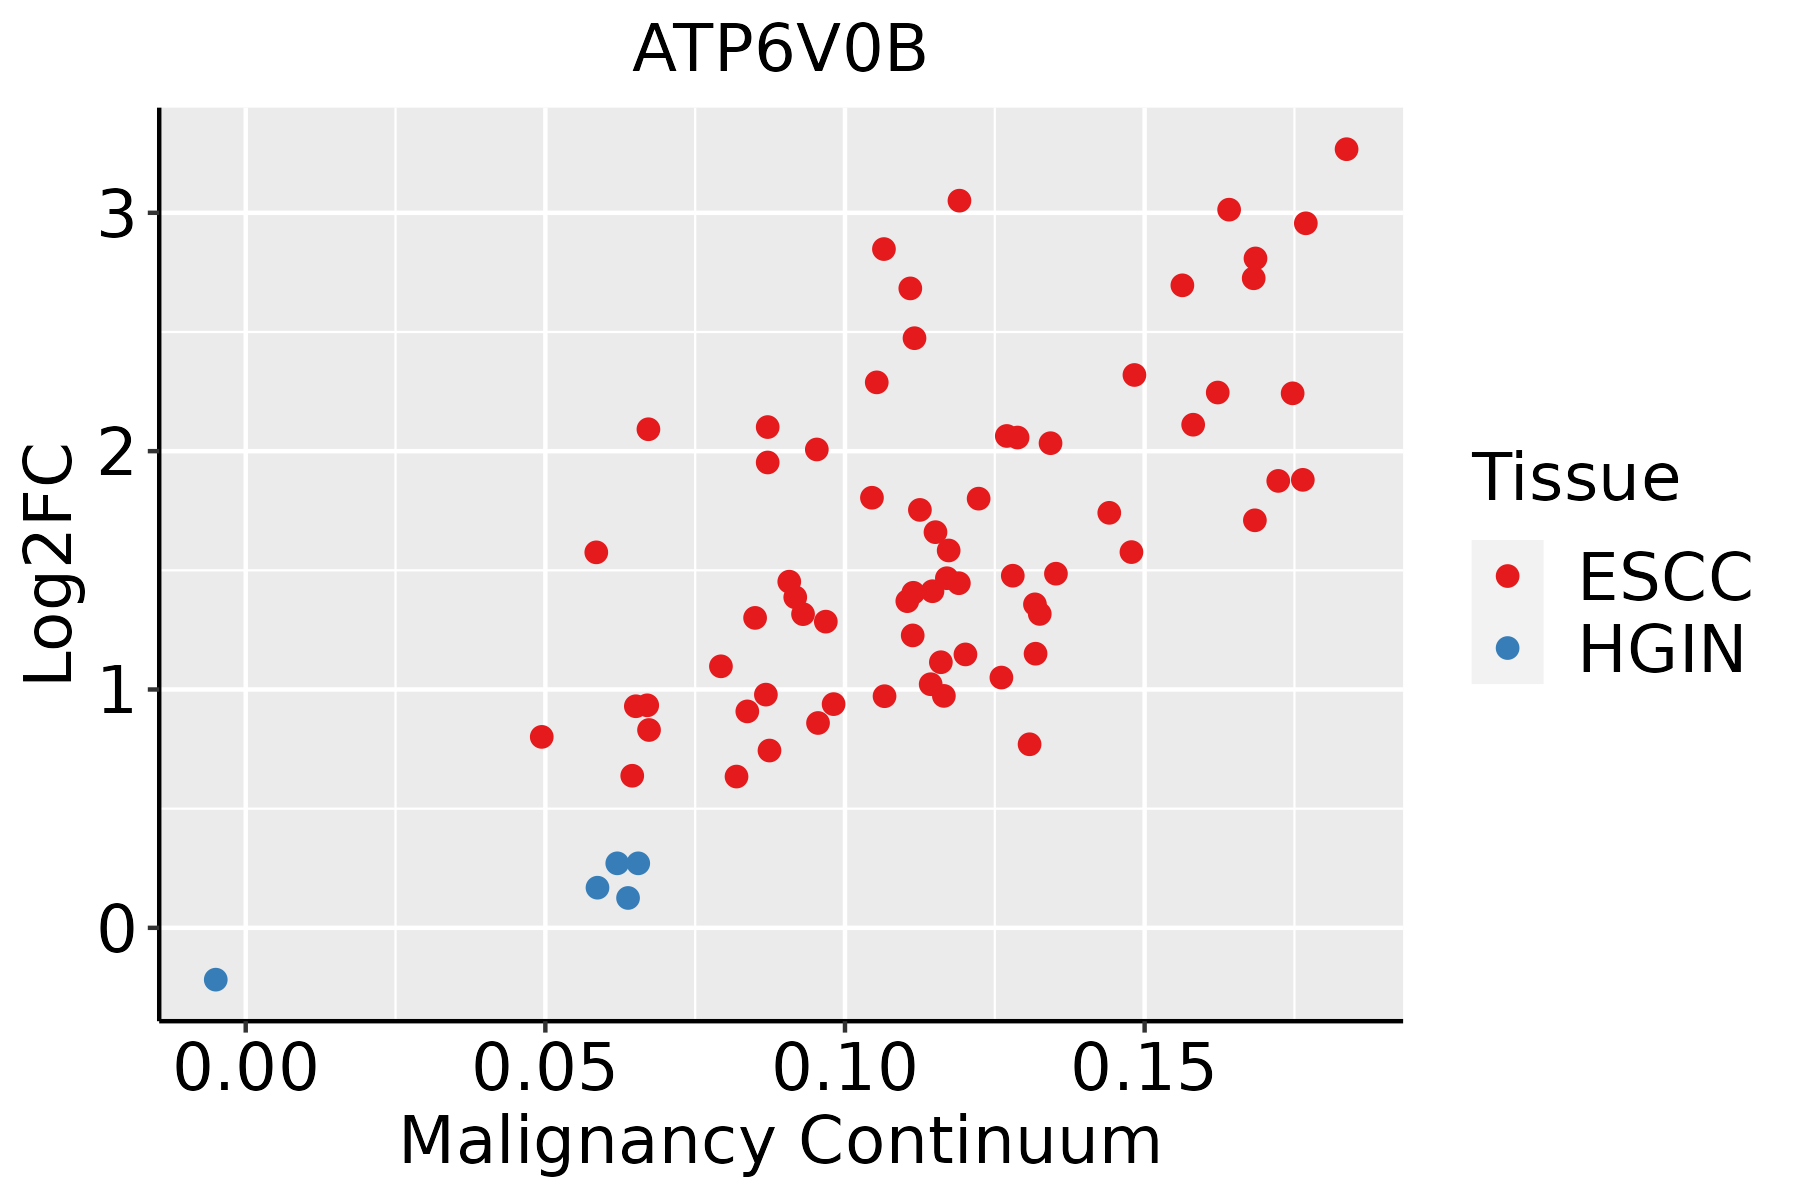 | ESCC: Esophageal squamous cell carcinoma |
| HGIN: High-grade intraepithelial neoplasias |
| LGIN: Low-grade intraepithelial neoplasias |
| Liver | 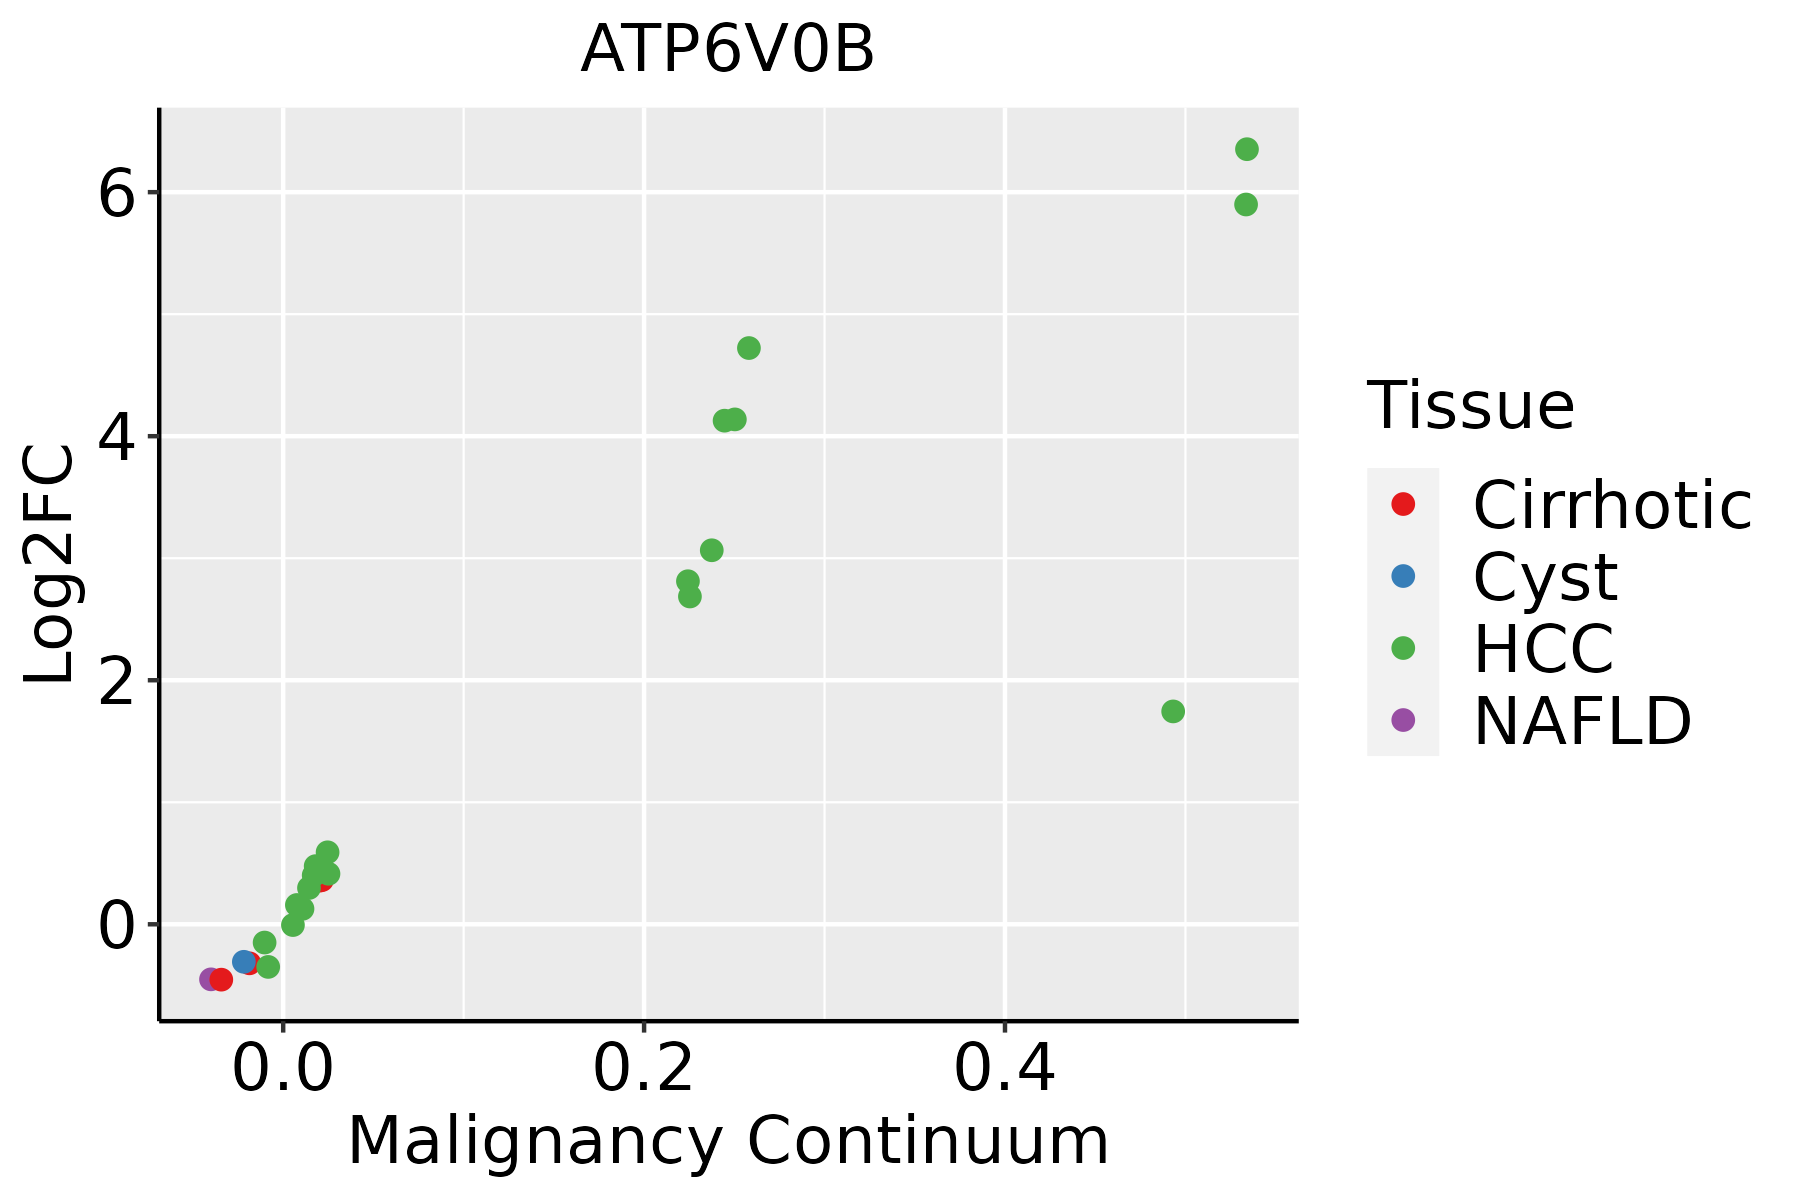 | HCC: Hepatocellular carcinoma |
| NAFLD: Non-alcoholic fatty liver disease |
| Oral Cavity | 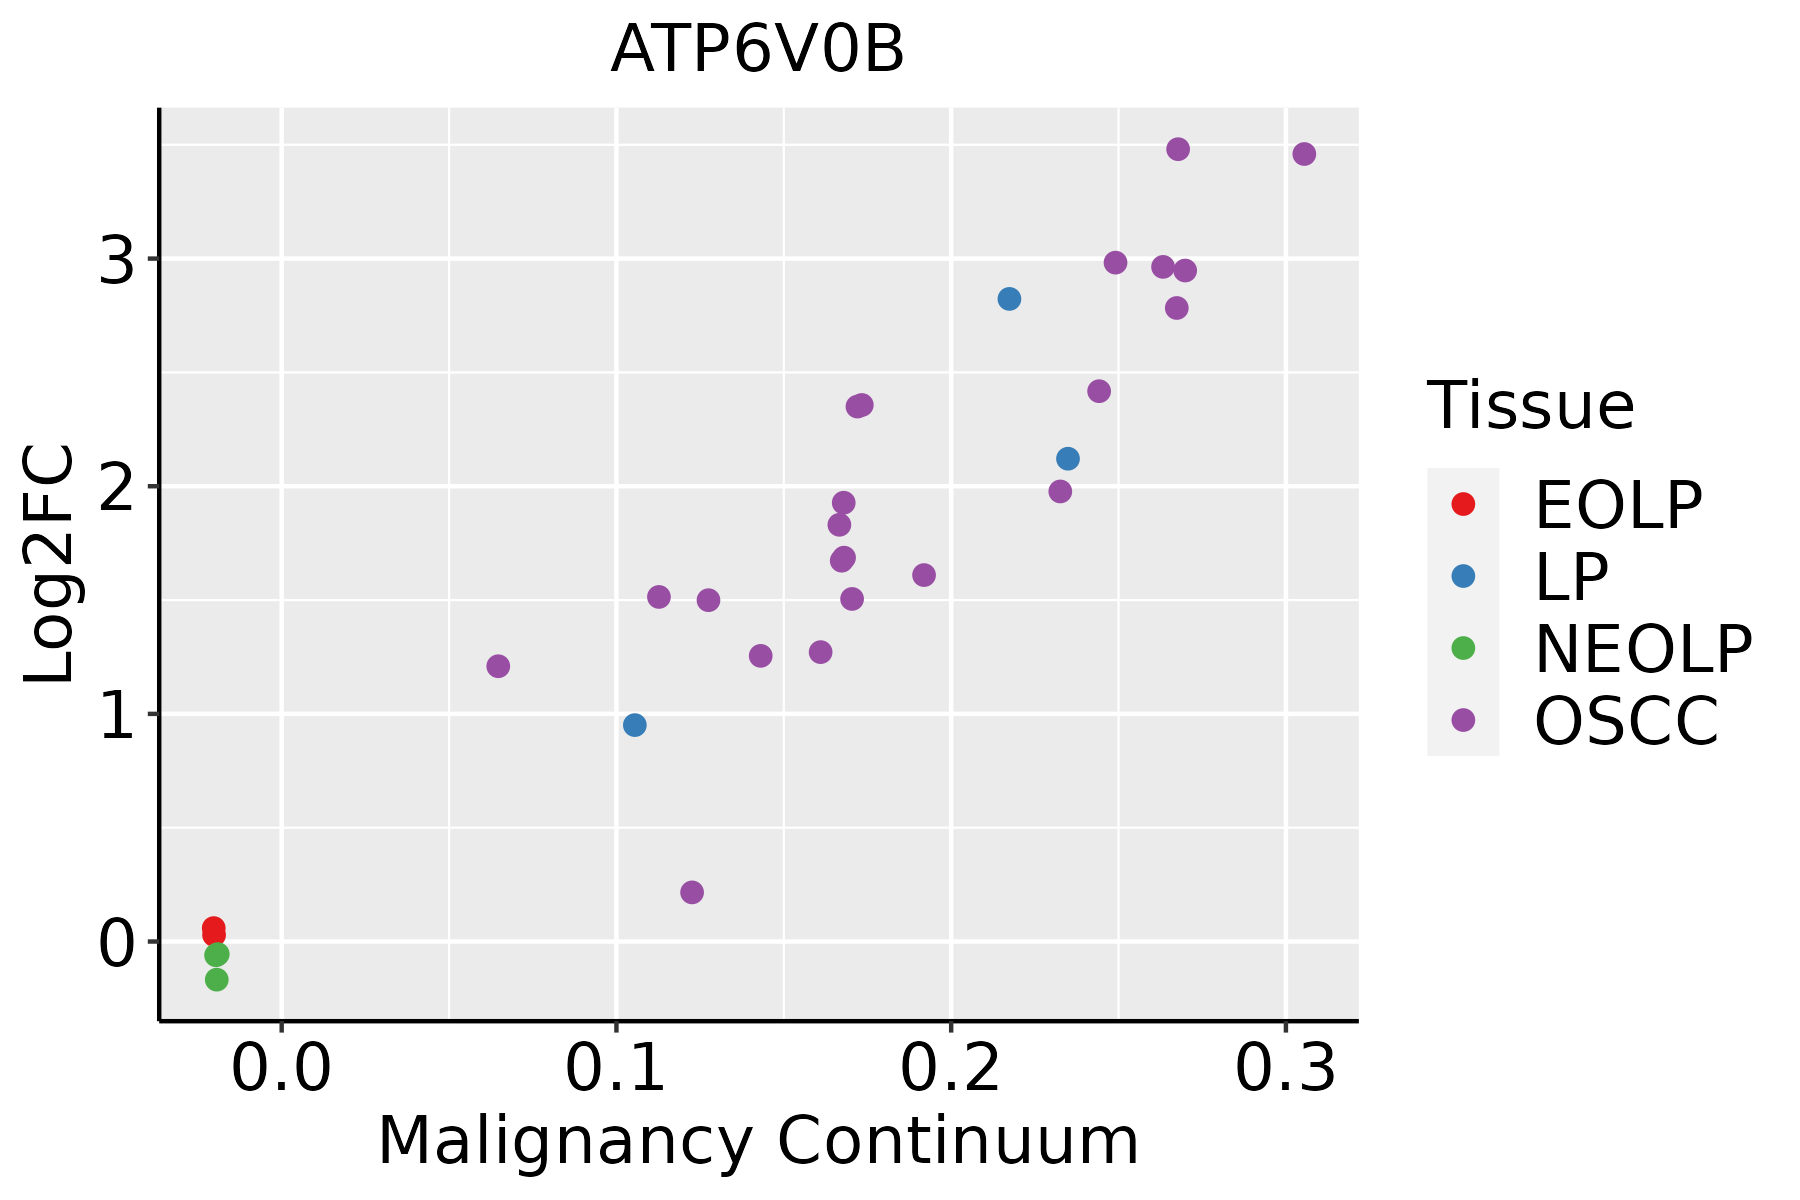 | EOLP: Erosive Oral lichen planus |
| LP: leukoplakia |
| NEOLP: Non-erosive oral lichen planus |
| OSCC: Oral squamous cell carcinoma |
| Prostate |  | BPH: Benign Prostatic Hyperplasia |
| Skin |  | AK: Actinic keratosis |
| cSCC: Cutaneous squamous cell carcinoma |
| SCCIS:squamous cell carcinoma in situ |
| Thyroid |  | ATC: Anaplastic thyroid cancer |
| HT: Hashimoto's thyroiditis |
| PTC: Papillary thyroid cancer |
| GO ID | Tissue | Disease Stage | Description | Gene Ratio | Bg Ratio | pvalue | p.adjust | Count |
| GO:19026008 | Breast | Precancer | proton transmembrane transport | 39/1080 | 157/18723 | 4.18e-15 | 1.18e-12 | 39 |
| GO:190260012 | Breast | IDC | proton transmembrane transport | 40/1434 | 157/18723 | 7.34e-12 | 1.34e-09 | 40 |
| GO:190260022 | Breast | DCIS | proton transmembrane transport | 40/1390 | 157/18723 | 2.77e-12 | 5.80e-10 | 40 |
| GO:19026009 | Cervix | CC | proton transmembrane transport | 39/2311 | 157/18723 | 1.23e-05 | 2.57e-04 | 39 |
| GO:00162367 | Cervix | CC | macroautophagy | 58/2311 | 291/18723 | 1.40e-04 | 1.70e-03 | 58 |
| GO:00105067 | Cervix | CC | regulation of autophagy | 61/2311 | 317/18723 | 2.61e-04 | 2.87e-03 | 61 |
| GO:1902600 | Colorectum | AD | proton transmembrane transport | 66/3918 | 157/18723 | 1.59e-09 | 1.17e-07 | 66 |
| GO:0010506 | Colorectum | AD | regulation of autophagy | 111/3918 | 317/18723 | 3.57e-09 | 2.35e-07 | 111 |
| GO:0016236 | Colorectum | AD | macroautophagy | 103/3918 | 291/18723 | 6.76e-09 | 4.15e-07 | 103 |
| GO:0016241 | Colorectum | AD | regulation of macroautophagy | 50/3918 | 141/18723 | 4.55e-05 | 7.92e-04 | 50 |
| GO:19026001 | Colorectum | SER | proton transmembrane transport | 60/2897 | 157/18723 | 3.12e-12 | 7.08e-10 | 60 |
| GO:00162361 | Colorectum | SER | macroautophagy | 79/2897 | 291/18723 | 1.97e-07 | 1.10e-05 | 79 |
| GO:00105061 | Colorectum | SER | regulation of autophagy | 74/2897 | 317/18723 | 1.39e-04 | 2.77e-03 | 74 |
| GO:00162411 | Colorectum | SER | regulation of macroautophagy | 34/2897 | 141/18723 | 4.74e-03 | 3.72e-02 | 34 |
| GO:00162362 | Colorectum | MSS | macroautophagy | 93/3467 | 291/18723 | 2.08e-08 | 1.17e-06 | 93 |
| GO:19026002 | Colorectum | MSS | proton transmembrane transport | 57/3467 | 157/18723 | 1.00e-07 | 4.81e-06 | 57 |
| GO:00105062 | Colorectum | MSS | regulation of autophagy | 95/3467 | 317/18723 | 4.36e-07 | 1.71e-05 | 95 |
| GO:00162412 | Colorectum | MSS | regulation of macroautophagy | 44/3467 | 141/18723 | 1.88e-04 | 2.64e-03 | 44 |
| GO:19026003 | Colorectum | MSI-H | proton transmembrane transport | 29/1319 | 157/18723 | 1.49e-06 | 9.75e-05 | 29 |
| GO:190260010 | Endometrium | AEH | proton transmembrane transport | 43/2100 | 157/18723 | 1.70e-08 | 1.04e-06 | 43 |
| Pathway ID | Tissue | Disease Stage | Description | Gene Ratio | Bg Ratio | pvalue | p.adjust | qvalue | Count |
| hsa0019016 | Breast | Precancer | Oxidative phosphorylation | 59/684 | 134/8465 | 6.15e-30 | 3.24e-28 | 2.48e-28 | 59 |
| hsa0511014 | Breast | Precancer | Vibrio cholerae infection | 14/684 | 50/8465 | 2.67e-05 | 2.64e-04 | 2.02e-04 | 14 |
| hsa0414518 | Breast | Precancer | Phagosome | 27/684 | 152/8465 | 7.37e-05 | 6.85e-04 | 5.25e-04 | 27 |
| hsa0532312 | Breast | Precancer | Rheumatoid arthritis | 19/684 | 93/8465 | 1.30e-04 | 1.14e-03 | 8.73e-04 | 19 |
| hsa051206 | Breast | Precancer | Epithelial cell signaling in Helicobacter pylori infection | 14/684 | 70/8465 | 1.21e-03 | 7.99e-03 | 6.12e-03 | 14 |
| hsa0019017 | Breast | Precancer | Oxidative phosphorylation | 59/684 | 134/8465 | 6.15e-30 | 3.24e-28 | 2.48e-28 | 59 |
| hsa0511015 | Breast | Precancer | Vibrio cholerae infection | 14/684 | 50/8465 | 2.67e-05 | 2.64e-04 | 2.02e-04 | 14 |
| hsa0414519 | Breast | Precancer | Phagosome | 27/684 | 152/8465 | 7.37e-05 | 6.85e-04 | 5.25e-04 | 27 |
| hsa0532313 | Breast | Precancer | Rheumatoid arthritis | 19/684 | 93/8465 | 1.30e-04 | 1.14e-03 | 8.73e-04 | 19 |
| hsa0512013 | Breast | Precancer | Epithelial cell signaling in Helicobacter pylori infection | 14/684 | 70/8465 | 1.21e-03 | 7.99e-03 | 6.12e-03 | 14 |
| hsa0019023 | Breast | IDC | Oxidative phosphorylation | 62/867 | 134/8465 | 4.78e-27 | 2.59e-25 | 1.94e-25 | 62 |
| hsa0511022 | Breast | IDC | Vibrio cholerae infection | 17/867 | 50/8465 | 4.82e-06 | 6.82e-05 | 5.10e-05 | 17 |
| hsa0414522 | Breast | IDC | Phagosome | 34/867 | 152/8465 | 8.00e-06 | 9.99e-05 | 7.48e-05 | 34 |
| hsa0532321 | Breast | IDC | Rheumatoid arthritis | 21/867 | 93/8465 | 3.69e-04 | 3.15e-03 | 2.36e-03 | 21 |
| hsa0512022 | Breast | IDC | Epithelial cell signaling in Helicobacter pylori infection | 16/867 | 70/8465 | 1.56e-03 | 1.13e-02 | 8.42e-03 | 16 |
| hsa0019033 | Breast | IDC | Oxidative phosphorylation | 62/867 | 134/8465 | 4.78e-27 | 2.59e-25 | 1.94e-25 | 62 |
| hsa0511032 | Breast | IDC | Vibrio cholerae infection | 17/867 | 50/8465 | 4.82e-06 | 6.82e-05 | 5.10e-05 | 17 |
| hsa0414532 | Breast | IDC | Phagosome | 34/867 | 152/8465 | 8.00e-06 | 9.99e-05 | 7.48e-05 | 34 |
| hsa0532331 | Breast | IDC | Rheumatoid arthritis | 21/867 | 93/8465 | 3.69e-04 | 3.15e-03 | 2.36e-03 | 21 |
| hsa0512032 | Breast | IDC | Epithelial cell signaling in Helicobacter pylori infection | 16/867 | 70/8465 | 1.56e-03 | 1.13e-02 | 8.42e-03 | 16 |
| Hugo Symbol | Variant Class | Variant Classification | dbSNP RS | HGVSc | HGVSp | HGVSp Short | SWISSPROT | BIOTYPE | SIFT | PolyPhen | Tumor Sample Barcode | Tissue | Histology | Sex | Age | Stage | Therapy Types | Drugs | Outcome |
| ATP6V0B | SNV | Missense_Mutation | | c.323N>A | p.Ala108Glu | p.A108E | | protein_coding | deleterious(0) | probably_damaging(0.993) | TCGA-A8-A09A-01 | Breast | breast invasive carcinoma | Female | <65 | I/II | Hormone Therapy | tamoxiphen | SD |
| ATP6V0B | SNV | Missense_Mutation | novel | c.115T>C | p.Trp39Arg | p.W39R | | protein_coding | tolerated(0.16) | benign(0.01) | TCGA-AC-A5EH-01 | Breast | breast invasive carcinoma | Female | >=65 | I/II | Unknown | Unknown | SD |
| ATP6V0B | SNV | Missense_Mutation | novel | c.203G>T | p.Gly68Val | p.G68V | | protein_coding | deleterious(0) | probably_damaging(1) | TCGA-AQ-A1H2-01 | Breast | breast invasive carcinoma | Female | >=65 | III/IV | Chemotherapy | herceptin | SD |
| ATP6V0B | SNV | Missense_Mutation | novel | c.617N>A | p.Leu206Gln | p.L206Q | | protein_coding | deleterious_low_confidence(0.04) | benign(0) | TCGA-D8-A13Z-01 | Breast | breast invasive carcinoma | Female | <65 | I/II | Chemotherapy | doxorubicine | SD |
| ATP6V0B | SNV | Missense_Mutation | novel | c.127G>C | p.Glu43Gln | p.E43Q | | protein_coding | tolerated(0.16) | benign(0.053) | TCGA-LL-A73Y-01 | Breast | breast invasive carcinoma | Female | >=65 | I/II | Chemotherapy | taxotere | SD |
| ATP6V0B | SNV | Missense_Mutation | novel | c.578T>C | p.Val193Ala | p.V193A | | protein_coding | deleterious(0.02) | possibly_damaging(0.897) | TCGA-CM-5861-01 | Colorectum | colon adenocarcinoma | Female | <65 | I/II | Unknown | Unknown | PD |
| ATP6V0B | SNV | Missense_Mutation | | c.586C>A | p.Leu196Ile | p.L196I | | protein_coding | tolerated(0.41) | benign(0.23) | TCGA-AG-A002-01 | Colorectum | rectum adenocarcinoma | Male | <65 | I/II | Unknown | Unknown | SD |
| ATP6V0B | SNV | Missense_Mutation | rs758360388 | c.496N>A | p.Asp166Asn | p.D166N | | protein_coding | deleterious(0.04) | probably_damaging(0.989) | TCGA-A5-A0VP-01 | Endometrium | uterine corpus endometrioid carcinoma | Female | >=65 | I/II | Unknown | Unknown | SD |
| ATP6V0B | SNV | Missense_Mutation | novel | c.218G>A | p.Gly73Asp | p.G73D | | protein_coding | deleterious(0.01) | probably_damaging(1) | TCGA-AJ-A23O-01 | Endometrium | uterine corpus endometrioid carcinoma | Female | >=65 | I/II | Unknown | Unknown | SD |
| ATP6V0B | SNV | Missense_Mutation | rs775714078 | c.553G>A | p.Ala185Thr | p.A185T | | protein_coding | deleterious(0) | probably_damaging(0.978) | TCGA-AJ-A3BH-01 | Endometrium | uterine corpus endometrioid carcinoma | Female | Unknown | I/II | Unknown | Unknown | SD |


