
|
|||||
|
 | |
| |
| |
| |
| |
| |
|
Gene: ATP6AP1L |
Gene summary for ATP6AP1L |
| Gene information | Species | Human | Gene symbol | ATP6AP1L | Gene ID | 92270 |
| Gene name | ATPase H+ transporting accessory protein 1 like (pseudogene) | |
| Gene Alias | ATP6AP1L | |
| Cytomap | 5q14.2 | |
| Gene Type | pseudo | GO ID | NA | UniProtAcc | NA |
Top |
Malignant transformation analysis |
| Identification of the aberrant gene expression in precancerous and cancerous lesions by comparing the gene expression of stem-like cells in diseased tissues with normal stem cells |
| Entrez ID | Symbol | Replicates | Species | Organ | Tissue | Adj P-value | Log2FC | Malignancy |
| 92270 | ATP6AP1L | HCC1 | Human | Liver | HCC | 2.26e-06 | 2.63e+00 | 0.5336 |
| 92270 | ATP6AP1L | HCC2 | Human | Liver | HCC | 2.90e-16 | 1.97e+00 | 0.5341 |
| 92270 | ATP6AP1L | HCC5 | Human | Liver | HCC | 6.15e-08 | 1.64e+00 | 0.4932 |
| 92270 | ATP6AP1L | PTC04 | Human | Thyroid | PTC | 1.15e-03 | 1.00e-01 | 0.1927 |
| 92270 | ATP6AP1L | PTC05 | Human | Thyroid | PTC | 8.07e-04 | 2.08e-01 | 0.2065 |
| 92270 | ATP6AP1L | PTC06 | Human | Thyroid | PTC | 1.58e-07 | 2.50e-01 | 0.2057 |
| 92270 | ATP6AP1L | PTC07 | Human | Thyroid | PTC | 1.21e-04 | 1.14e-01 | 0.2044 |
| 92270 | ATP6AP1L | ATC13 | Human | Thyroid | ATC | 5.43e-04 | 1.09e-01 | 0.34 |
| 92270 | ATP6AP1L | ATC2 | Human | Thyroid | ATC | 5.95e-07 | 7.87e-01 | 0.34 |
| 92270 | ATP6AP1L | ATC5 | Human | Thyroid | ATC | 2.74e-06 | 1.19e-01 | 0.34 |
| Page: 1 |
| Tissue | Expression Dynamics | Abbreviation |
| Liver | 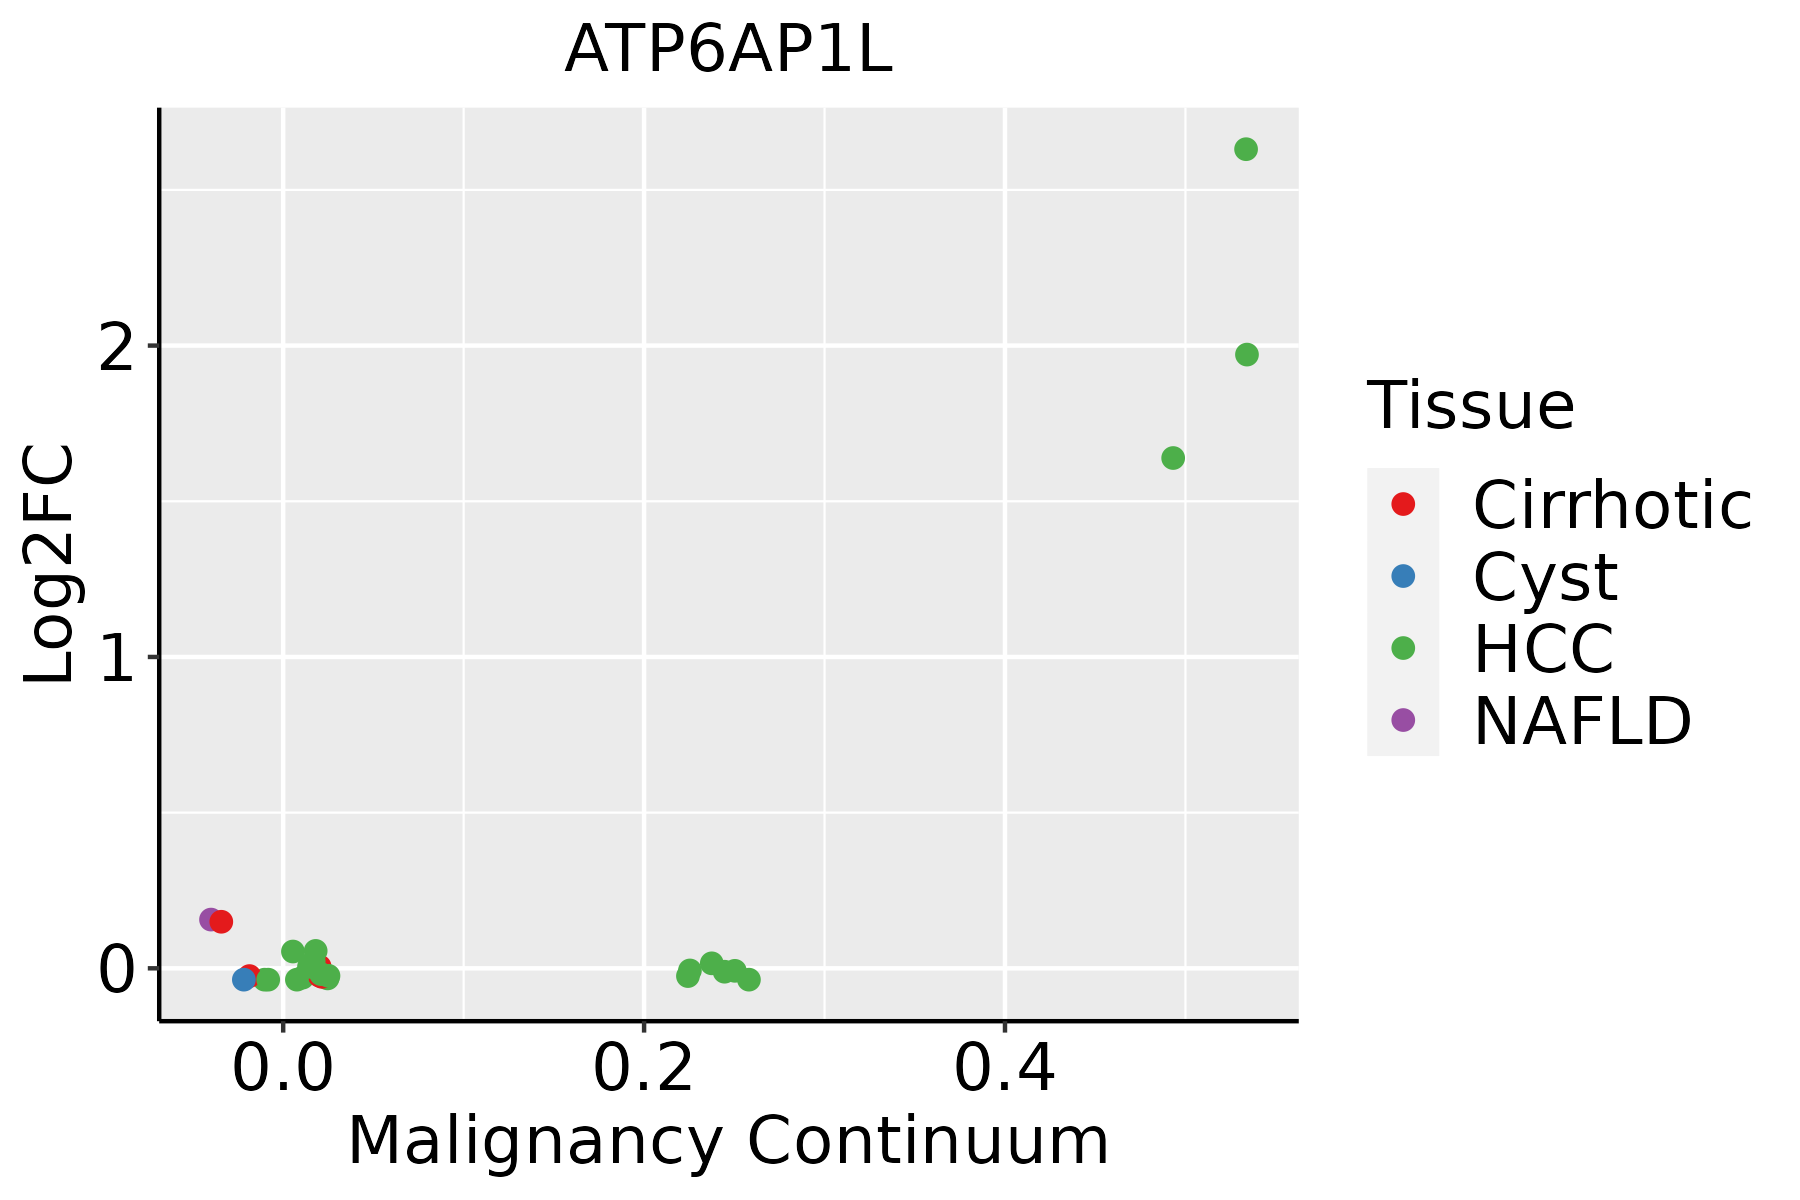 | HCC: Hepatocellular carcinoma |
| NAFLD: Non-alcoholic fatty liver disease | ||
| Thyroid | 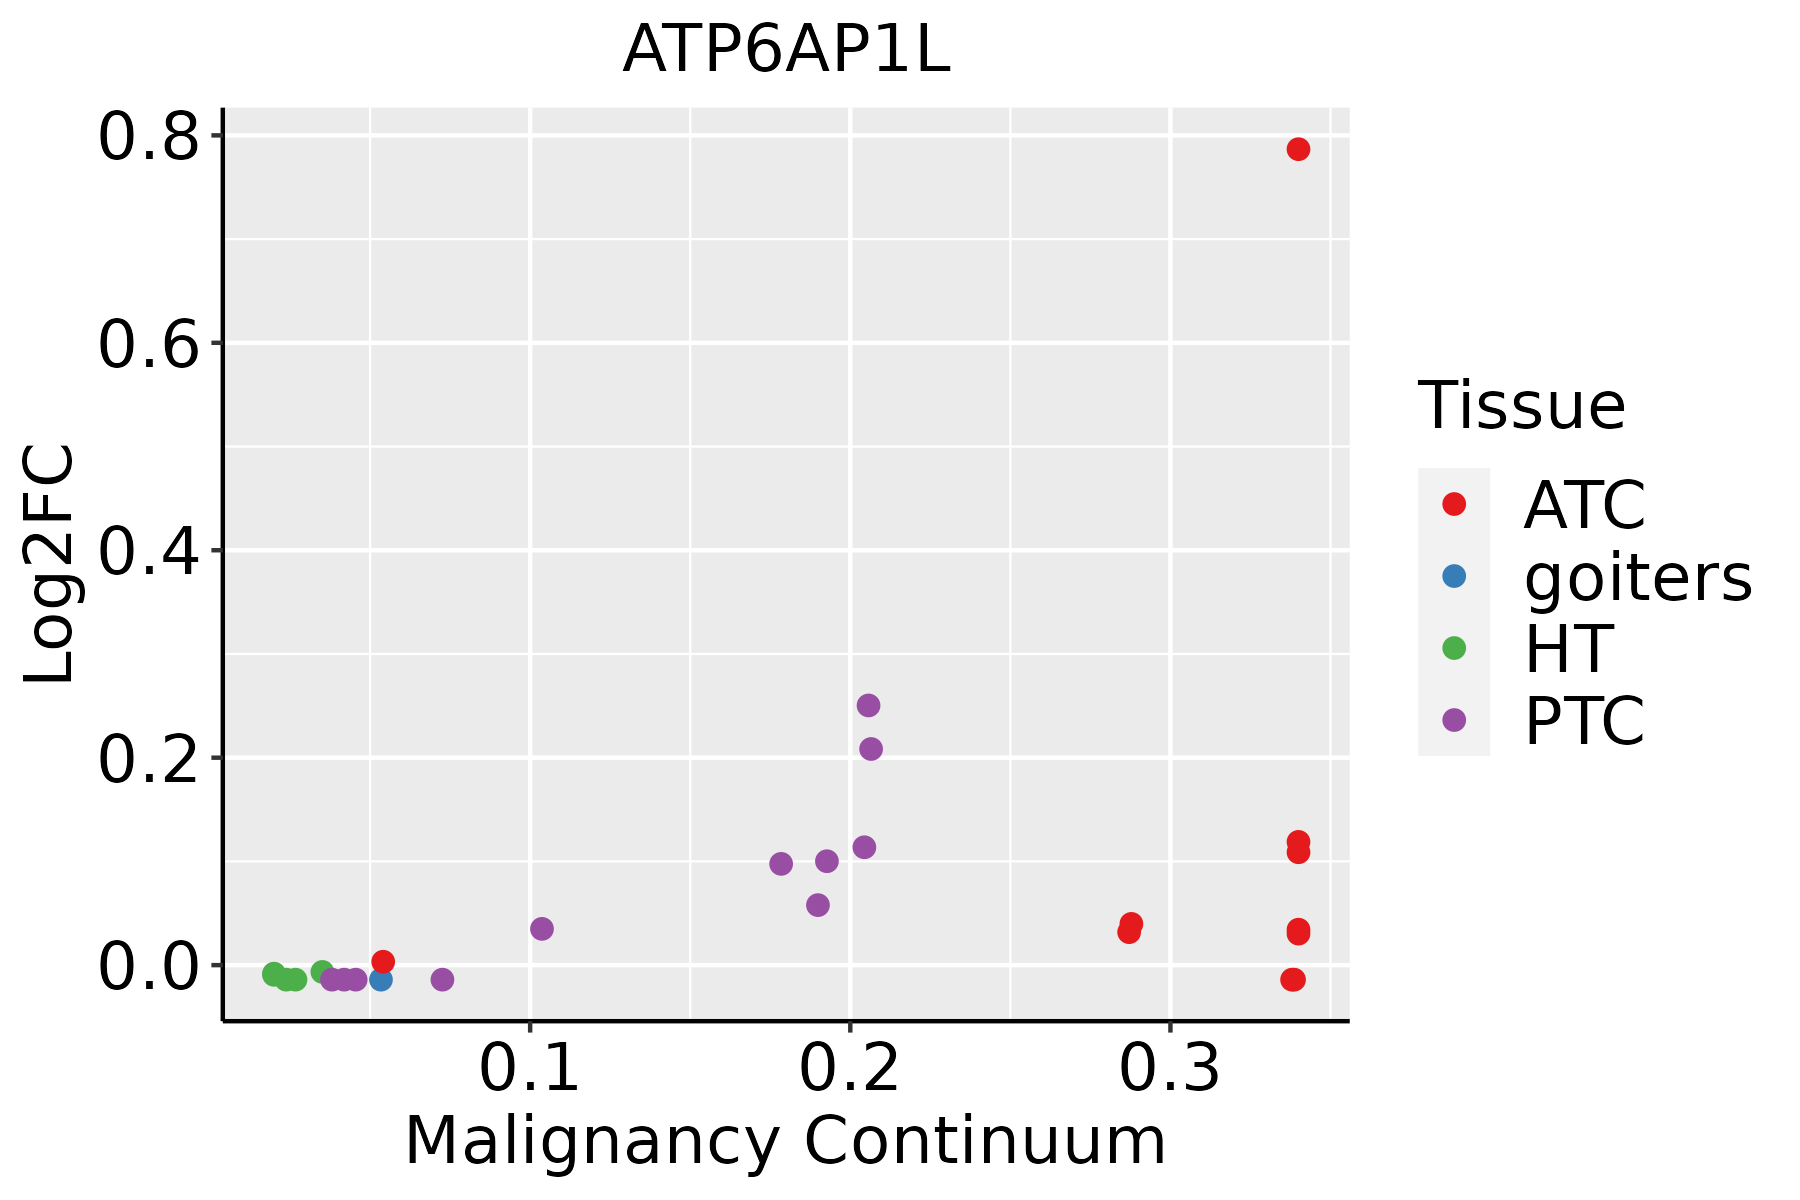 | ATC: Anaplastic thyroid cancer |
| HT: Hashimoto's thyroiditis | ||
| PTC: Papillary thyroid cancer |
| ∗log2FC in expression of this searched gene in stem-like cells from each diseased tissue sample relative to stem-like cells in normal samples in each tissue plotted against the malignancy continuum. Samples are colored based on if they are from different disease stage. |
Top |
Malignant transformation related pathway analysis |
| Find out the enriched GO biological processes and KEGG pathways involved in transition from healthy to precancer to cancer |
| Tissue | Disease Stage | Enriched GO biological Processes |
| Colorectum | AD |  |
| Colorectum | SER |  |
| Colorectum | MSS |  |
| Colorectum | MSI-H |  |
| Colorectum | FAP |  |
| ∗Top 15 enriched GO BP terms are showed in the bar plot of each disease state in each tissue. Each row represents a significant GO biological process which is colored according to the -log10(p.adjust). |
| Page: 1 2 3 4 5 6 7 8 9 |
| GO ID | Tissue | Disease Stage | Description | Gene Ratio | Bg Ratio | pvalue | p.adjust | Count |
| Page: 1 |
| Pathway ID | Tissue | Disease Stage | Description | Gene Ratio | Bg Ratio | pvalue | p.adjust | qvalue | Count |
| Page: 1 |
Top |
Cell-cell communication analysis |
| Identification of potential cell-cell interactions between two cell types and their ligand-receptor pairs for different disease states |
| Ligand | Receptor | LRpair | Pathway | Tissue | Disease Stage |
| Page: 1 |
Top |
Single-cell gene regulatory network inference analysis |
| Find out the significant the regulons (TFs) and the target genes of each regulon across cell types for different disease states |
| TF | Cell Type | Tissue | Disease Stage | Target Gene | RSS | Regulon Activity |
| ∗The dot plots of a searched regulon are shown for all cell subpopulations in each disease state of each tissue based on the regulon specific score inferred using pySCENIC and by calculating the average expression. |
| Page: 1 |
Top |
Somatic mutation of malignant transformation related genes |
| Annotation of somatic variants for genes involved in malignant transformation |
| Hugo Symbol | Variant Class | Variant Classification | dbSNP RS | HGVSc | HGVSp | HGVSp Short | SWISSPROT | BIOTYPE | SIFT | PolyPhen | Tumor Sample Barcode | Tissue | Histology | Sex | Age | Stage | Therapy Types | Drugs | Outcome |
| ATP6AP1L | SNV | Missense_Mutation | c.641T>C | p.Leu214Pro | p.L214P | Q52LC2 | protein_coding | deleterious(0) | probably_damaging(0.988) | TCGA-BH-A1FU-01 | Breast | breast invasive carcinoma | Female | <65 | I/II | Unknown | Unknown | PD | |
| ATP6AP1L | SNV | Missense_Mutation | rs550926078 | c.521G>A | p.Arg174Gln | p.R174Q | Q52LC2 | protein_coding | deleterious(0.03) | benign(0.05) | TCGA-5M-AAT6-01 | Colorectum | colon adenocarcinoma | Female | <65 | III/IV | Unknown | Unknown | PD |
| ATP6AP1L | SNV | Missense_Mutation | c.589N>G | p.Thr197Ala | p.T197A | Q52LC2 | protein_coding | tolerated(1) | benign(0) | TCGA-A6-5665-01 | Colorectum | colon adenocarcinoma | Female | >=65 | I/II | Unknown | Unknown | PD | |
| ATP6AP1L | SNV | Missense_Mutation | c.562N>T | p.His188Tyr | p.H188Y | Q52LC2 | protein_coding | tolerated(0.54) | benign(0.005) | TCGA-AA-3975-01 | Colorectum | colon adenocarcinoma | Male | >=65 | I/II | Unknown | Unknown | SD | |
| ATP6AP1L | SNV | Missense_Mutation | c.160N>C | p.Ser54Pro | p.S54P | Q52LC2 | protein_coding | tolerated(0.1) | benign(0.027) | TCGA-D5-6930-01 | Colorectum | colon adenocarcinoma | Male | >=65 | I/II | Unknown | Unknown | SD | |
| ATP6AP1L | SNV | Missense_Mutation | c.664N>C | p.Ile222Leu | p.I222L | Q52LC2 | protein_coding | deleterious(0.03) | benign(0.003) | TCGA-A5-A0GP-01 | Endometrium | uterine corpus endometrioid carcinoma | Female | <65 | I/II | Unknown | Unknown | SD | |
| ATP6AP1L | SNV | Missense_Mutation | novel | c.184N>T | p.Arg62Cys | p.R62C | Q52LC2 | protein_coding | deleterious(0) | benign(0.34) | TCGA-A5-A2K5-01 | Endometrium | uterine corpus endometrioid carcinoma | Female | >=65 | I/II | Unknown | Unknown | SD |
| ATP6AP1L | SNV | Missense_Mutation | rs374101966 | c.277N>T | p.Arg93Cys | p.R93C | Q52LC2 | protein_coding | tolerated(0.12) | benign(0.001) | TCGA-AP-A05O-01 | Endometrium | uterine corpus endometrioid carcinoma | Female | >=65 | I/II | Chemotherapy | carboplatin | PD |
| ATP6AP1L | SNV | Missense_Mutation | rs746756477 | c.569N>T | p.Ser190Leu | p.S190L | Q52LC2 | protein_coding | deleterious(0.03) | benign(0) | TCGA-AX-A05Z-01 | Endometrium | uterine corpus endometrioid carcinoma | Female | <65 | III/IV | Chemotherapy | adriamycin | SD |
| ATP6AP1L | SNV | Missense_Mutation | rs774830030 | c.595N>A | p.Glu199Lys | p.E199K | Q52LC2 | protein_coding | tolerated(0.08) | benign(0.007) | TCGA-B5-A11E-01 | Endometrium | uterine corpus endometrioid carcinoma | Female | <65 | I/II | Unknown | Unknown | SD |
| Page: 1 2 3 |
Top |
Related drugs of malignant transformation related genes |
| Identification of chemicals and drugs interact with genes involved in malignant transfromation |
| (DGIdb 4.0) |
| Entrez ID | Symbol | Category | Interaction Types | Drug Claim Name | Drug Name | PMIDs |
| Page: 1 |

Copyright 2023-Present -The University of Texas Health Science Center at Houston |