| Tissue | Expression Dynamics | Abbreviation |
| Breast |  | IDC: Invasive ductal carcinoma |
| DCIS: Ductal carcinoma in situ |
| Precancer(BRCA1-mut): Precancerous lesion from BRCA1 mutation carriers |
| Cervix | 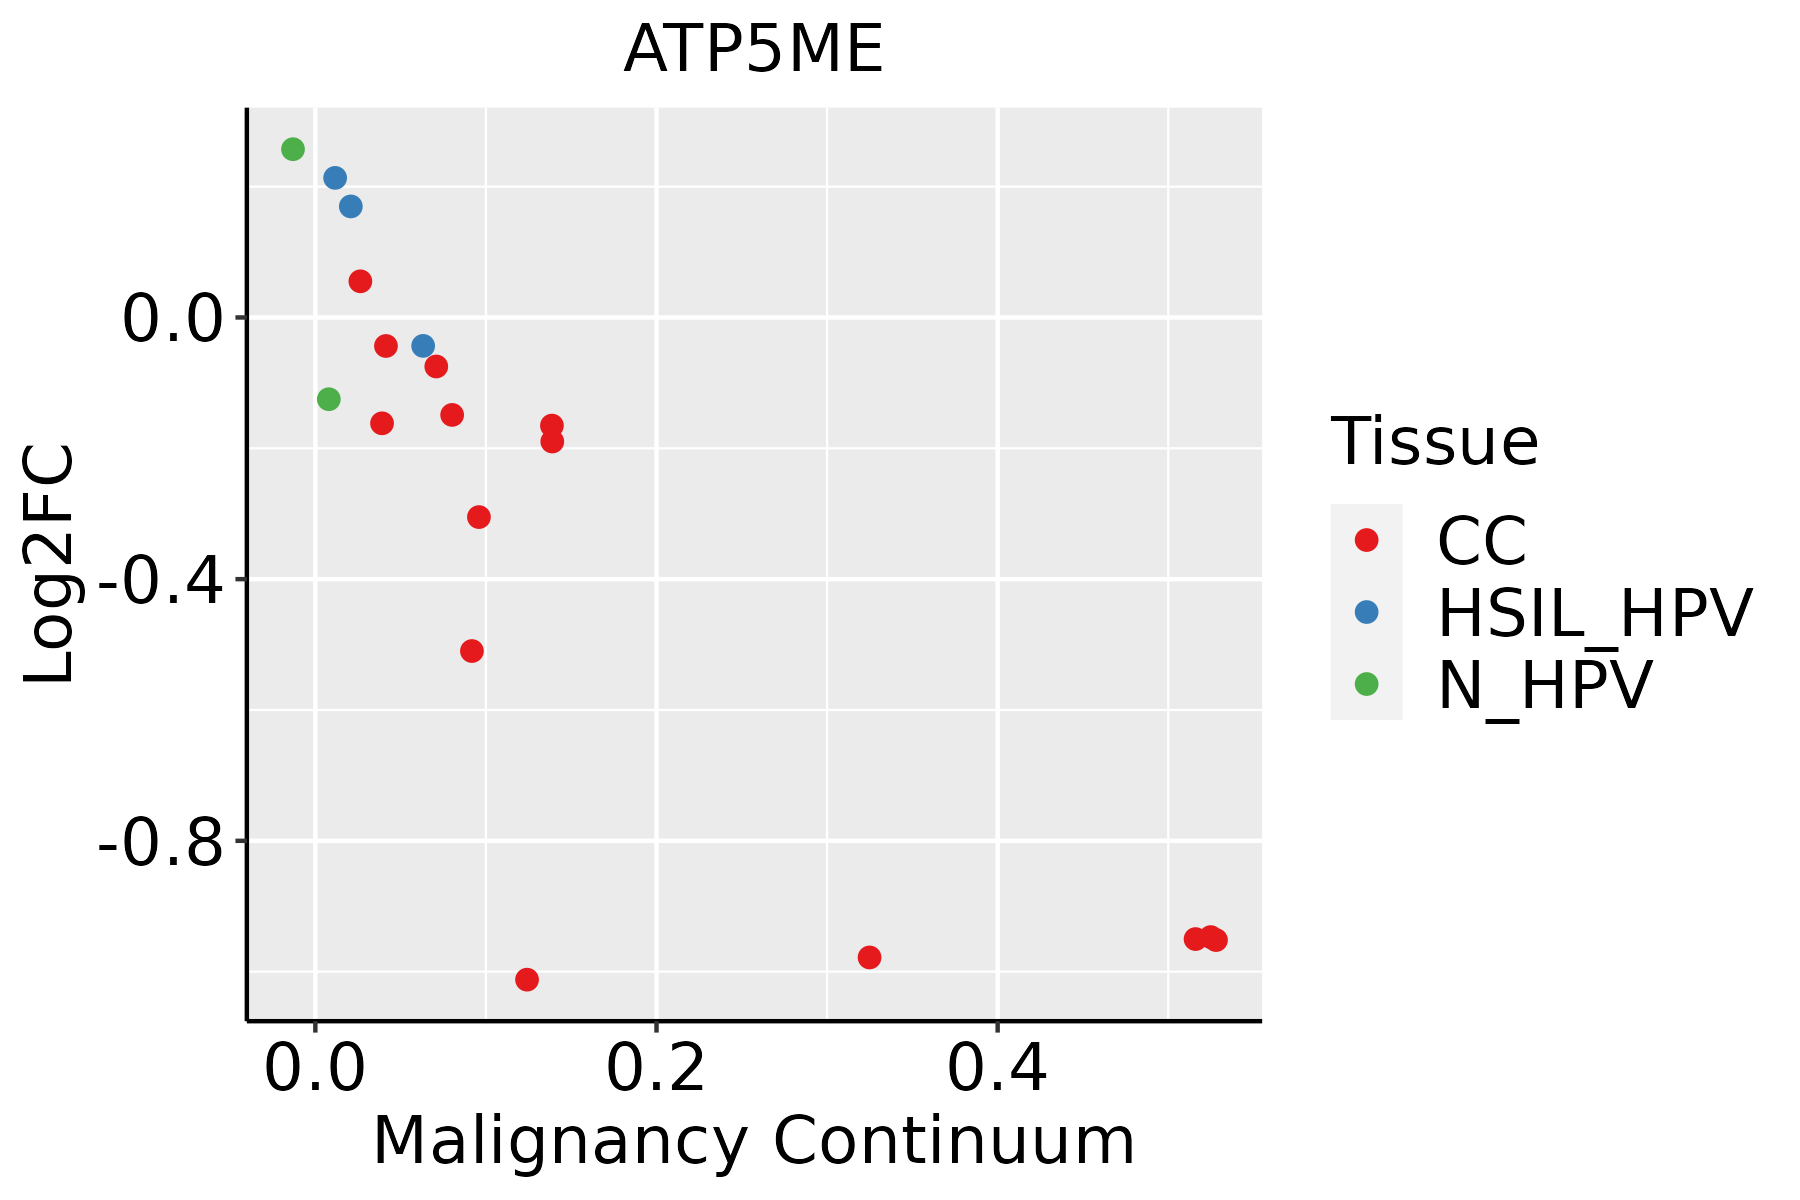 | CC: Cervix cancer |
| HSIL_HPV: HPV-infected high-grade squamous intraepithelial lesions |
| N_HPV: HPV-infected normal cervix |
| Colorectum (GSE201348) |  | FAP: Familial adenomatous polyposis |
| CRC: Colorectal cancer |
| Colorectum (HTA11) |  | AD: Adenomas |
| SER: Sessile serrated lesions |
| MSI-H: Microsatellite-high colorectal cancer |
| MSS: Microsatellite stable colorectal cancer |
| Endometrium | 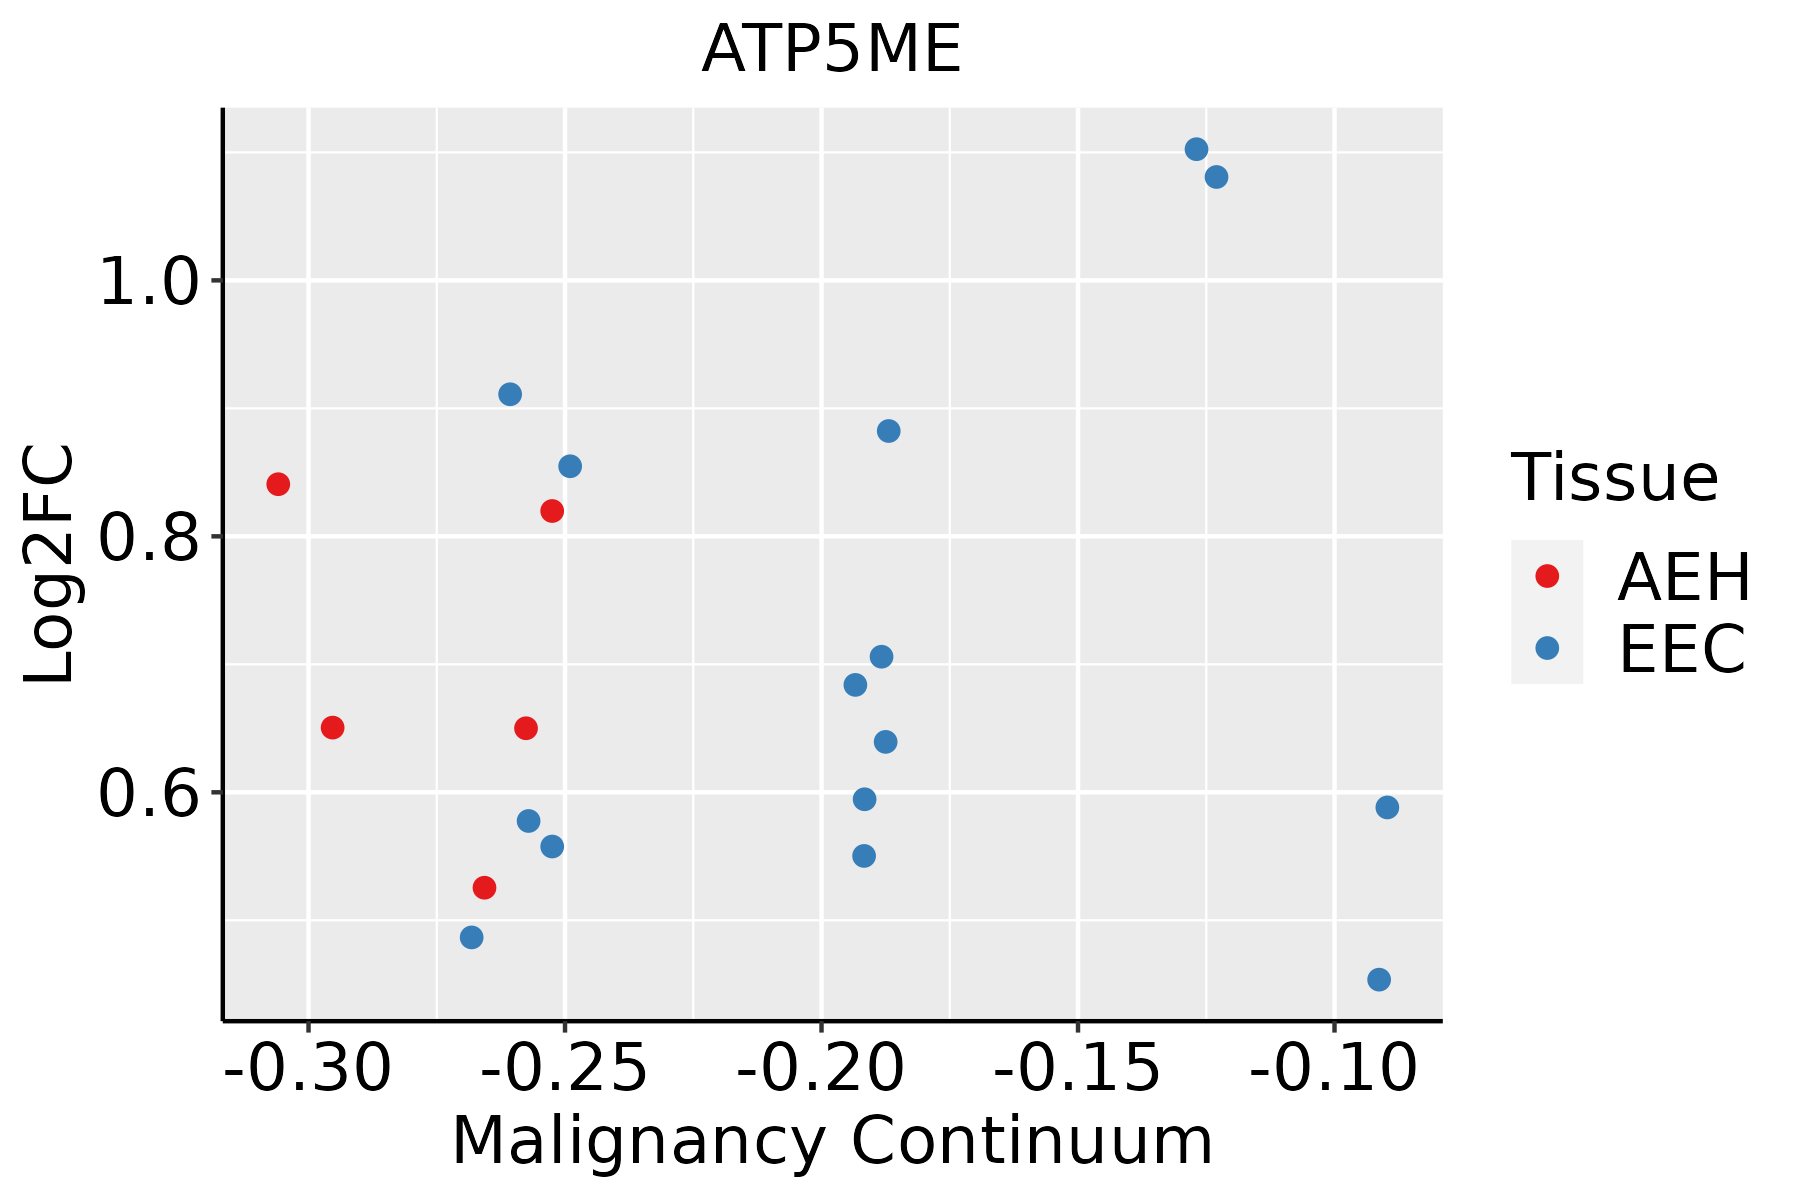 | AEH: Atypical endometrial hyperplasia |
| EEC: Endometrioid Cancer |
| Esophagus | 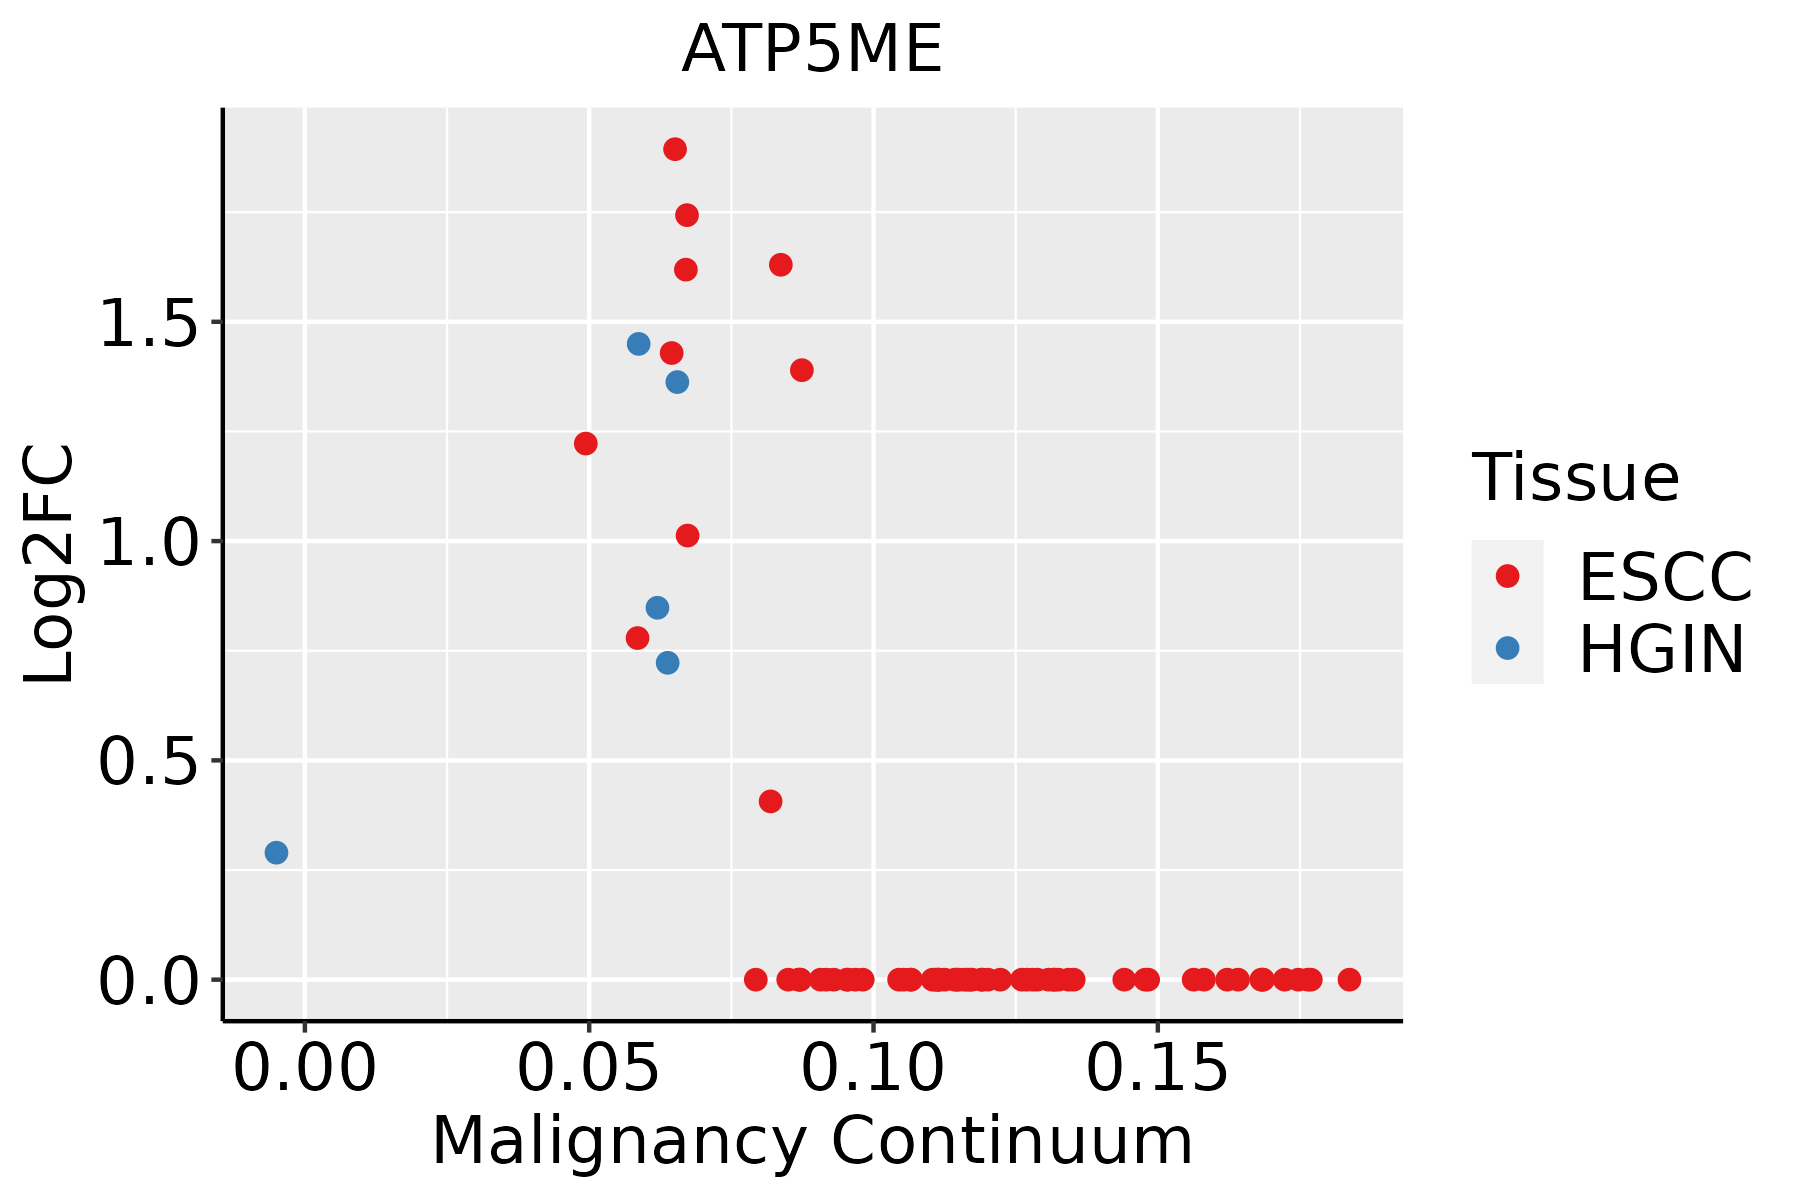 | ESCC: Esophageal squamous cell carcinoma |
| HGIN: High-grade intraepithelial neoplasias |
| LGIN: Low-grade intraepithelial neoplasias |
| GC | 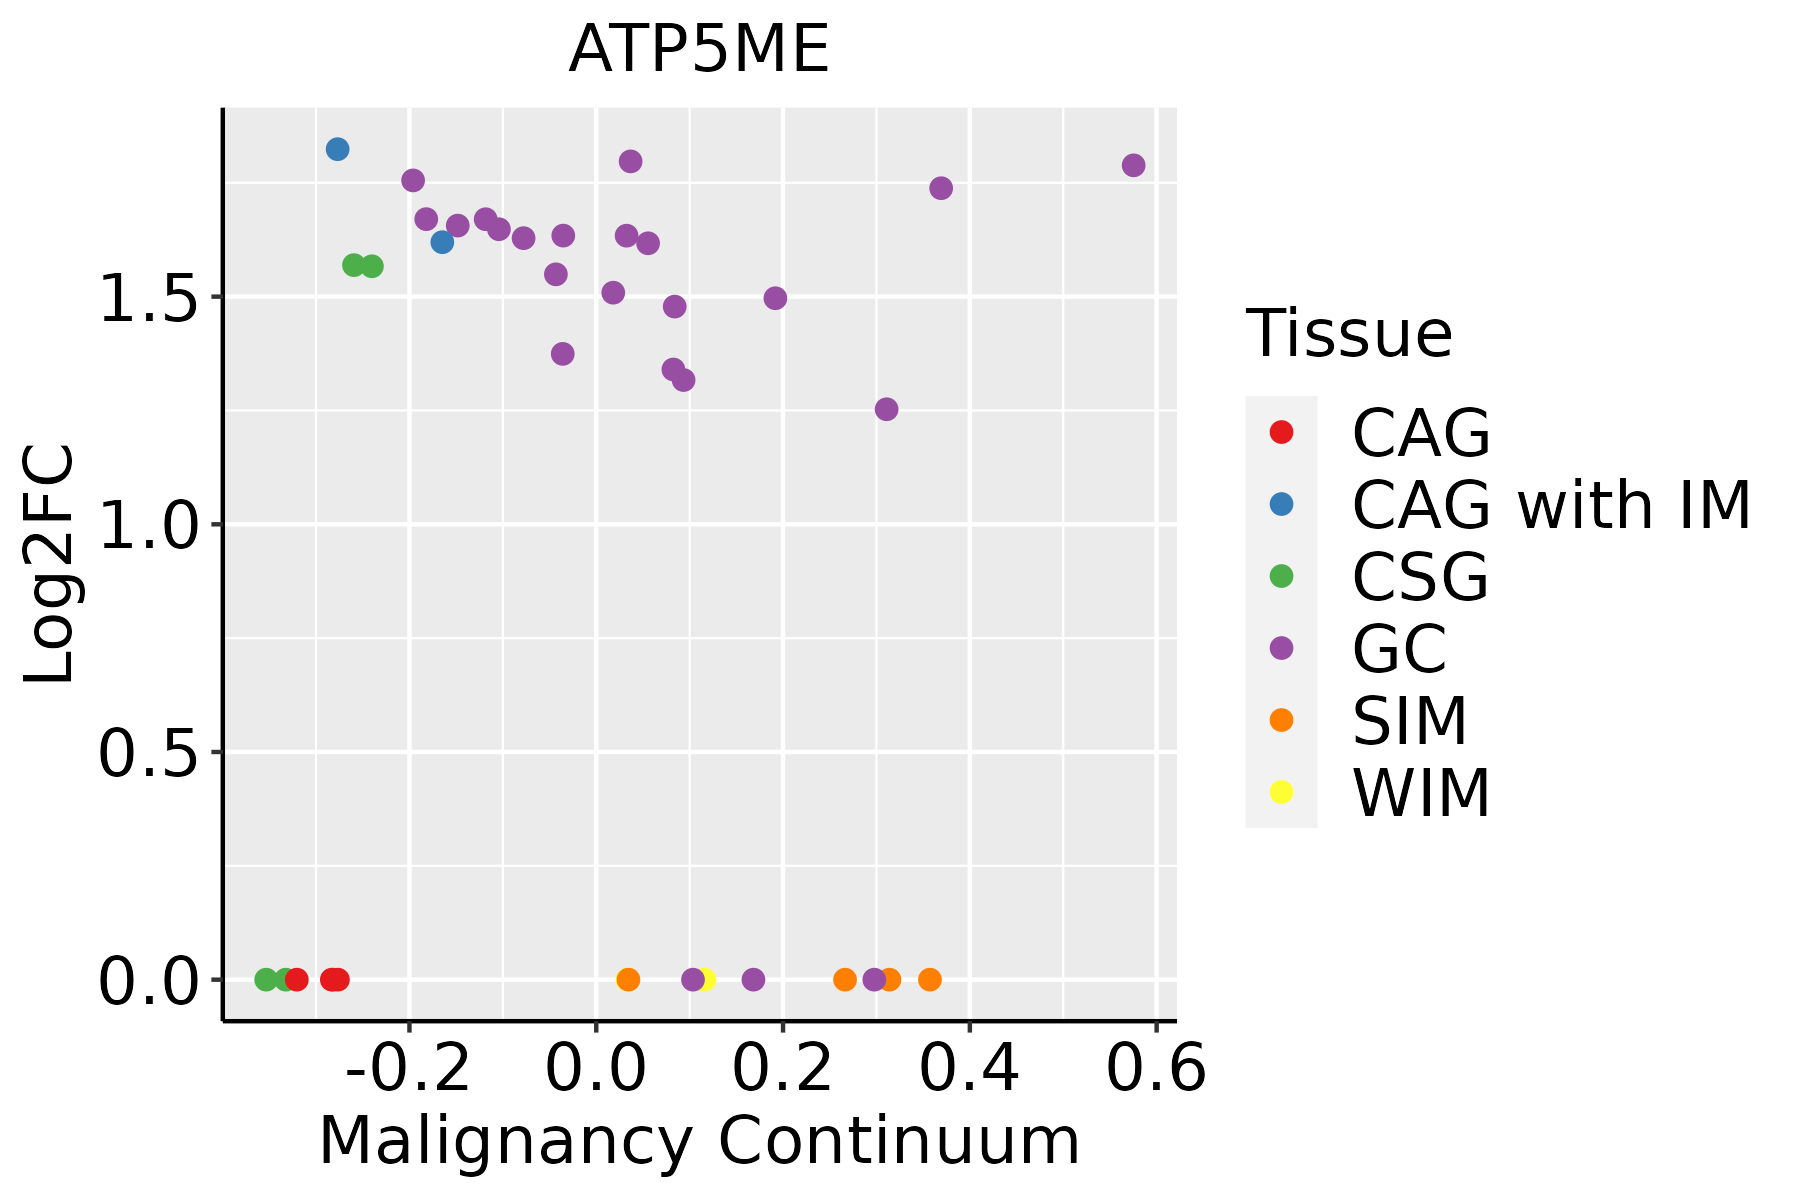 | CAG: Chronic atrophic gastritis |
| CAG with IM: Chronic atrophic gastritis with intestinal metaplasia |
| CSG: Chronic superficial gastritis |
| GC: Gastric cancer |
| SIM: Severe intestinal metaplasia |
| WIM: Wild intestinal metaplasia |
| Liver | 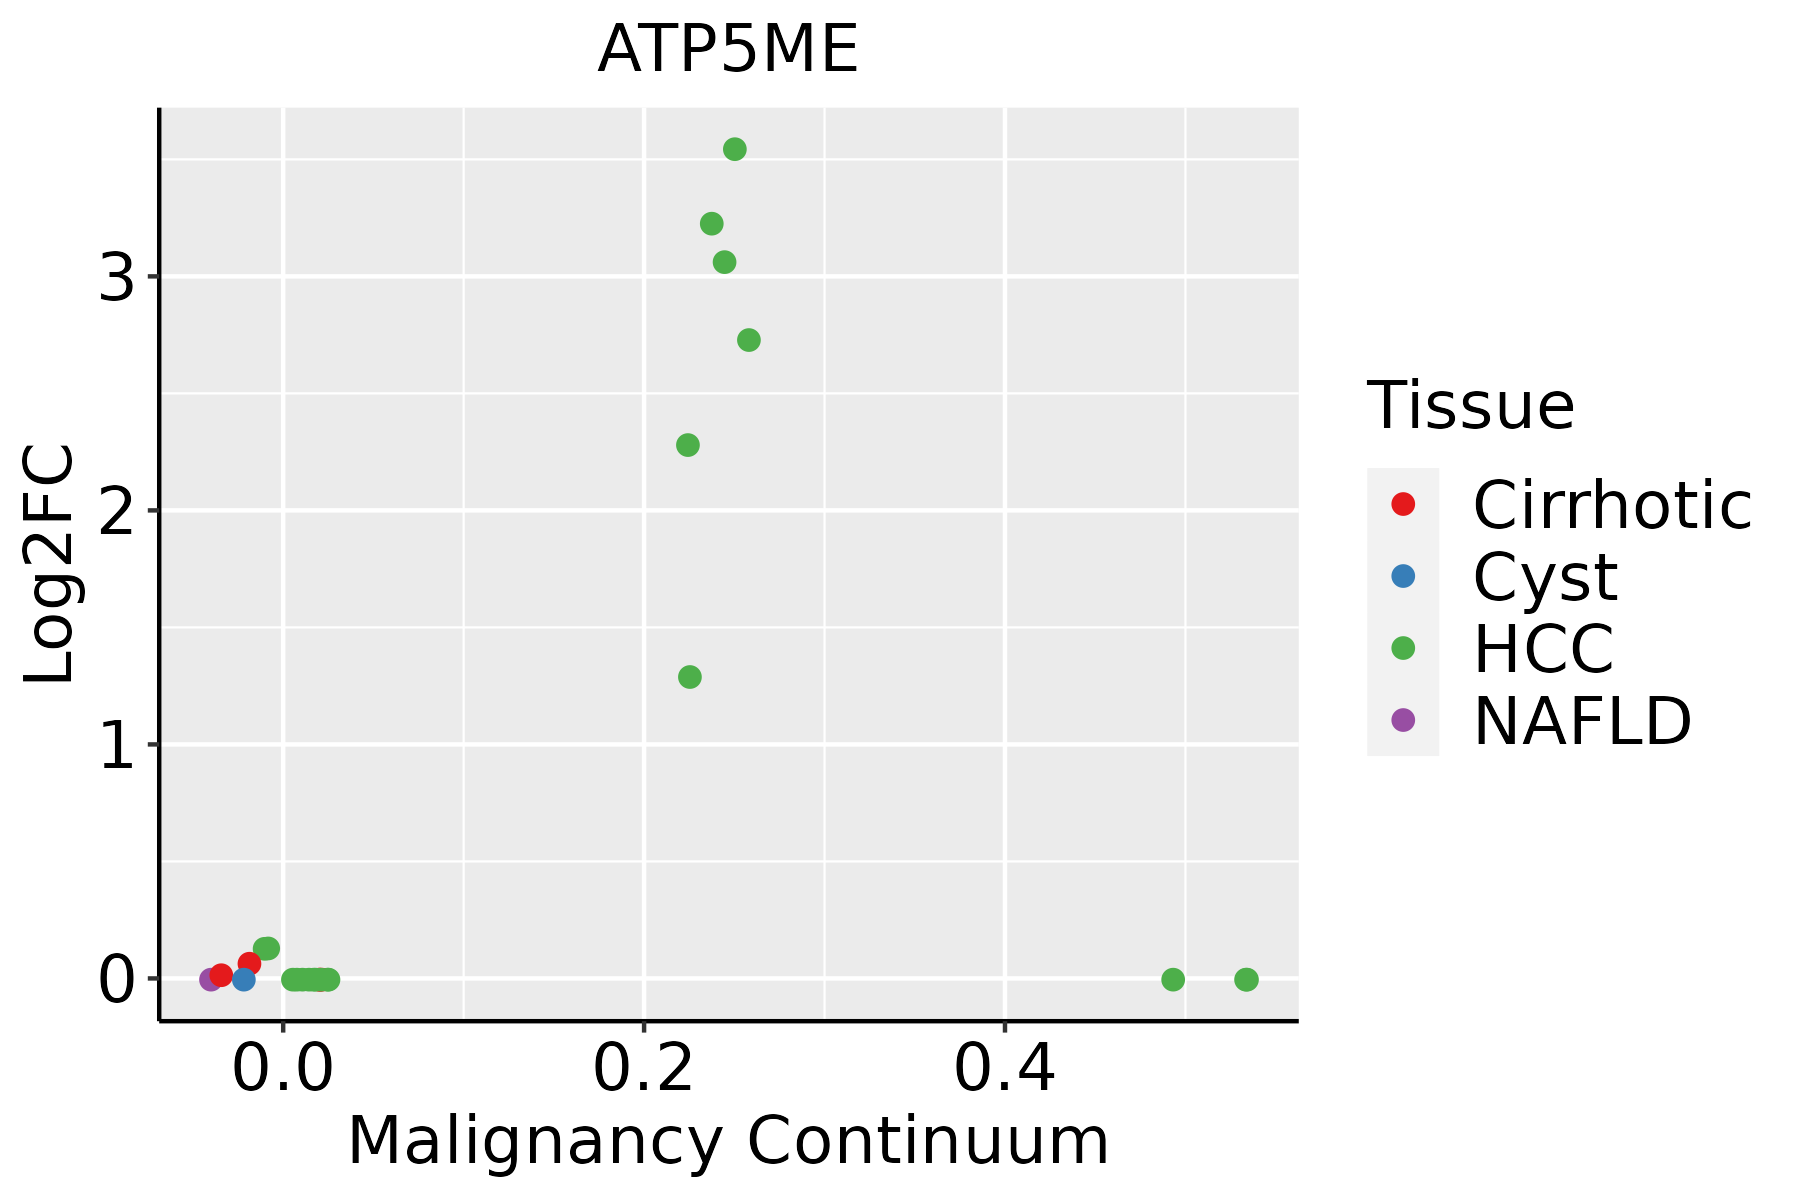 | HCC: Hepatocellular carcinoma |
| NAFLD: Non-alcoholic fatty liver disease |
| Lung |  | AAH: Atypical adenomatous hyperplasia |
| AIS: Adenocarcinoma in situ |
| IAC: Invasive lung adenocarcinoma |
| MIA: Minimally invasive adenocarcinoma |
| Prostate | 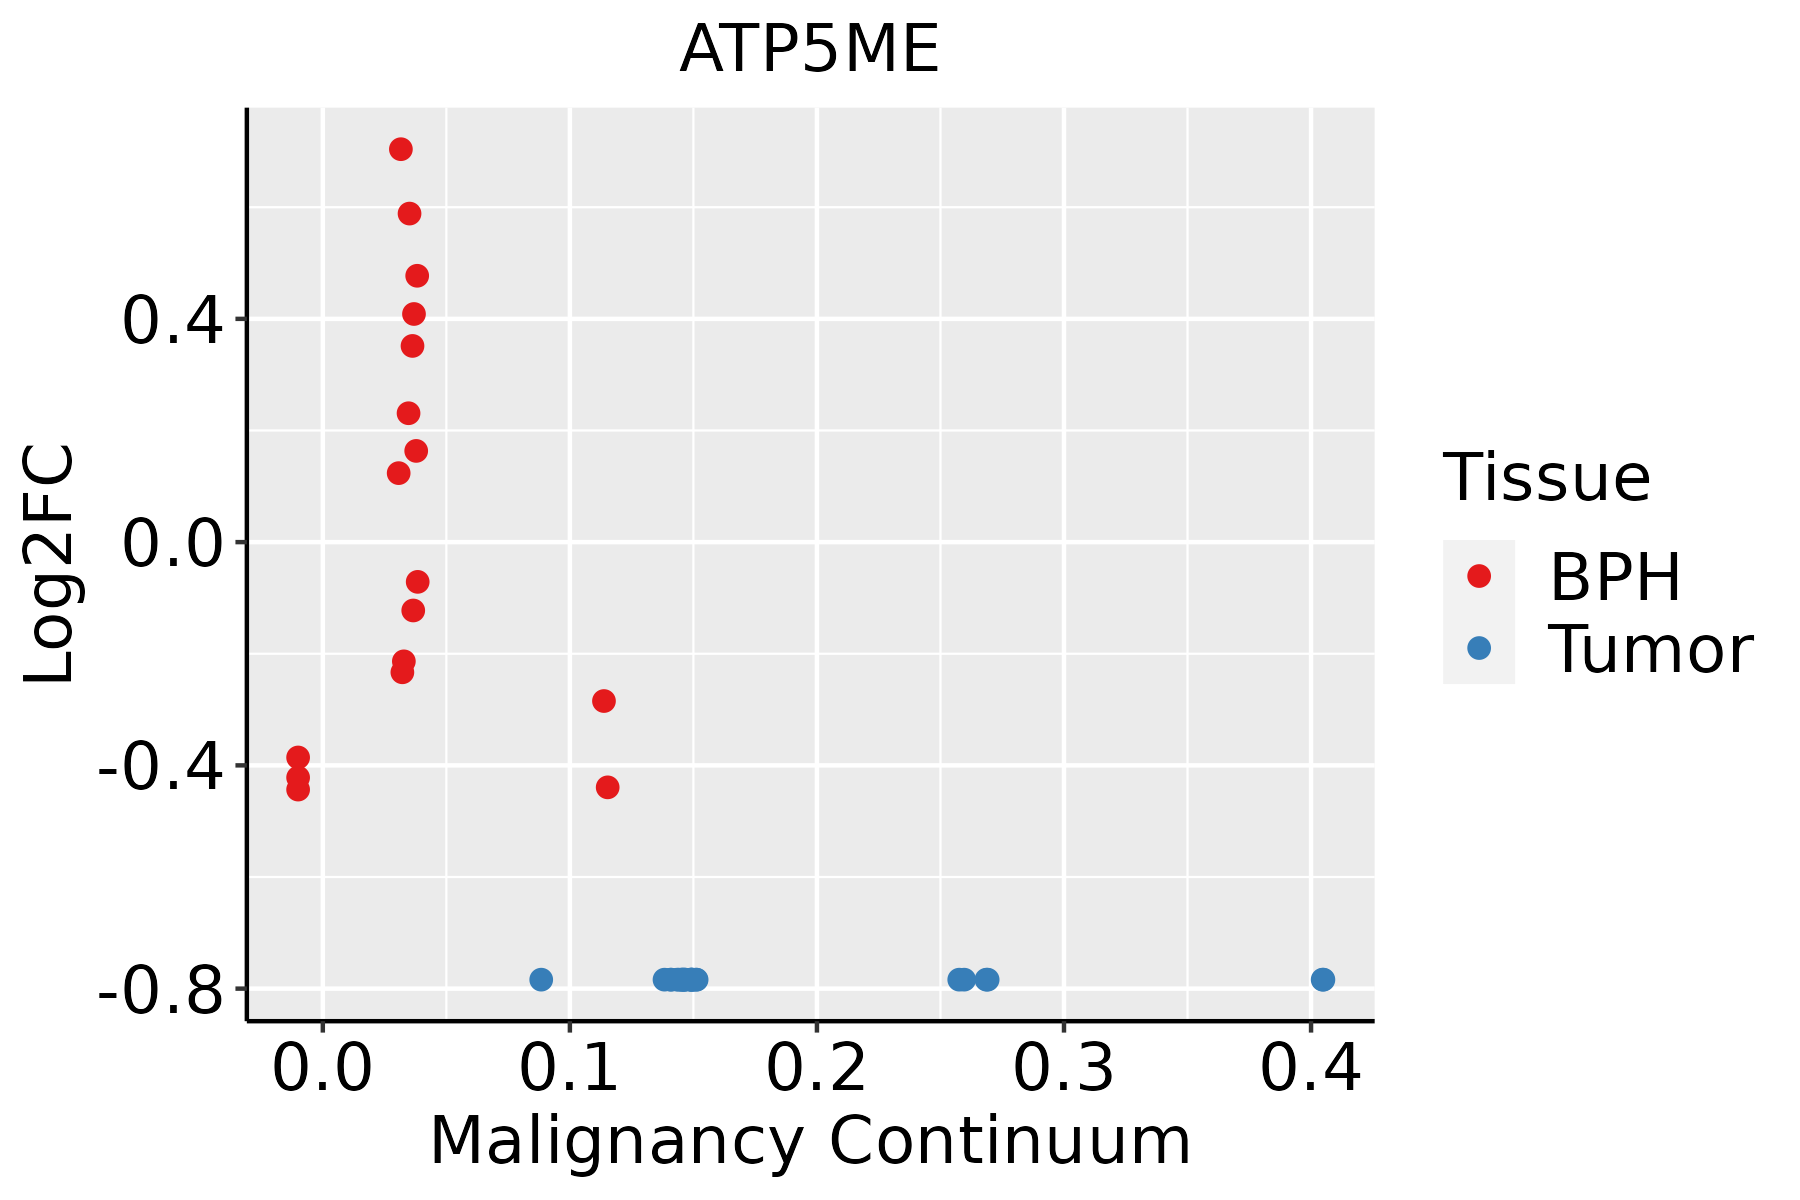 | BPH: Benign Prostatic Hyperplasia |
| Skin | 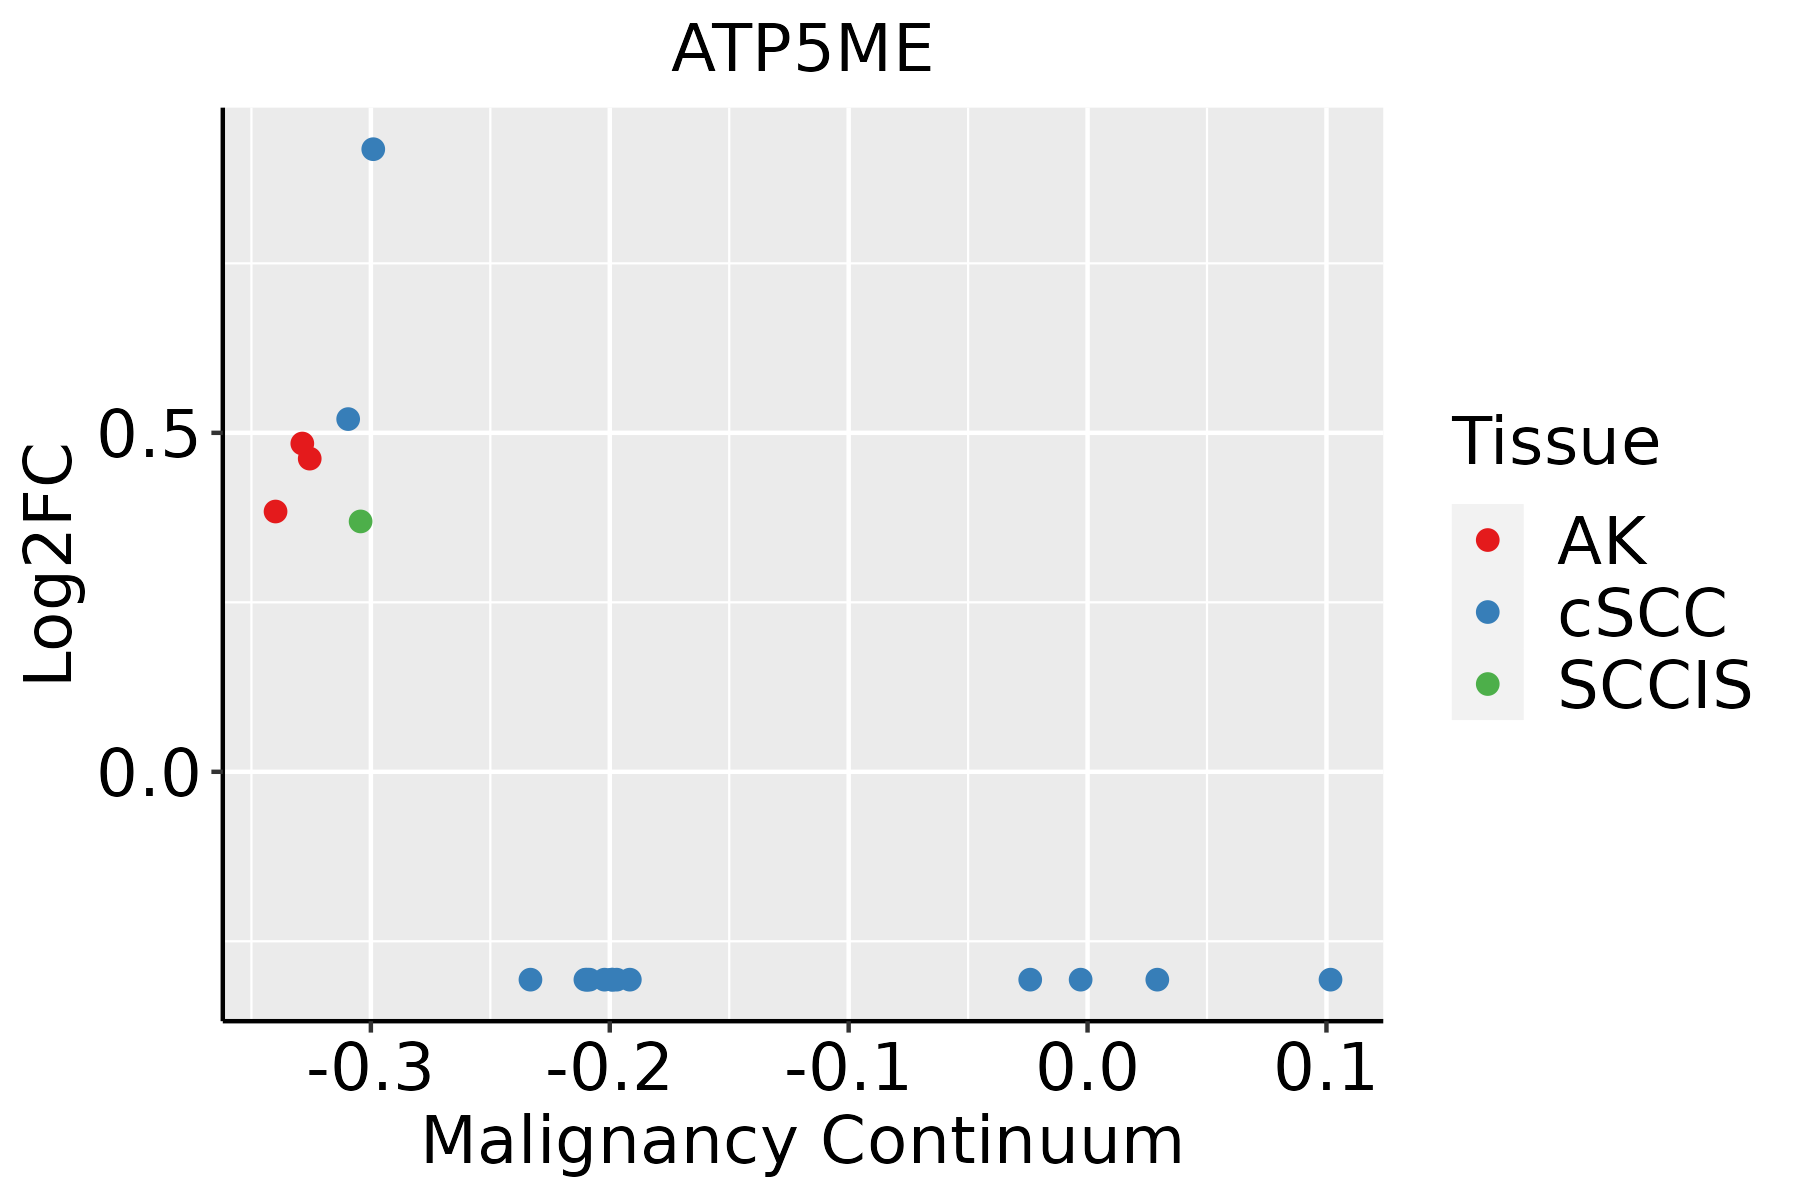 | AK: Actinic keratosis |
| cSCC: Cutaneous squamous cell carcinoma |
| SCCIS:squamous cell carcinoma in situ |
| Thyroid | 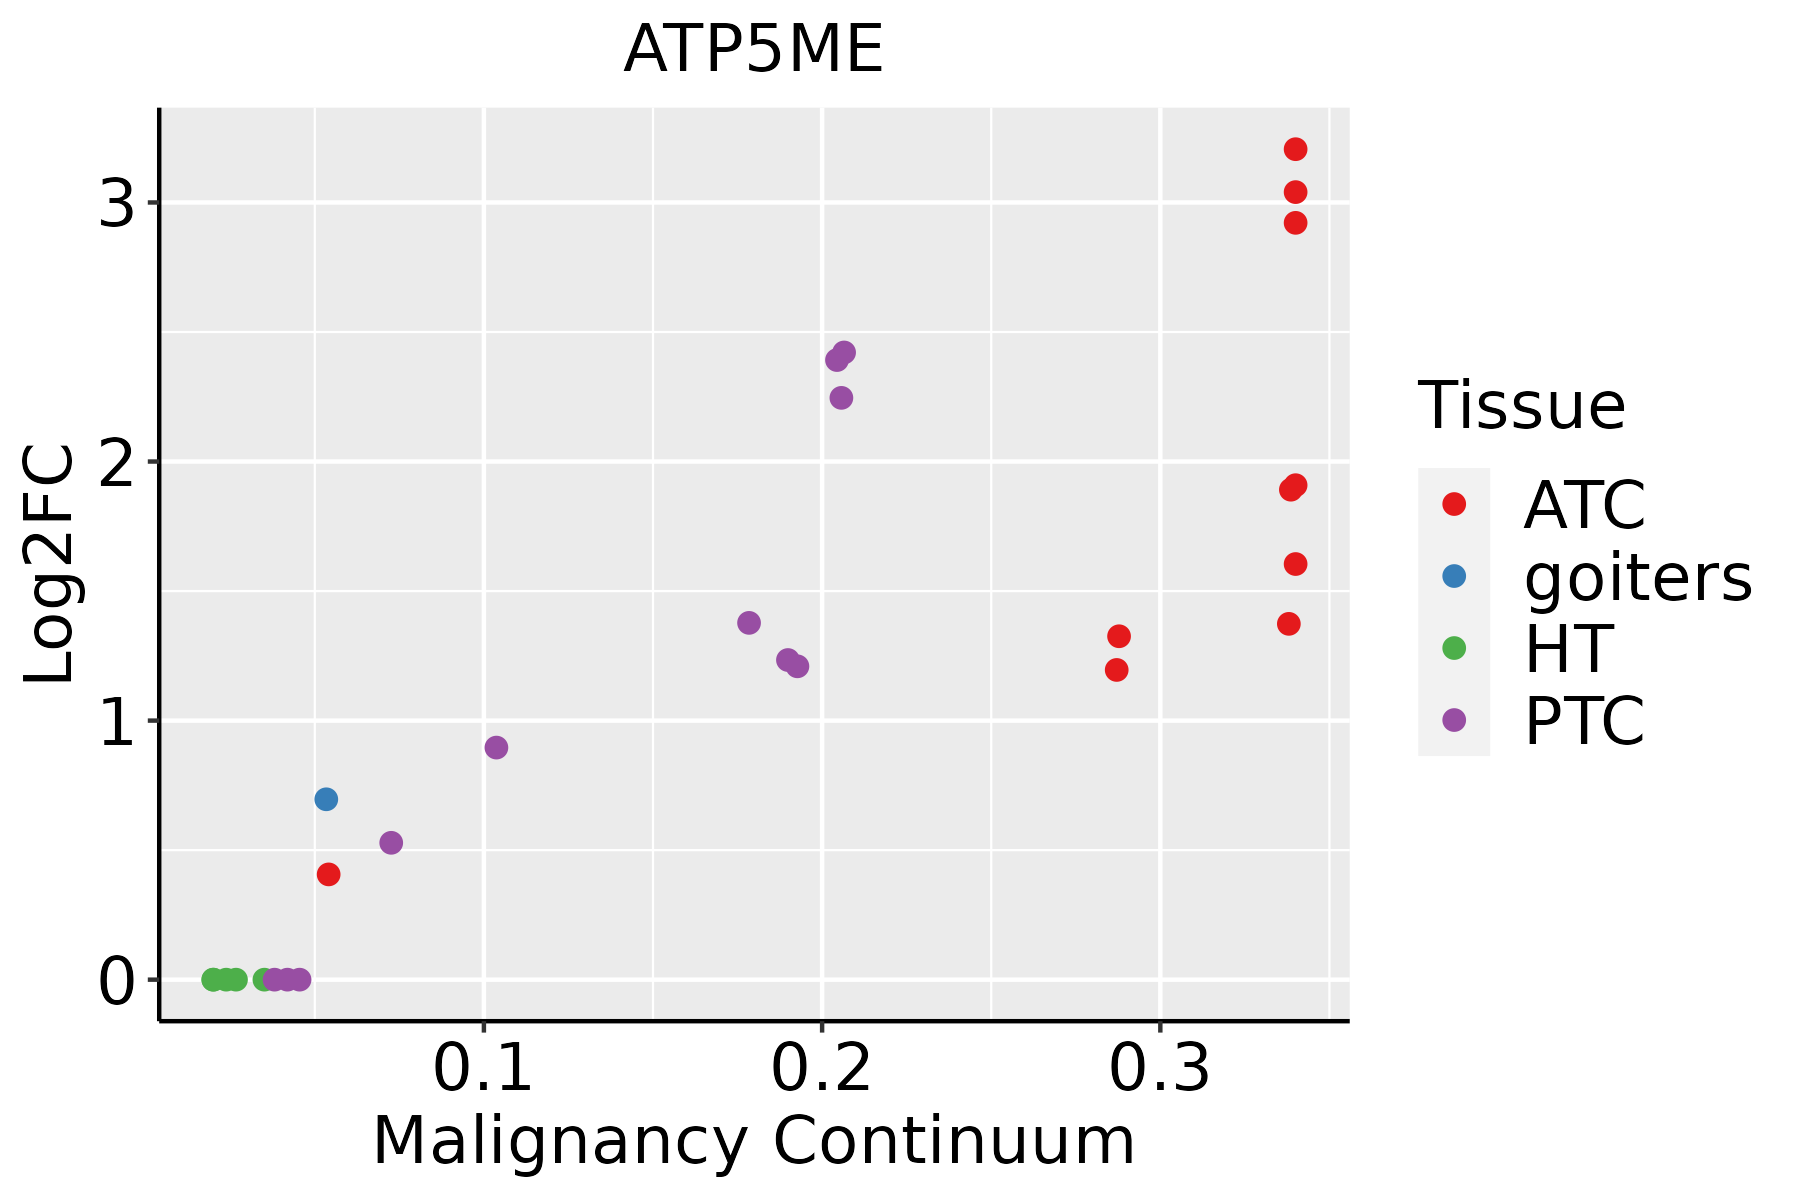 | ATC: Anaplastic thyroid cancer |
| HT: Hashimoto's thyroiditis |
| PTC: Papillary thyroid cancer |
| GO ID | Tissue | Disease Stage | Description | Gene Ratio | Bg Ratio | pvalue | p.adjust | Count |
| GO:00460349 | Breast | Precancer | ATP metabolic process | 82/1080 | 277/18723 | 1.94e-36 | 5.19e-33 | 82 |
| GO:00061199 | Breast | Precancer | oxidative phosphorylation | 53/1080 | 141/18723 | 1.15e-29 | 2.04e-26 | 53 |
| GO:00090608 | Breast | Precancer | aerobic respiration | 58/1080 | 189/18723 | 5.69e-27 | 7.62e-24 | 58 |
| GO:00060918 | Breast | Precancer | generation of precursor metabolites and energy | 94/1080 | 490/18723 | 1.54e-25 | 1.64e-22 | 94 |
| GO:00453338 | Breast | Precancer | cellular respiration | 59/1080 | 230/18723 | 5.97e-23 | 5.32e-20 | 59 |
| GO:00159808 | Breast | Precancer | energy derivation by oxidation of organic compounds | 70/1080 | 318/18723 | 8.33e-23 | 6.37e-20 | 70 |
| GO:19026008 | Breast | Precancer | proton transmembrane transport | 39/1080 | 157/18723 | 4.18e-15 | 1.18e-12 | 39 |
| GO:00159857 | Breast | Precancer | energy coupled proton transport, down electrochemical gradient | 16/1080 | 26/18723 | 4.15e-14 | 9.65e-12 | 16 |
| GO:00159867 | Breast | Precancer | ATP synthesis coupled proton transport | 16/1080 | 26/18723 | 4.15e-14 | 9.65e-12 | 16 |
| GO:00427766 | Breast | Precancer | mitochondrial ATP synthesis coupled proton transport | 13/1080 | 19/18723 | 1.43e-12 | 2.74e-10 | 13 |
| GO:00067547 | Breast | Precancer | ATP biosynthetic process | 21/1080 | 57/18723 | 2.31e-12 | 4.26e-10 | 21 |
| GO:00068398 | Breast | Precancer | mitochondrial transport | 45/1080 | 254/18723 | 1.37e-11 | 1.88e-09 | 45 |
| GO:00092067 | Breast | Precancer | purine ribonucleoside triphosphate biosynthetic process | 22/1080 | 68/18723 | 1.41e-11 | 1.88e-09 | 22 |
| GO:00091457 | Breast | Precancer | purine nucleoside triphosphate biosynthetic process | 22/1080 | 69/18723 | 1.95e-11 | 2.43e-09 | 22 |
| GO:00092017 | Breast | Precancer | ribonucleoside triphosphate biosynthetic process | 22/1080 | 74/18723 | 9.18e-11 | 1.00e-08 | 22 |
| GO:00091448 | Breast | Precancer | purine nucleoside triphosphate metabolic process | 24/1080 | 88/18723 | 9.66e-11 | 1.03e-08 | 24 |
| GO:00092057 | Breast | Precancer | purine ribonucleoside triphosphate metabolic process | 23/1080 | 82/18723 | 1.27e-10 | 1.34e-08 | 23 |
| GO:00091427 | Breast | Precancer | nucleoside triphosphate biosynthetic process | 23/1080 | 85/18723 | 2.82e-10 | 2.69e-08 | 23 |
| GO:00091997 | Breast | Precancer | ribonucleoside triphosphate metabolic process | 23/1080 | 89/18723 | 7.65e-10 | 6.66e-08 | 23 |
| GO:00091418 | Breast | Precancer | nucleoside triphosphate metabolic process | 26/1080 | 112/18723 | 7.72e-10 | 6.66e-08 | 26 |
| Pathway ID | Tissue | Disease Stage | Description | Gene Ratio | Bg Ratio | pvalue | p.adjust | qvalue | Count |
| hsa0019016 | Breast | Precancer | Oxidative phosphorylation | 59/684 | 134/8465 | 6.15e-30 | 3.24e-28 | 2.48e-28 | 59 |
| hsa0471418 | Breast | Precancer | Thermogenesis | 68/684 | 232/8465 | 4.40e-22 | 1.26e-20 | 9.69e-21 | 68 |
| hsa0019017 | Breast | Precancer | Oxidative phosphorylation | 59/684 | 134/8465 | 6.15e-30 | 3.24e-28 | 2.48e-28 | 59 |
| hsa0471419 | Breast | Precancer | Thermogenesis | 68/684 | 232/8465 | 4.40e-22 | 1.26e-20 | 9.69e-21 | 68 |
| hsa0019023 | Breast | IDC | Oxidative phosphorylation | 62/867 | 134/8465 | 4.78e-27 | 2.59e-25 | 1.94e-25 | 62 |
| hsa0471424 | Breast | IDC | Thermogenesis | 75/867 | 232/8465 | 8.41e-21 | 3.04e-19 | 2.27e-19 | 75 |
| hsa0019033 | Breast | IDC | Oxidative phosphorylation | 62/867 | 134/8465 | 4.78e-27 | 2.59e-25 | 1.94e-25 | 62 |
| hsa0471434 | Breast | IDC | Thermogenesis | 75/867 | 232/8465 | 8.41e-21 | 3.04e-19 | 2.27e-19 | 75 |
| hsa0019043 | Breast | DCIS | Oxidative phosphorylation | 61/846 | 134/8465 | 9.84e-27 | 5.30e-25 | 3.90e-25 | 61 |
| hsa0471443 | Breast | DCIS | Thermogenesis | 74/846 | 232/8465 | 8.72e-21 | 3.13e-19 | 2.30e-19 | 74 |
| hsa0019053 | Breast | DCIS | Oxidative phosphorylation | 61/846 | 134/8465 | 9.84e-27 | 5.30e-25 | 3.90e-25 | 61 |
| hsa0471453 | Breast | DCIS | Thermogenesis | 74/846 | 232/8465 | 8.72e-21 | 3.13e-19 | 2.30e-19 | 74 |
| hsa0019018 | Cervix | CC | Oxidative phosphorylation | 64/1267 | 134/8465 | 1.25e-19 | 8.07e-18 | 4.77e-18 | 64 |
| hsa0471420 | Cervix | CC | Thermogenesis | 76/1267 | 232/8465 | 4.29e-12 | 1.16e-10 | 6.85e-11 | 76 |
| hsa0019019 | Cervix | CC | Oxidative phosphorylation | 64/1267 | 134/8465 | 1.25e-19 | 8.07e-18 | 4.77e-18 | 64 |
| hsa04714110 | Cervix | CC | Thermogenesis | 76/1267 | 232/8465 | 4.29e-12 | 1.16e-10 | 6.85e-11 | 76 |
| hsa0019024 | Cervix | HSIL_HPV | Oxidative phosphorylation | 25/459 | 134/8465 | 4.23e-08 | 1.55e-06 | 1.25e-06 | 25 |
| hsa0471425 | Cervix | HSIL_HPV | Thermogenesis | 25/459 | 232/8465 | 7.63e-04 | 5.88e-03 | 4.76e-03 | 25 |
| hsa0019034 | Cervix | HSIL_HPV | Oxidative phosphorylation | 25/459 | 134/8465 | 4.23e-08 | 1.55e-06 | 1.25e-06 | 25 |
| hsa0471435 | Cervix | HSIL_HPV | Thermogenesis | 25/459 | 232/8465 | 7.63e-04 | 5.88e-03 | 4.76e-03 | 25 |


