
|
|||||
|
 | |
| |
| |
| |
| |
| |
|
Gene: ATP5L |
Gene summary for ATP5L |
| Gene information | Species | Human | Gene symbol | ATP5L | Gene ID | 10632 |
| Gene name | ATP synthase membrane subunit g | |
| Gene Alias | ATP5JG | |
| Cytomap | 11q23.3 | |
| Gene Type | protein-coding | GO ID | GO:0006091 | UniProtAcc | O75964 |
Top |
Malignant transformation analysis |
| Identification of the aberrant gene expression in precancerous and cancerous lesions by comparing the gene expression of stem-like cells in diseased tissues with normal stem cells |
| Entrez ID | Symbol | Replicates | Species | Organ | Tissue | Adj P-value | Log2FC | Malignancy |
| 10632 | ATP5L | GSM4909280 | Human | Breast | Precancer | 1.16e-04 | -6.32e-01 | 0.0305 |
| 10632 | ATP5L | GSM4909281 | Human | Breast | IDC | 2.97e-30 | -6.32e-01 | 0.21 |
| 10632 | ATP5L | GSM4909282 | Human | Breast | IDC | 1.19e-30 | -6.32e-01 | -0.0288 |
| 10632 | ATP5L | GSM4909285 | Human | Breast | IDC | 2.97e-30 | -6.32e-01 | 0.21 |
| 10632 | ATP5L | GSM4909286 | Human | Breast | IDC | 7.38e-30 | -6.32e-01 | 0.1081 |
| 10632 | ATP5L | GSM4909287 | Human | Breast | IDC | 5.66e-33 | -6.32e-01 | 0.2057 |
| 10632 | ATP5L | GSM4909288 | Human | Breast | IDC | 4.94e-09 | -6.32e-01 | 0.0988 |
| 10632 | ATP5L | GSM4909289 | Human | Breast | IDC | 9.58e-07 | -6.32e-01 | 0.1064 |
| 10632 | ATP5L | GSM4909290 | Human | Breast | IDC | 3.56e-24 | -6.32e-01 | 0.2096 |
| 10632 | ATP5L | GSM4909291 | Human | Breast | IDC | 6.16e-20 | -6.32e-01 | 0.1753 |
| 10632 | ATP5L | GSM4909292 | Human | Breast | IDC | 1.71e-03 | -6.32e-01 | 0.1236 |
| 10632 | ATP5L | GSM4909293 | Human | Breast | IDC | 1.83e-29 | -6.32e-01 | 0.1581 |
| 10632 | ATP5L | GSM4909294 | Human | Breast | IDC | 1.19e-30 | -6.32e-01 | 0.2022 |
| 10632 | ATP5L | GSM4909295 | Human | Breast | IDC | 4.90e-16 | -6.32e-01 | 0.0898 |
| 10632 | ATP5L | GSM4909296 | Human | Breast | IDC | 2.97e-30 | -6.32e-01 | 0.1524 |
| 10632 | ATP5L | GSM4909297 | Human | Breast | IDC | 7.58e-32 | -6.32e-01 | 0.1517 |
| 10632 | ATP5L | GSM4909298 | Human | Breast | IDC | 2.97e-30 | -6.32e-01 | 0.1551 |
| 10632 | ATP5L | GSM4909299 | Human | Breast | IDC | 7.38e-30 | -6.32e-01 | 0.035 |
| 10632 | ATP5L | GSM4909300 | Human | Breast | IDC | 2.37e-14 | -6.32e-01 | 0.0334 |
| 10632 | ATP5L | GSM4909301 | Human | Breast | IDC | 1.19e-30 | -6.32e-01 | 0.1577 |
| Page: 1 2 3 4 5 6 7 8 9 10 11 12 13 14 15 16 |
| Tissue | Expression Dynamics | Abbreviation |
| Breast |  | IDC: Invasive ductal carcinoma |
| DCIS: Ductal carcinoma in situ | ||
| Precancer(BRCA1-mut): Precancerous lesion from BRCA1 mutation carriers | ||
| Colorectum (GSE201348) |  | FAP: Familial adenomatous polyposis |
| CRC: Colorectal cancer | ||
| Colorectum (HTA11) |  | AD: Adenomas |
| SER: Sessile serrated lesions | ||
| MSI-H: Microsatellite-high colorectal cancer | ||
| MSS: Microsatellite stable colorectal cancer | ||
| Endometrium | 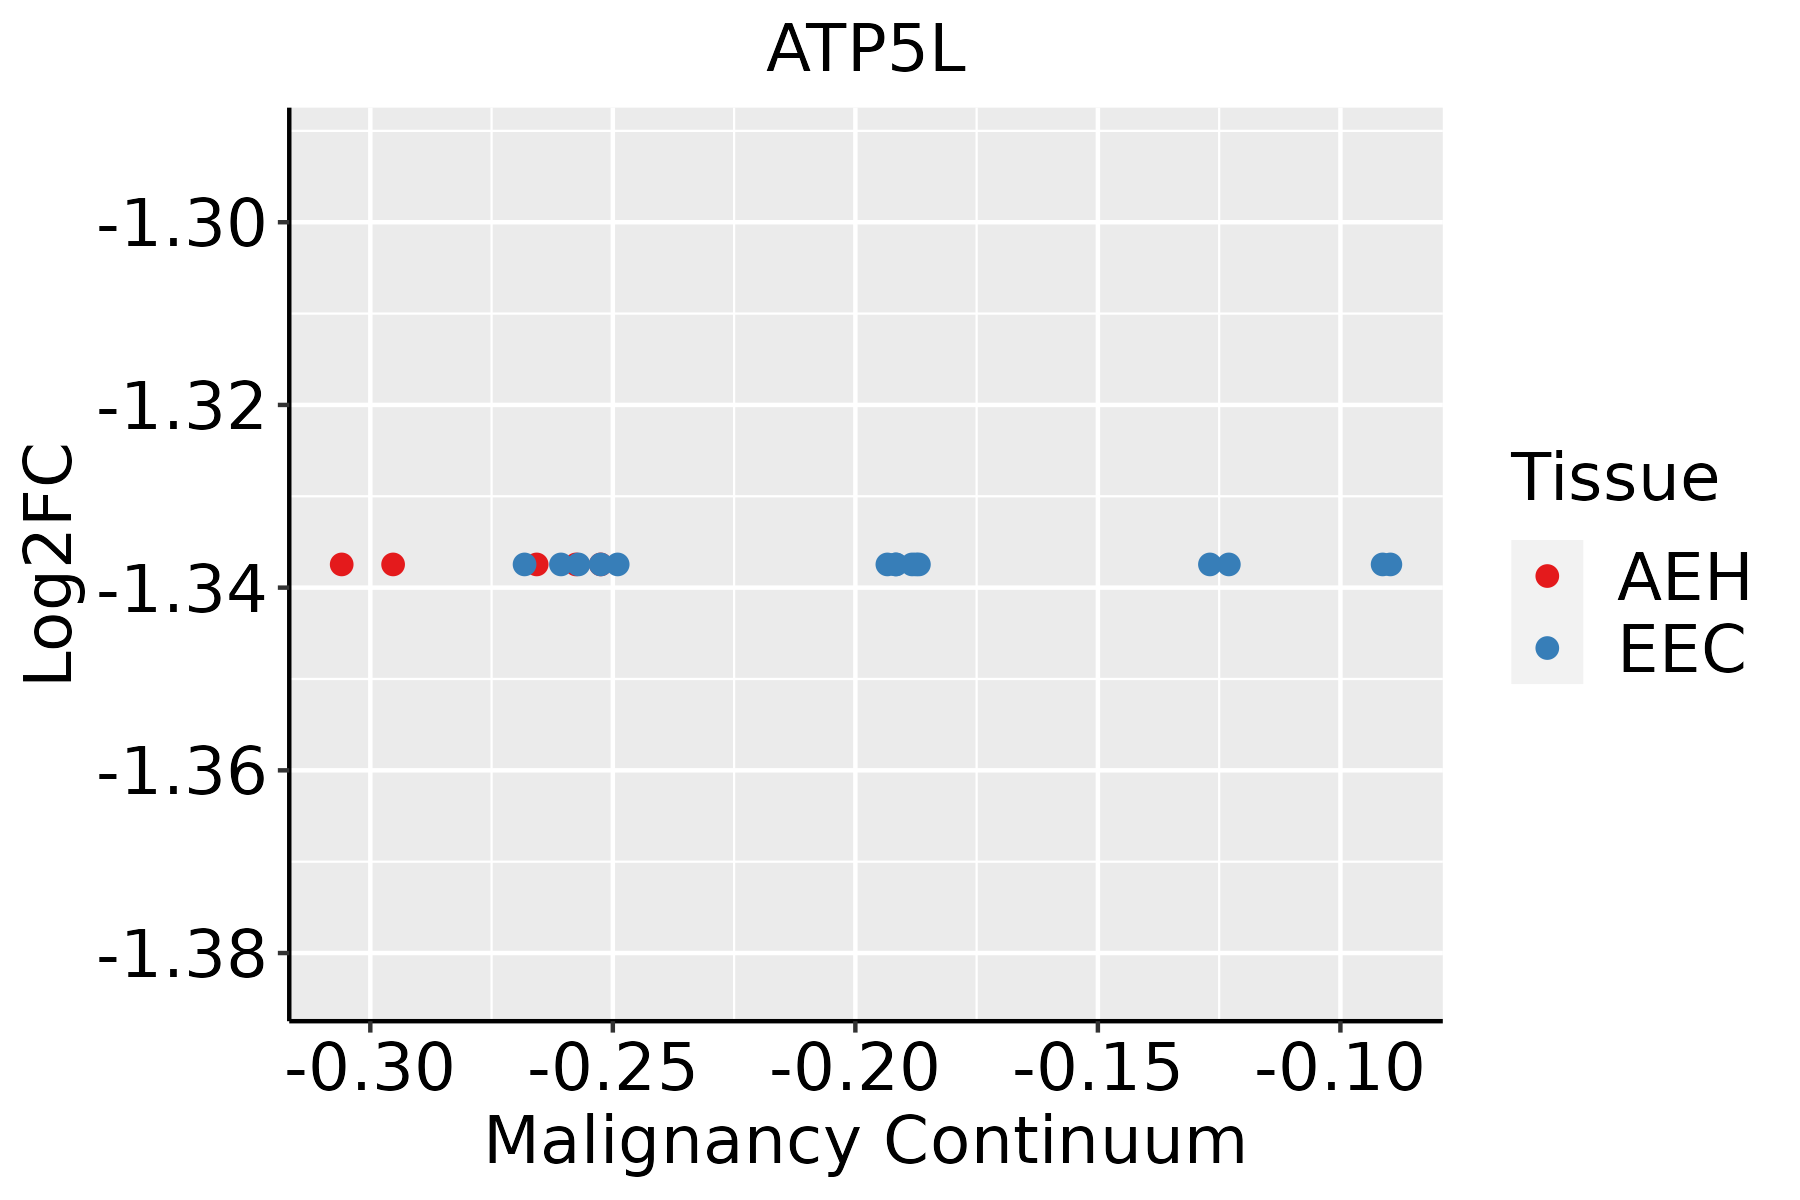 | AEH: Atypical endometrial hyperplasia |
| EEC: Endometrioid Cancer | ||
| Esophagus |  | ESCC: Esophageal squamous cell carcinoma |
| HGIN: High-grade intraepithelial neoplasias | ||
| LGIN: Low-grade intraepithelial neoplasias | ||
| GC |  | CAG: Chronic atrophic gastritis |
| CAG with IM: Chronic atrophic gastritis with intestinal metaplasia | ||
| CSG: Chronic superficial gastritis | ||
| GC: Gastric cancer | ||
| SIM: Severe intestinal metaplasia | ||
| WIM: Wild intestinal metaplasia | ||
| Liver |  | HCC: Hepatocellular carcinoma |
| NAFLD: Non-alcoholic fatty liver disease | ||
| Lung | 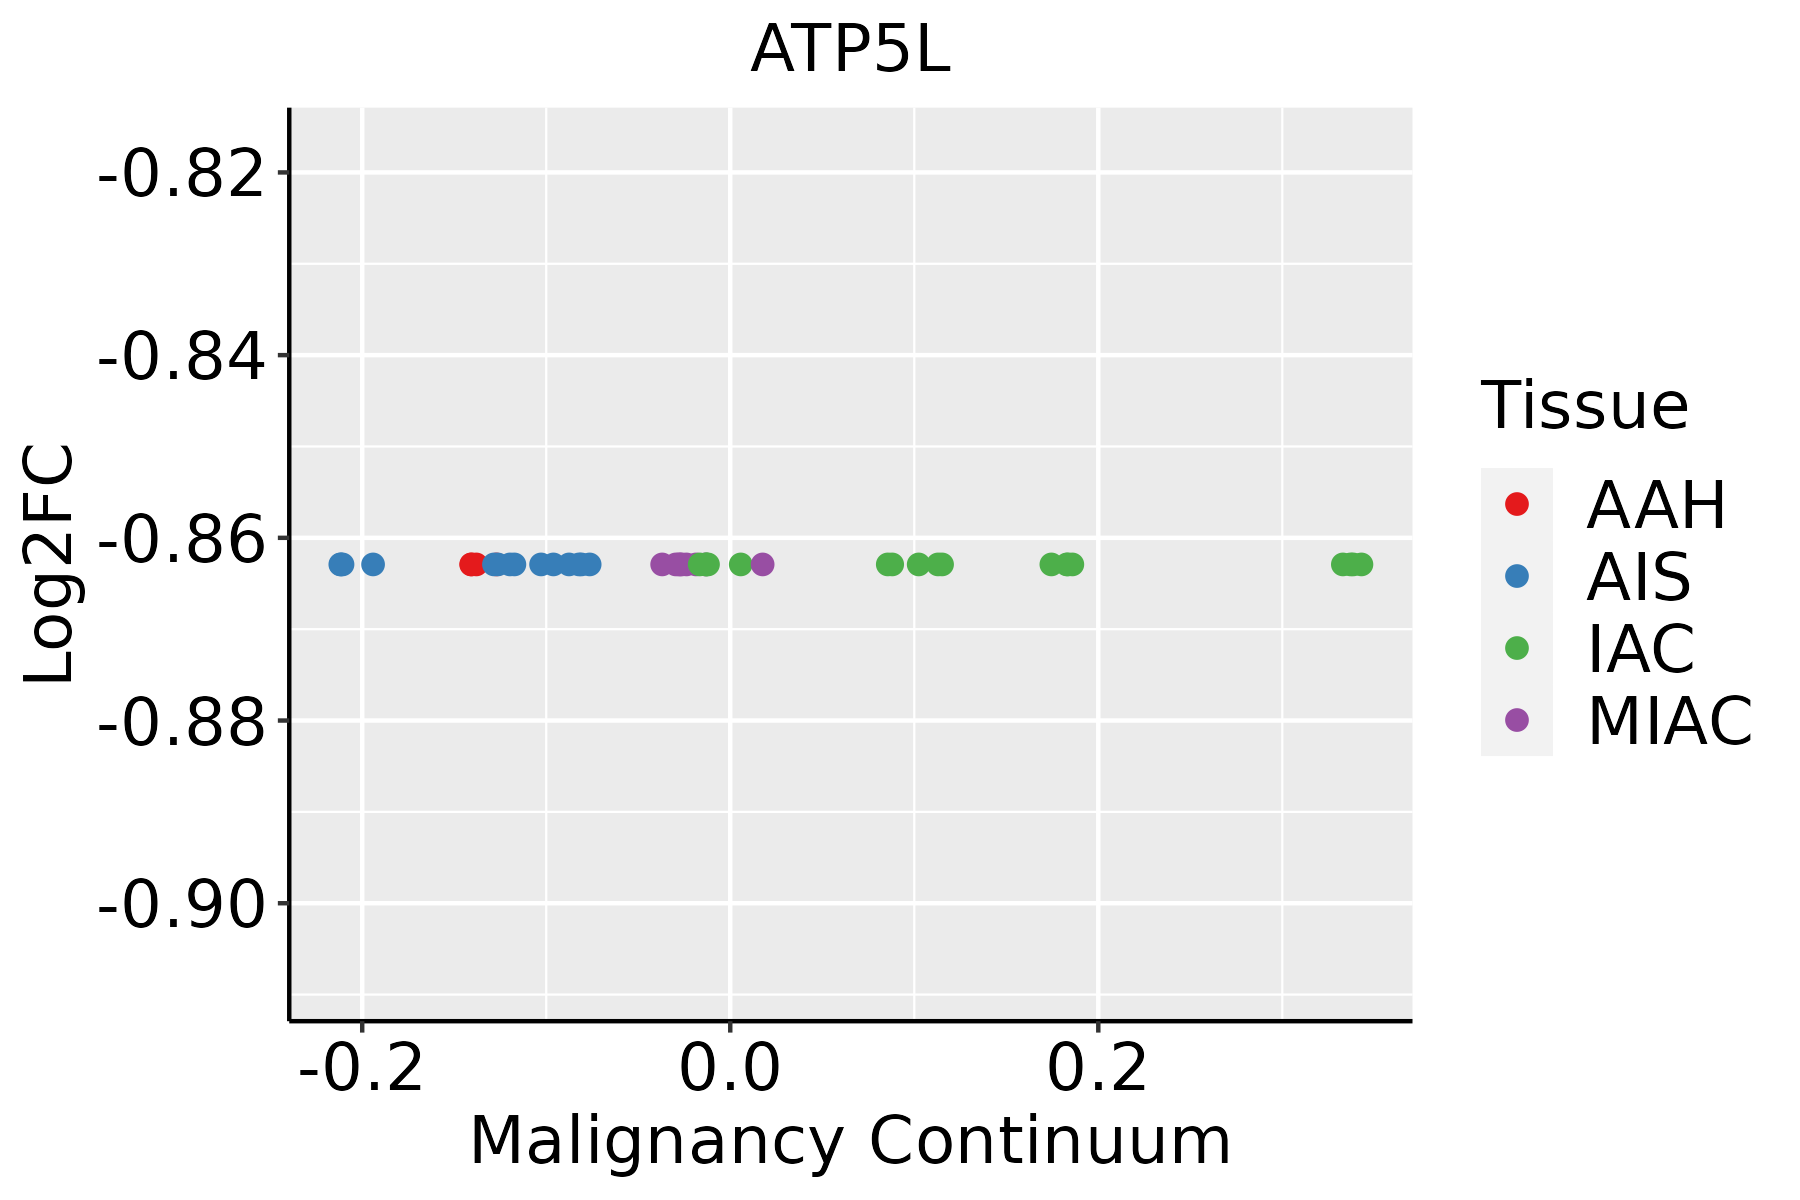 | AAH: Atypical adenomatous hyperplasia |
| AIS: Adenocarcinoma in situ | ||
| IAC: Invasive lung adenocarcinoma | ||
| MIA: Minimally invasive adenocarcinoma | ||
| Oral Cavity | 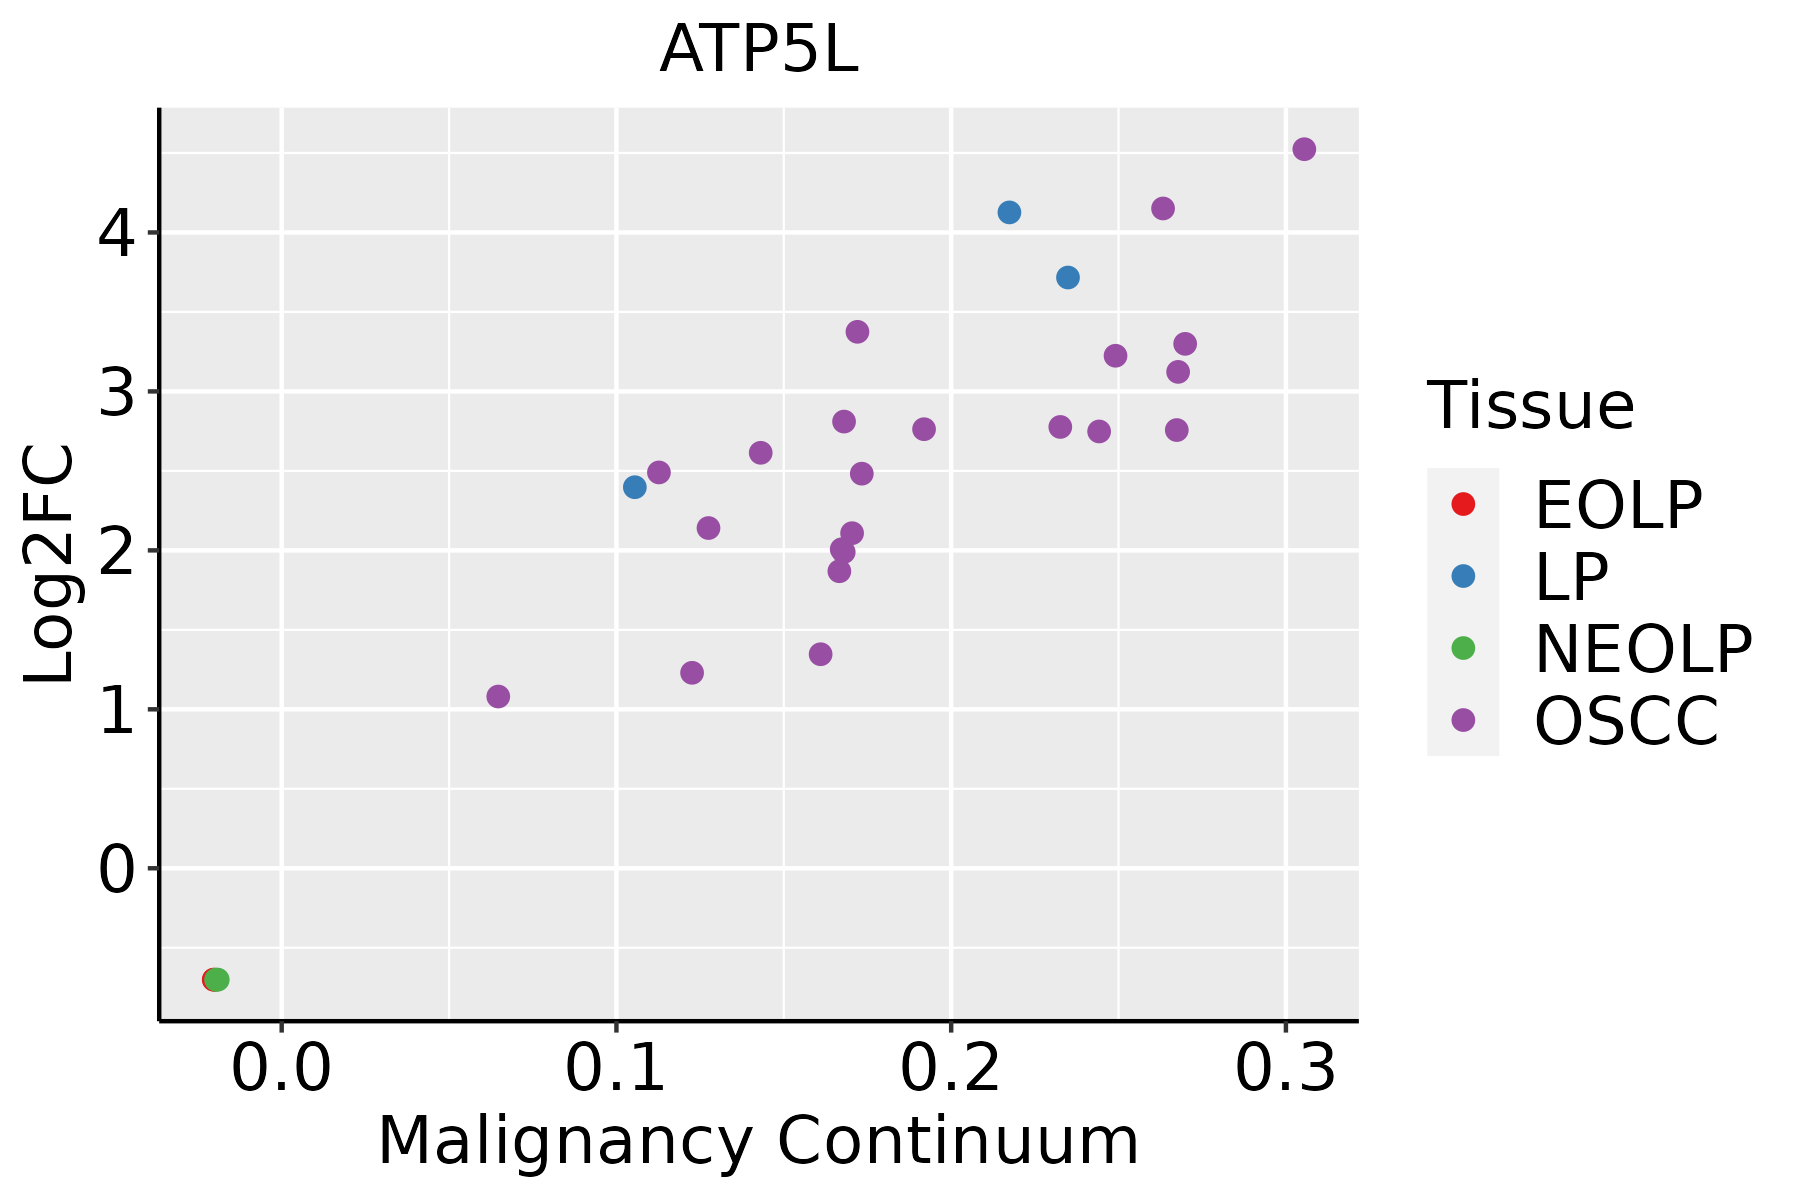 | EOLP: Erosive Oral lichen planus |
| LP: leukoplakia | ||
| NEOLP: Non-erosive oral lichen planus | ||
| OSCC: Oral squamous cell carcinoma | ||
| Prostate | 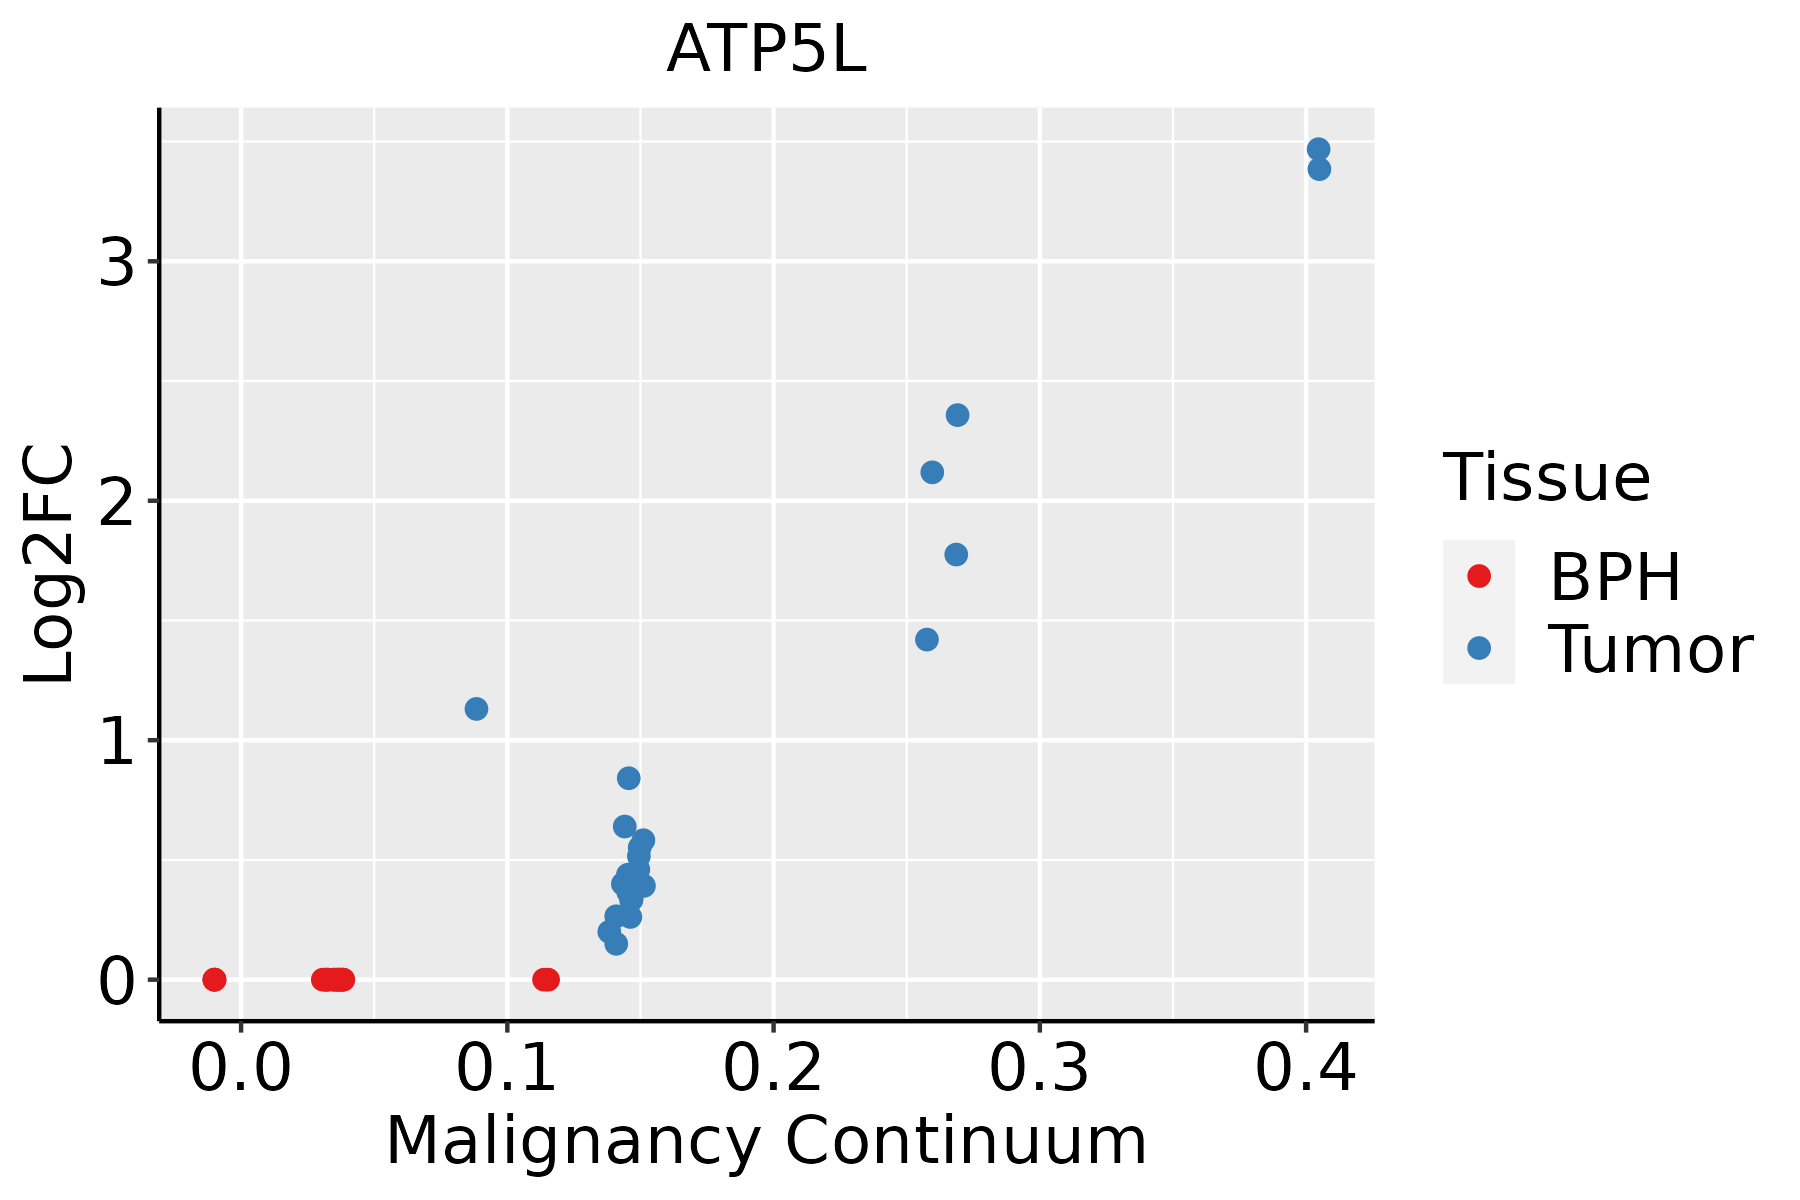 | BPH: Benign Prostatic Hyperplasia |
| Skin | 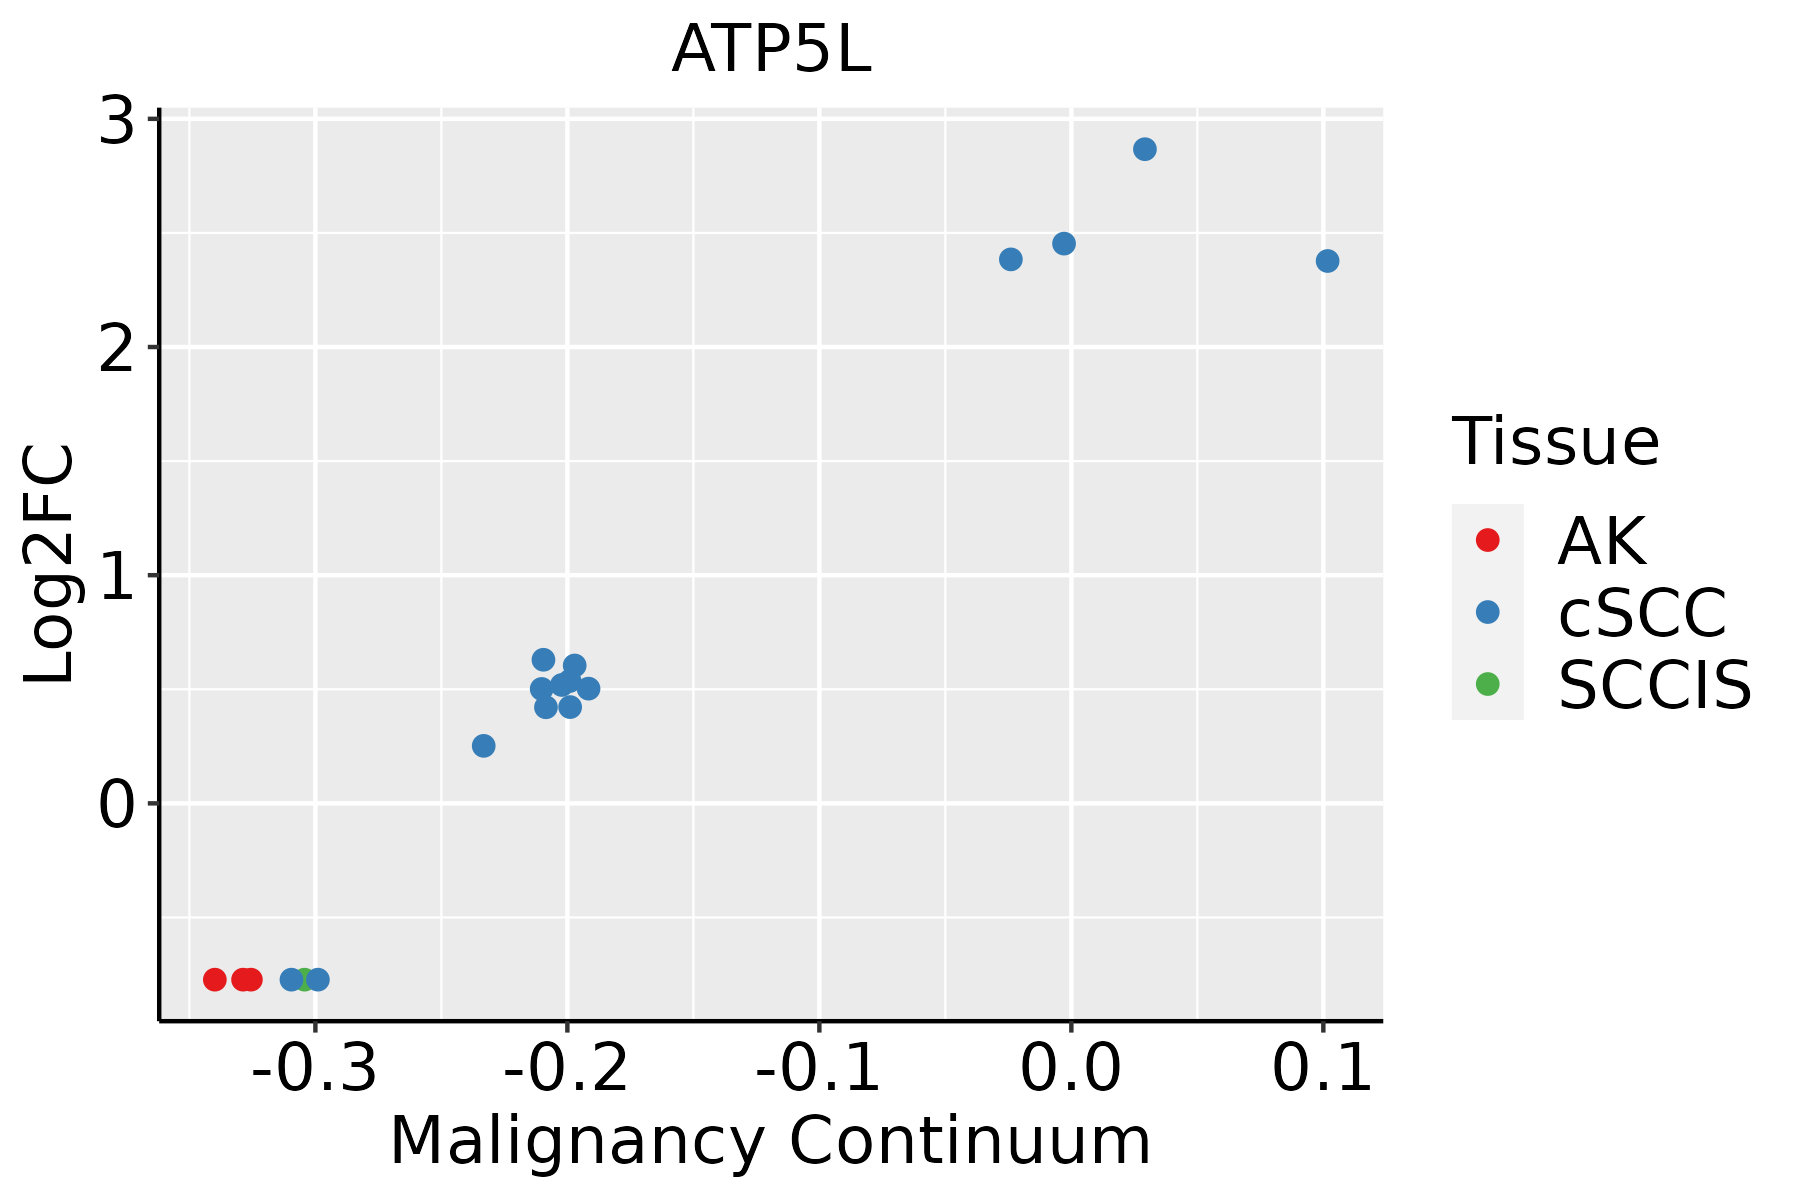 | AK: Actinic keratosis |
| cSCC: Cutaneous squamous cell carcinoma | ||
| SCCIS:squamous cell carcinoma in situ | ||
| Thyroid |  | ATC: Anaplastic thyroid cancer |
| HT: Hashimoto's thyroiditis | ||
| PTC: Papillary thyroid cancer |
| ∗log2FC in expression of this searched gene in stem-like cells from each diseased tissue sample relative to stem-like cells in normal samples in each tissue plotted against the malignancy continuum. Samples are colored based on if they are from different disease stage. |
Top |
Malignant transformation related pathway analysis |
| Find out the enriched GO biological processes and KEGG pathways involved in transition from healthy to precancer to cancer |
| Tissue | Disease Stage | Enriched GO biological Processes |
| Colorectum | AD |  |
| Colorectum | SER |  |
| Colorectum | MSS |  |
| Colorectum | MSI-H |  |
| Colorectum | FAP |  |
| ∗Top 15 enriched GO BP terms are showed in the bar plot of each disease state in each tissue. Each row represents a significant GO biological process which is colored according to the -log10(p.adjust). |
| Page: 1 2 3 4 5 6 7 8 9 |
| GO ID | Tissue | Disease Stage | Description | Gene Ratio | Bg Ratio | pvalue | p.adjust | Count |
| Page: 1 |
| Pathway ID | Tissue | Disease Stage | Description | Gene Ratio | Bg Ratio | pvalue | p.adjust | qvalue | Count |
| hsa0019016 | Breast | Precancer | Oxidative phosphorylation | 59/684 | 134/8465 | 6.15e-30 | 3.24e-28 | 2.48e-28 | 59 |
| hsa0471418 | Breast | Precancer | Thermogenesis | 68/684 | 232/8465 | 4.40e-22 | 1.26e-20 | 9.69e-21 | 68 |
| hsa0019017 | Breast | Precancer | Oxidative phosphorylation | 59/684 | 134/8465 | 6.15e-30 | 3.24e-28 | 2.48e-28 | 59 |
| hsa0471419 | Breast | Precancer | Thermogenesis | 68/684 | 232/8465 | 4.40e-22 | 1.26e-20 | 9.69e-21 | 68 |
| hsa0019023 | Breast | IDC | Oxidative phosphorylation | 62/867 | 134/8465 | 4.78e-27 | 2.59e-25 | 1.94e-25 | 62 |
| hsa0471424 | Breast | IDC | Thermogenesis | 75/867 | 232/8465 | 8.41e-21 | 3.04e-19 | 2.27e-19 | 75 |
| hsa0019033 | Breast | IDC | Oxidative phosphorylation | 62/867 | 134/8465 | 4.78e-27 | 2.59e-25 | 1.94e-25 | 62 |
| hsa0471434 | Breast | IDC | Thermogenesis | 75/867 | 232/8465 | 8.41e-21 | 3.04e-19 | 2.27e-19 | 75 |
| hsa0019043 | Breast | DCIS | Oxidative phosphorylation | 61/846 | 134/8465 | 9.84e-27 | 5.30e-25 | 3.90e-25 | 61 |
| hsa0471443 | Breast | DCIS | Thermogenesis | 74/846 | 232/8465 | 8.72e-21 | 3.13e-19 | 2.30e-19 | 74 |
| hsa0019053 | Breast | DCIS | Oxidative phosphorylation | 61/846 | 134/8465 | 9.84e-27 | 5.30e-25 | 3.90e-25 | 61 |
| hsa0471453 | Breast | DCIS | Thermogenesis | 74/846 | 232/8465 | 8.72e-21 | 3.13e-19 | 2.30e-19 | 74 |
| hsa0019018 | Cervix | CC | Oxidative phosphorylation | 64/1267 | 134/8465 | 1.25e-19 | 8.07e-18 | 4.77e-18 | 64 |
| hsa0471420 | Cervix | CC | Thermogenesis | 76/1267 | 232/8465 | 4.29e-12 | 1.16e-10 | 6.85e-11 | 76 |
| hsa0019019 | Cervix | CC | Oxidative phosphorylation | 64/1267 | 134/8465 | 1.25e-19 | 8.07e-18 | 4.77e-18 | 64 |
| hsa04714110 | Cervix | CC | Thermogenesis | 76/1267 | 232/8465 | 4.29e-12 | 1.16e-10 | 6.85e-11 | 76 |
| hsa0019024 | Cervix | HSIL_HPV | Oxidative phosphorylation | 25/459 | 134/8465 | 4.23e-08 | 1.55e-06 | 1.25e-06 | 25 |
| hsa0471425 | Cervix | HSIL_HPV | Thermogenesis | 25/459 | 232/8465 | 7.63e-04 | 5.88e-03 | 4.76e-03 | 25 |
| hsa0019034 | Cervix | HSIL_HPV | Oxidative phosphorylation | 25/459 | 134/8465 | 4.23e-08 | 1.55e-06 | 1.25e-06 | 25 |
| hsa0471435 | Cervix | HSIL_HPV | Thermogenesis | 25/459 | 232/8465 | 7.63e-04 | 5.88e-03 | 4.76e-03 | 25 |
| Page: 1 2 3 4 |
Top |
Cell-cell communication analysis |
| Identification of potential cell-cell interactions between two cell types and their ligand-receptor pairs for different disease states |
| Ligand | Receptor | LRpair | Pathway | Tissue | Disease Stage |
| Page: 1 |
Top |
Single-cell gene regulatory network inference analysis |
| Find out the significant the regulons (TFs) and the target genes of each regulon across cell types for different disease states |
| TF | Cell Type | Tissue | Disease Stage | Target Gene | RSS | Regulon Activity |
| ∗The dot plots of a searched regulon are shown for all cell subpopulations in each disease state of each tissue based on the regulon specific score inferred using pySCENIC and by calculating the average expression. |
| Page: 1 |
Top |
Somatic mutation of malignant transformation related genes |
| Annotation of somatic variants for genes involved in malignant transformation |
| Hugo Symbol | Variant Class | Variant Classification | dbSNP RS | HGVSc | HGVSp | HGVSp Short | SWISSPROT | BIOTYPE | SIFT | PolyPhen | Tumor Sample Barcode | Tissue | Histology | Sex | Age | Stage | Therapy Types | Drugs | Outcome |
| ATP5L | insertion | Frame_Shift_Ins | novel | c.19_20insTGTTTACTAACATACTCATTCTTCACAAAATTCTG | p.Asn7MetfsTer22 | p.N7Mfs*22 | O75964 | protein_coding | TCGA-AN-A0FS-01 | Breast | breast invasive carcinoma | Female | <65 | I/II | Unknown | Unknown | SD | ||
| ATP5L | SNV | Missense_Mutation | novel | c.109G>A | p.Glu37Lys | p.E37K | O75964 | protein_coding | deleterious(0.04) | benign(0.314) | TCGA-EA-A3HS-01 | Cervix | cervical & endocervical cancer | Female | <65 | I/II | Unknown | Unknown | SD |
| ATP5L | SNV | Missense_Mutation | c.287G>T | p.Arg96Leu | p.R96L | O75964 | protein_coding | tolerated(0.33) | possibly_damaging(0.5) | TCGA-EX-A1H5-01 | Cervix | cervical & endocervical cancer | Female | <65 | I/II | Unknown | Unknown | SD | |
| ATP5L | SNV | Missense_Mutation | c.253A>T | p.Met85Leu | p.M85L | O75964 | protein_coding | tolerated(0.31) | benign(0.2) | TCGA-AG-3881-01 | Colorectum | rectum adenocarcinoma | Female | >=65 | I/II | Unknown | Unknown | SD | |
| ATP5L | SNV | Missense_Mutation | c.68N>T | p.Ser23Leu | p.S23L | O75964 | protein_coding | tolerated(0.26) | benign(0.03) | TCGA-AG-A002-01 | Colorectum | rectum adenocarcinoma | Male | <65 | I/II | Unknown | Unknown | SD | |
| ATP5L | SNV | Missense_Mutation | novel | c.299N>A | p.Gly100Asp | p.G100D | O75964 | protein_coding | deleterious(0.02) | benign(0.434) | TCGA-AX-A1CE-01 | Endometrium | uterine corpus endometrioid carcinoma | Female | <65 | I/II | Unspecific | Paclitaxel | SD |
| ATP5L | SNV | Missense_Mutation | c.131C>T | p.Ala44Val | p.A44V | O75964 | protein_coding | deleterious(0.03) | benign(0.367) | TCGA-DI-A0WH-01 | Endometrium | uterine corpus endometrioid carcinoma | Female | <65 | I/II | Unknown | Unknown | SD | |
| ATP5L | SNV | Missense_Mutation | novel | c.16N>T | p.Arg6Cys | p.R6C | O75964 | protein_coding | tolerated(0.22) | benign(0) | TCGA-EO-A22R-01 | Endometrium | uterine corpus endometrioid carcinoma | Female | <65 | I/II | Unknown | Unknown | SD |
| ATP5L | SNV | Missense_Mutation | c.104A>C | p.Lys35Thr | p.K35T | O75964 | protein_coding | deleterious(0.02) | benign(0.119) | TCGA-MI-A75C-01 | Liver | liver hepatocellular carcinoma | Male | <65 | I/II | Unknown | Unknown | SD | |
| ATP5L | SNV | Missense_Mutation | c.252N>T | p.Leu84Phe | p.L84F | O75964 | protein_coding | tolerated(0.26) | benign(0.367) | TCGA-05-4389-01 | Lung | lung adenocarcinoma | Male | >=65 | I/II | Unknown | Unknown | SD |
| Page: 1 2 |
Top |
Related drugs of malignant transformation related genes |
| Identification of chemicals and drugs interact with genes involved in malignant transfromation |
| (DGIdb 4.0) |
| Entrez ID | Symbol | Category | Interaction Types | Drug Claim Name | Drug Name | PMIDs |
| Page: 1 |

Copyright 2023-Present -The University of Texas Health Science Center at Houston |