
|
|||||
|
 | |
| |
| |
| |
| |
| |
|
Gene: ATP5EP2 |
Gene summary for ATP5EP2 |
| Gene information | Species | Human | Gene symbol | ATP5EP2 | Gene ID | 432369 |
| Gene name | ATP synthase F1 subunit epsilon pseudogene 2 | |
| Gene Alias | ATP5EP2 | |
| Cytomap | 13q12.2 | |
| Gene Type | pseudo | GO ID | GO:0006091 | UniProtAcc | NA |
Top |
Malignant transformation analysis |
| Identification of the aberrant gene expression in precancerous and cancerous lesions by comparing the gene expression of stem-like cells in diseased tissues with normal stem cells |
| Entrez ID | Symbol | Replicates | Species | Organ | Tissue | Adj P-value | Log2FC | Malignancy |
| 432369 | ATP5EP2 | HTA11_99999970781_79442 | Human | Colorectum | MSS | 6.56e-26 | 4.52e-01 | 0.294 |
| 432369 | ATP5EP2 | HTA11_99999965062_69753 | Human | Colorectum | MSI-H | 1.91e-08 | 9.63e-01 | 0.3487 |
| 432369 | ATP5EP2 | HTA11_99999965104_69814 | Human | Colorectum | MSS | 3.79e-24 | 6.23e-01 | 0.281 |
| 432369 | ATP5EP2 | HTA11_99999971662_82457 | Human | Colorectum | MSS | 8.81e-87 | 1.80e+00 | 0.3859 |
| 432369 | ATP5EP2 | HTA11_99999973899_84307 | Human | Colorectum | MSS | 2.05e-26 | 8.17e-01 | 0.2585 |
| 432369 | ATP5EP2 | HTA11_99999974143_84620 | Human | Colorectum | MSS | 4.47e-59 | 1.06e+00 | 0.3005 |
| 432369 | ATP5EP2 | S43 | Human | Liver | Cirrhotic | 2.32e-08 | -2.92e-01 | -0.0187 |
| 432369 | ATP5EP2 | HCC1_Meng | Human | Liver | HCC | 1.24e-10 | -2.83e-01 | 0.0246 |
| 432369 | ATP5EP2 | HCC2_Meng | Human | Liver | HCC | 1.08e-05 | -2.83e-01 | 0.0107 |
| 432369 | ATP5EP2 | cirrhotic1 | Human | Liver | Cirrhotic | 1.49e-04 | -4.83e-02 | 0.0202 |
| 432369 | ATP5EP2 | cirrhotic2 | Human | Liver | Cirrhotic | 4.92e-03 | 4.73e-02 | 0.0201 |
| 432369 | ATP5EP2 | cirrhotic3 | Human | Liver | Cirrhotic | 4.79e-26 | 4.31e-01 | 0.0215 |
| 432369 | ATP5EP2 | HCC1 | Human | Liver | HCC | 1.09e-16 | 1.74e+00 | 0.5336 |
| 432369 | ATP5EP2 | HCC2 | Human | Liver | HCC | 5.24e-20 | 1.62e+00 | 0.5341 |
| 432369 | ATP5EP2 | Pt13.a | Human | Liver | HCC | 6.22e-04 | -2.76e-01 | 0.021 |
| 432369 | ATP5EP2 | Pt13.b | Human | Liver | HCC | 1.21e-02 | -2.47e-01 | 0.0251 |
| 432369 | ATP5EP2 | S014 | Human | Liver | HCC | 2.54e-04 | -2.92e-01 | 0.2254 |
| 432369 | ATP5EP2 | S015 | Human | Liver | HCC | 2.31e-02 | -2.92e-01 | 0.2375 |
| 432369 | ATP5EP2 | S016 | Human | Liver | HCC | 5.45e-06 | -2.92e-01 | 0.2243 |
| 432369 | ATP5EP2 | S028 | Human | Liver | HCC | 6.26e-03 | -2.92e-01 | 0.2503 |
| Page: 1 2 |
| Tissue | Expression Dynamics | Abbreviation |
| Colorectum (GSE201348) |  | FAP: Familial adenomatous polyposis |
| CRC: Colorectal cancer | ||
| Colorectum (HTA11) |  | AD: Adenomas |
| SER: Sessile serrated lesions | ||
| MSI-H: Microsatellite-high colorectal cancer | ||
| MSS: Microsatellite stable colorectal cancer | ||
| Liver | 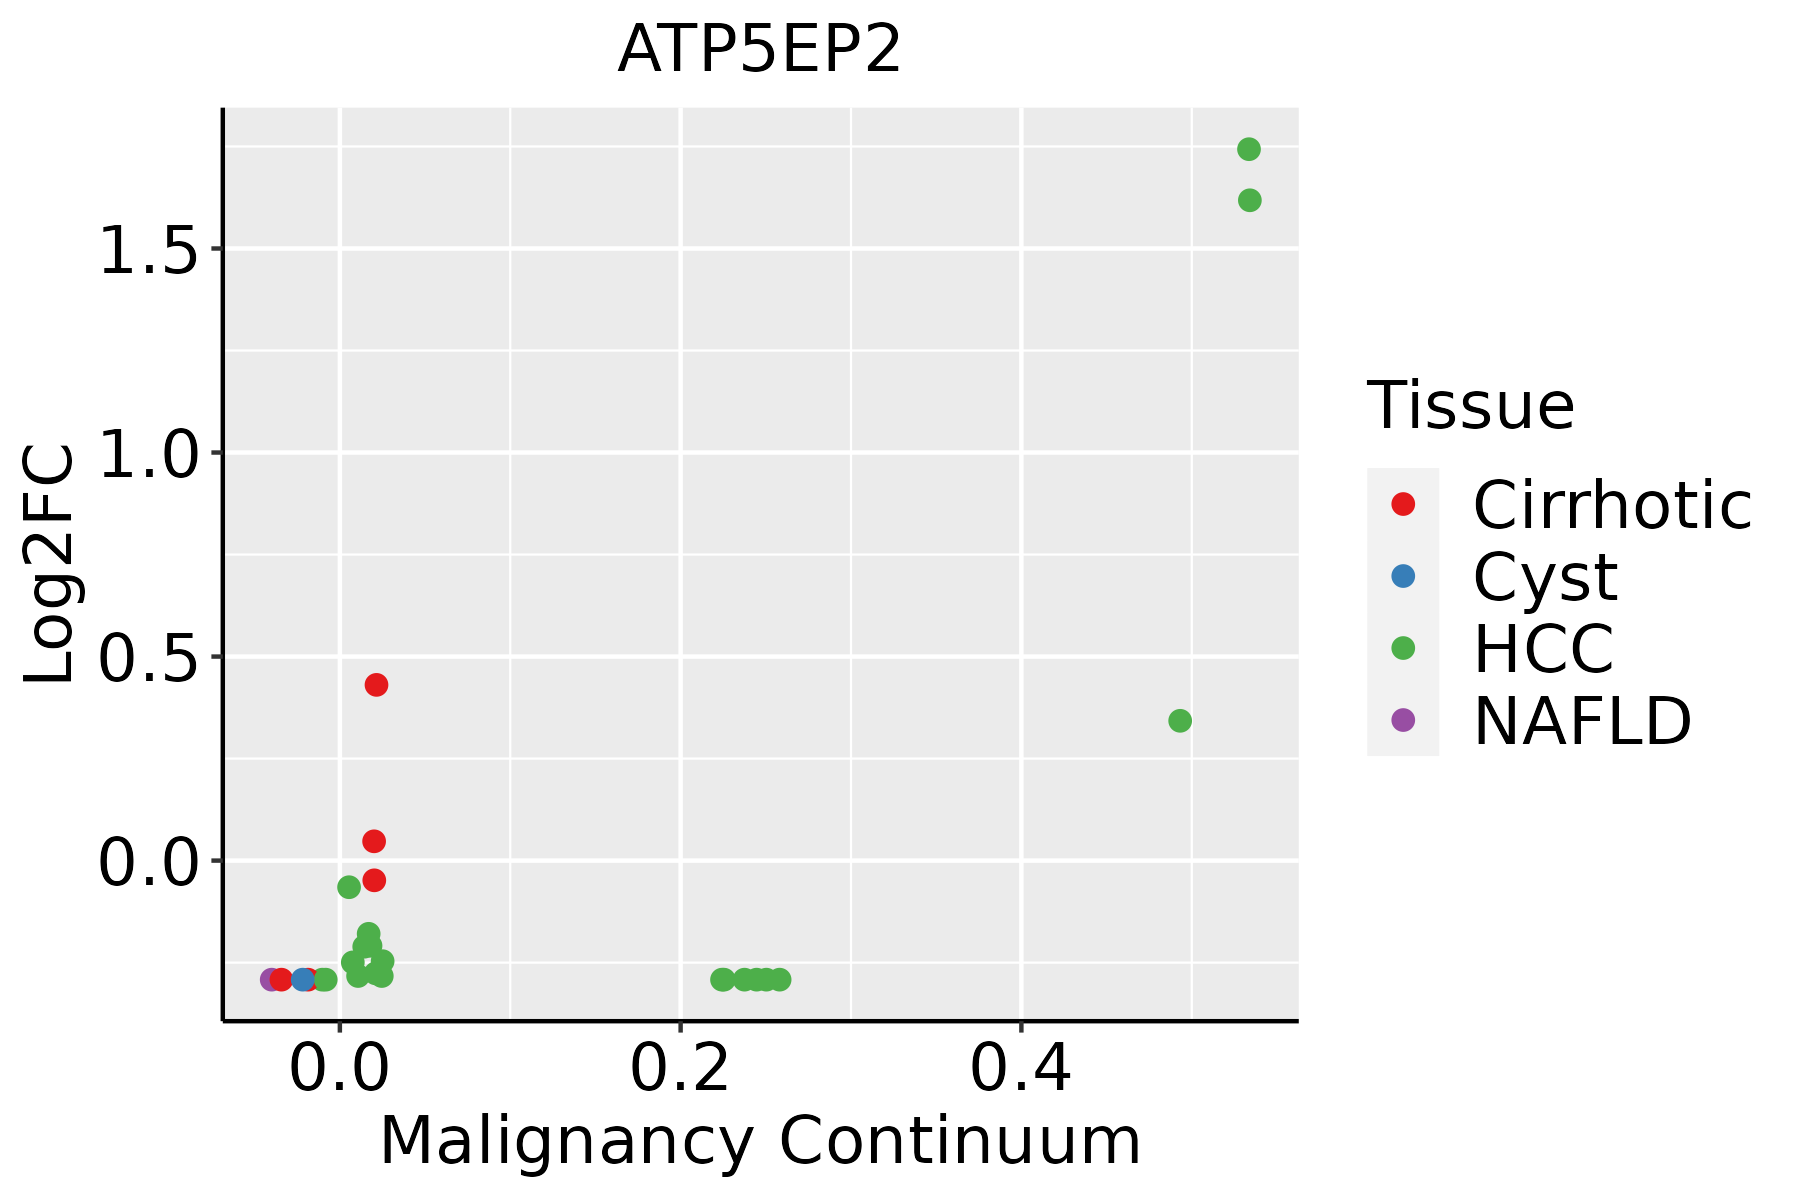 | HCC: Hepatocellular carcinoma |
| NAFLD: Non-alcoholic fatty liver disease | ||
| Oral Cavity | 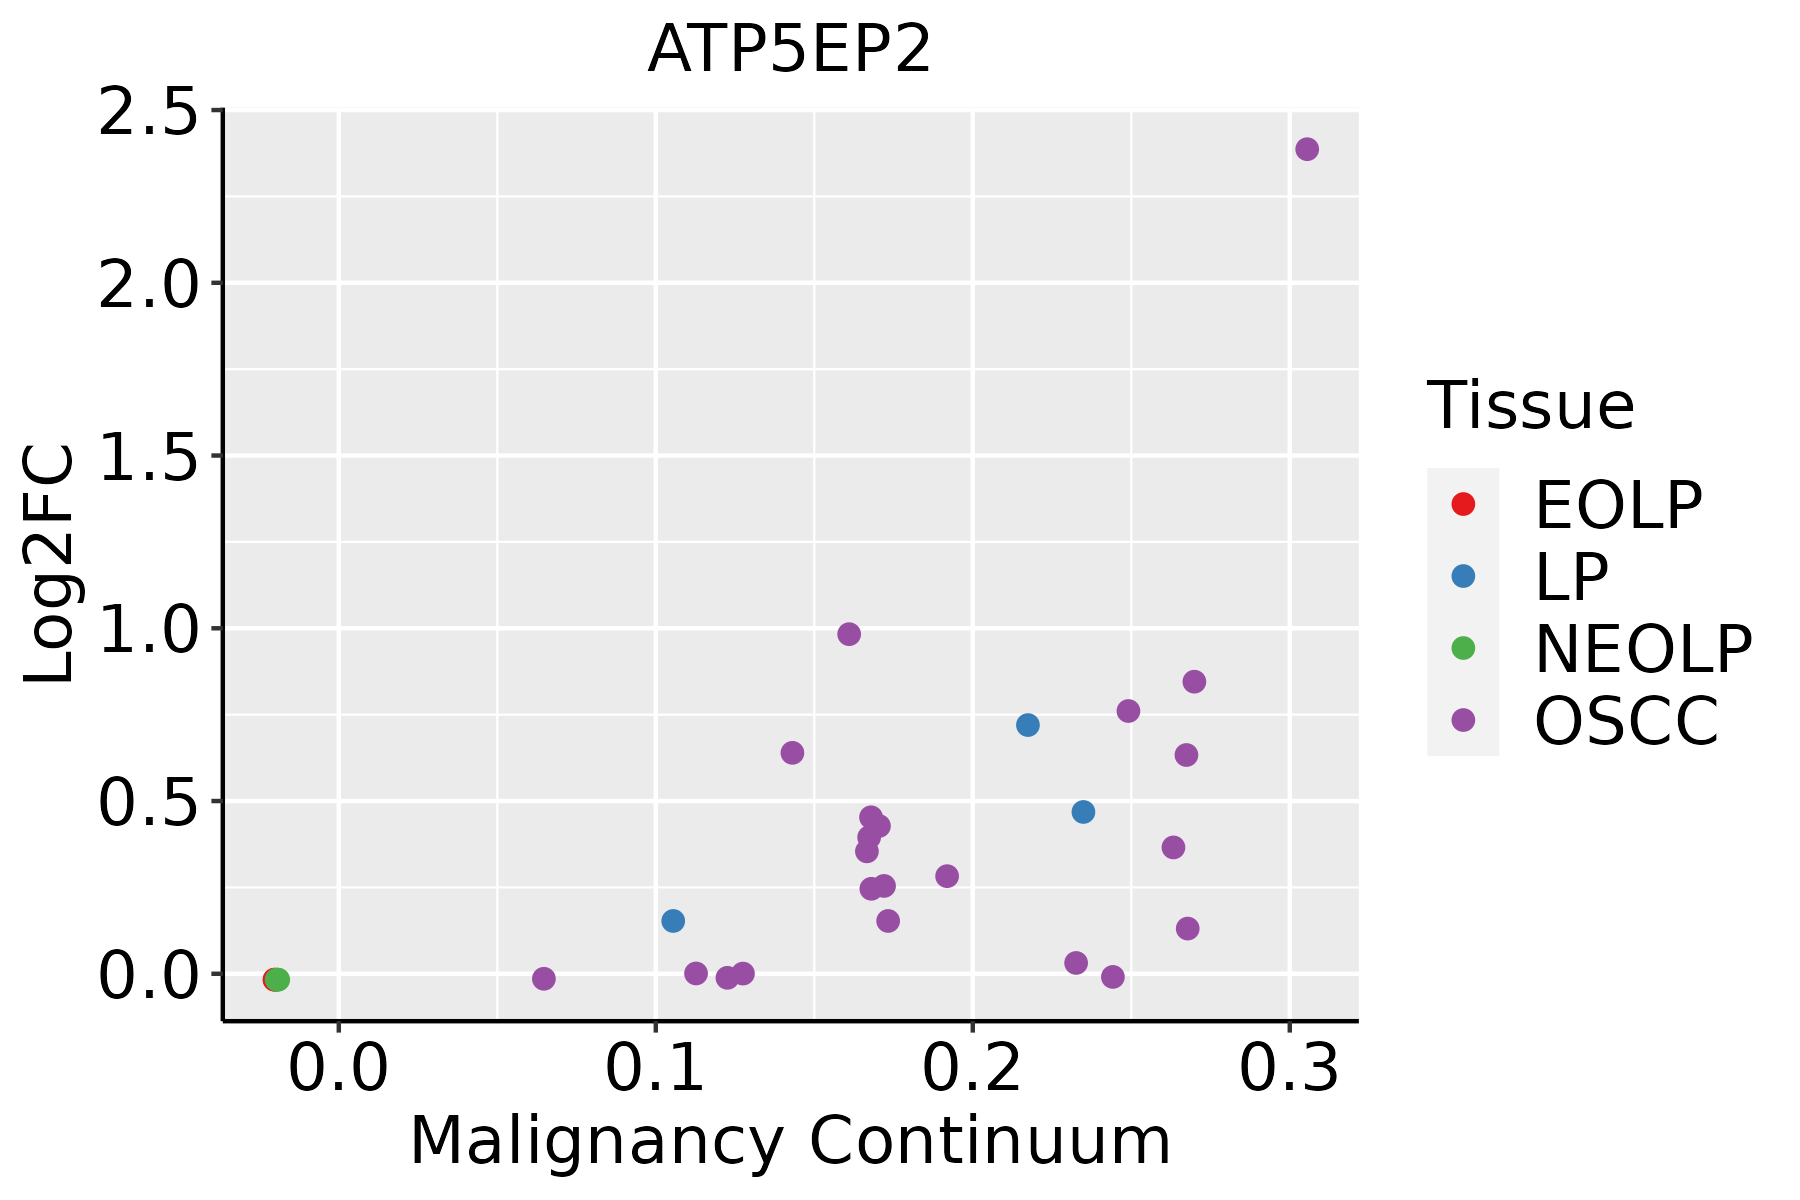 | EOLP: Erosive Oral lichen planus |
| LP: leukoplakia | ||
| NEOLP: Non-erosive oral lichen planus | ||
| OSCC: Oral squamous cell carcinoma | ||
| Skin | 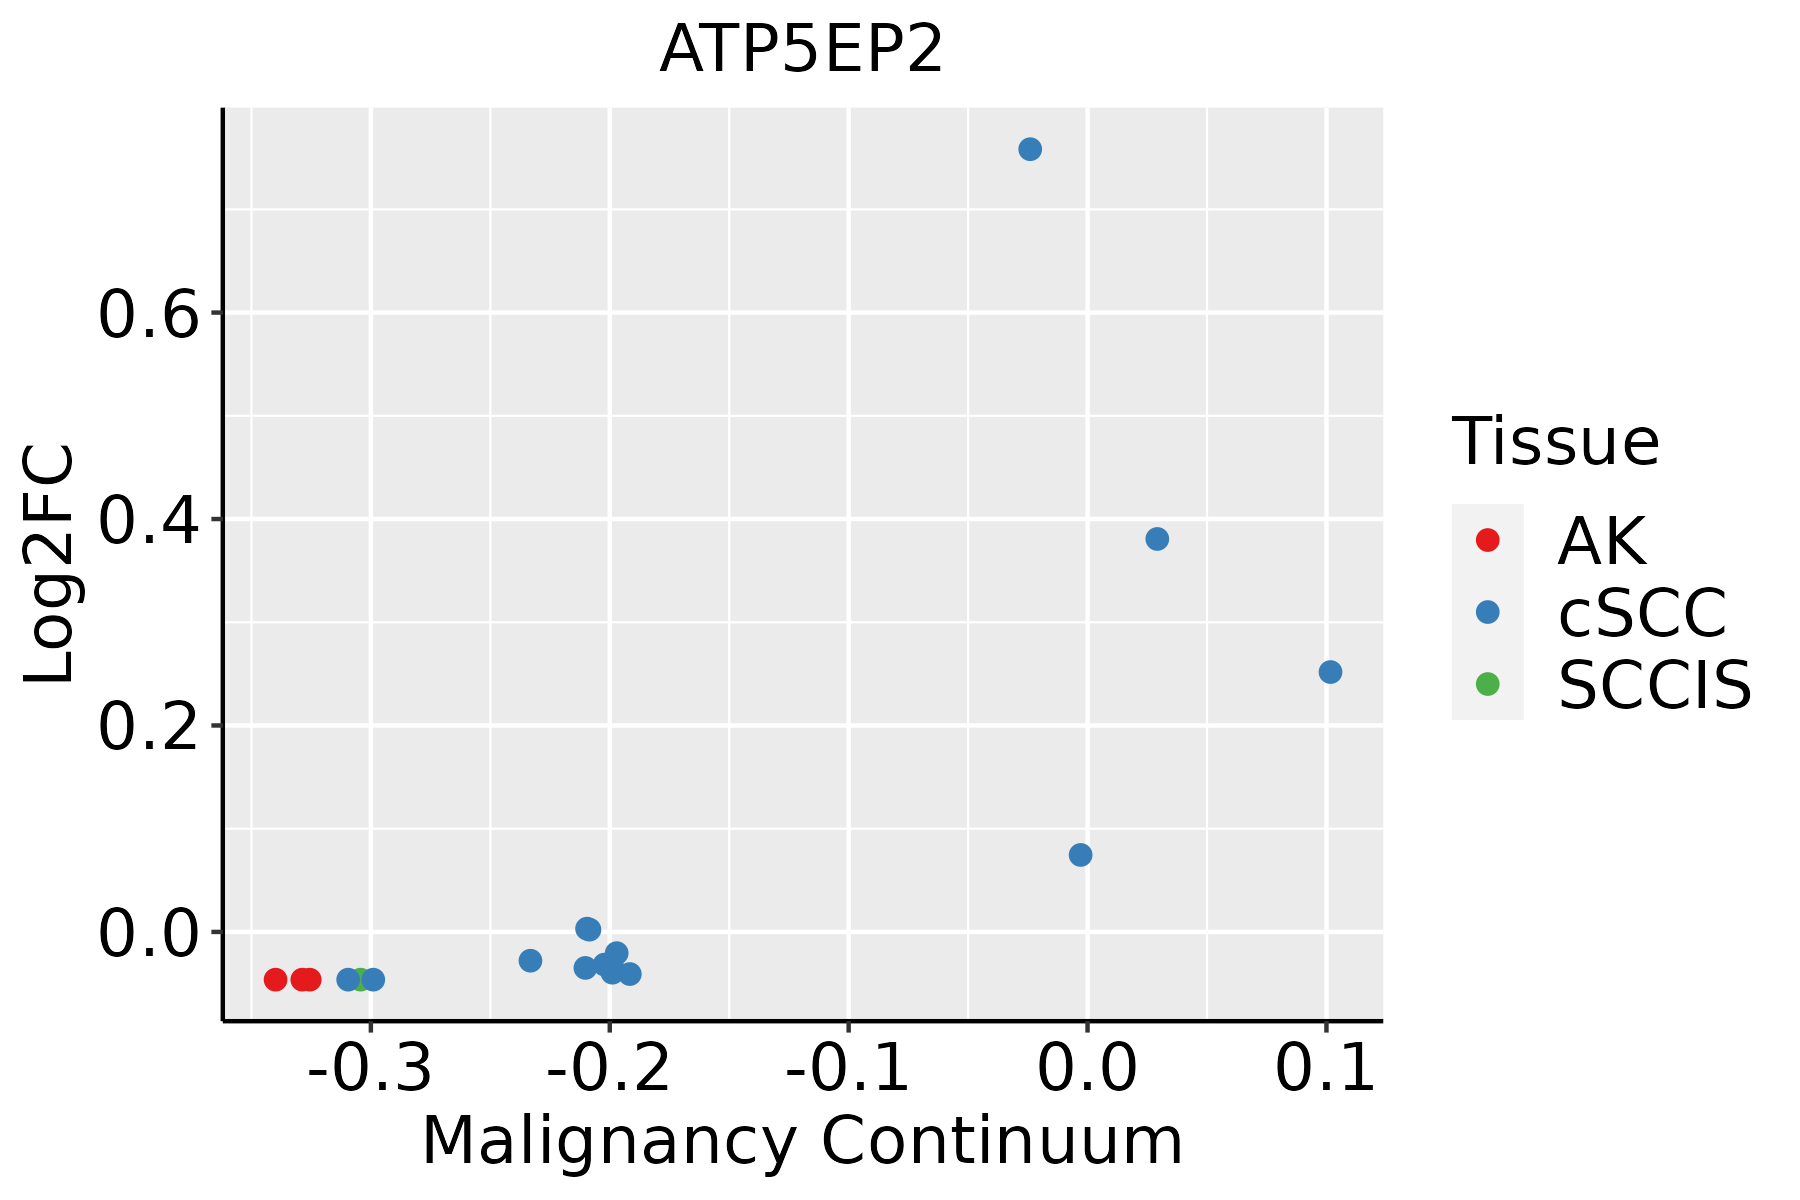 | AK: Actinic keratosis |
| cSCC: Cutaneous squamous cell carcinoma | ||
| SCCIS:squamous cell carcinoma in situ |
| ∗log2FC in expression of this searched gene in stem-like cells from each diseased tissue sample relative to stem-like cells in normal samples in each tissue plotted against the malignancy continuum. Samples are colored based on if they are from different disease stage. |
Top |
Malignant transformation related pathway analysis |
| Find out the enriched GO biological processes and KEGG pathways involved in transition from healthy to precancer to cancer |
| Tissue | Disease Stage | Enriched GO biological Processes |
| Colorectum | AD |  |
| Colorectum | SER |  |
| Colorectum | MSS |  |
| Colorectum | MSI-H |  |
| Colorectum | FAP |  |
| ∗Top 15 enriched GO BP terms are showed in the bar plot of each disease state in each tissue. Each row represents a significant GO biological process which is colored according to the -log10(p.adjust). |
| Page: 1 2 3 4 5 6 7 8 9 |
| GO ID | Tissue | Disease Stage | Description | Gene Ratio | Bg Ratio | pvalue | p.adjust | Count |
| Page: 1 |
| Pathway ID | Tissue | Disease Stage | Description | Gene Ratio | Bg Ratio | pvalue | p.adjust | qvalue | Count |
| Page: 1 |
Top |
Cell-cell communication analysis |
| Identification of potential cell-cell interactions between two cell types and their ligand-receptor pairs for different disease states |
| Ligand | Receptor | LRpair | Pathway | Tissue | Disease Stage |
| Page: 1 |
Top |
Single-cell gene regulatory network inference analysis |
| Find out the significant the regulons (TFs) and the target genes of each regulon across cell types for different disease states |
| TF | Cell Type | Tissue | Disease Stage | Target Gene | RSS | Regulon Activity |
| ∗The dot plots of a searched regulon are shown for all cell subpopulations in each disease state of each tissue based on the regulon specific score inferred using pySCENIC and by calculating the average expression. |
| Page: 1 |
Top |
Somatic mutation of malignant transformation related genes |
| Annotation of somatic variants for genes involved in malignant transformation |
| Hugo Symbol | Variant Class | Variant Classification | dbSNP RS | HGVSc | HGVSp | HGVSp Short | SWISSPROT | BIOTYPE | SIFT | PolyPhen | Tumor Sample Barcode | Tissue | Histology | Sex | Age | Stage | Therapy Types | Drugs | Outcome |
| ATP5EP2 | SNV | Missense_Mutation | c.82N>C | p.Lys28Gln | p.K28Q | Q5VTU8 | protein_coding | deleterious(0) | probably_damaging(0.995) | TCGA-AA-3510-01 | Colorectum | colon adenocarcinoma | Male | >=65 | I/II | Unknown | Unknown | SD | |
| ATP5EP2 | SNV | Missense_Mutation | c.130N>C | p.Lys44Gln | p.K44Q | Q5VTU8 | protein_coding | deleterious(0) | probably_damaging(0.995) | TCGA-CA-6718-01 | Colorectum | colon adenocarcinoma | Male | <65 | I/II | Unknown | Unknown | PD | |
| ATP5EP2 | deletion | Frame_Shift_Del | c.106delN | p.Lys37ArgfsTer7 | p.K37Rfs*7 | Q5VTU8 | protein_coding | TCGA-AG-4007-01 | Colorectum | rectum adenocarcinoma | Male | >=65 | III/IV | Unknown | Unknown | SD | |||
| ATP5EP2 | SNV | Missense_Mutation | novel | c.64N>A | p.Val22Ile | p.V22I | Q5VTU8 | protein_coding | tolerated(0.32) | benign(0.003) | TCGA-A5-A0G2-01 | Endometrium | uterine corpus endometrioid carcinoma | Female | <65 | III/IV | Unknown | Unknown | SD |
| ATP5EP2 | SNV | Missense_Mutation | novel | c.143N>G | p.Val48Gly | p.V48G | Q5VTU8 | protein_coding | deleterious(0.05) | benign(0.223) | TCGA-DD-AAD1-01 | Liver | liver hepatocellular carcinoma | Female | <65 | I/II | Unknown | Unknown | PD |
| ATP5EP2 | SNV | Missense_Mutation | c.84N>C | p.Lys28Asn | p.K28N | Q5VTU8 | protein_coding | deleterious(0) | probably_damaging(0.995) | TCGA-05-4417-01 | Lung | lung adenocarcinoma | Female | <65 | I/II | Unknown | Unknown | SD | |
| ATP5EP2 | SNV | Missense_Mutation | novel | c.71N>C | p.Arg24Thr | p.R24T | Q5VTU8 | protein_coding | deleterious(0) | probably_damaging(0.987) | TCGA-73-4668-01 | Lung | lung adenocarcinoma | Female | >=65 | I/II | Chemotherapy | pemetrexed | PD |
| Page: 1 |
Top |
Related drugs of malignant transformation related genes |
| Identification of chemicals and drugs interact with genes involved in malignant transfromation |
| (DGIdb 4.0) |
| Entrez ID | Symbol | Category | Interaction Types | Drug Claim Name | Drug Name | PMIDs |
| Page: 1 |

Copyright 2023-Present -The University of Texas Health Science Center at Houston |