
|
|||||
|
 | |
| |
| |
| |
| |
| |
|
Gene: ATP2C2 |
Gene summary for ATP2C2 |
| Gene information | Species | Human | Gene symbol | ATP2C2 | Gene ID | 9914 |
| Gene name | ATPase secretory pathway Ca2+ transporting 2 | |
| Gene Alias | SPCA2 | |
| Cytomap | 16q24.1 | |
| Gene Type | protein-coding | GO ID | GO:0000041 | UniProtAcc | A0A0A0MSP0 |
Top |
Malignant transformation analysis |
| Identification of the aberrant gene expression in precancerous and cancerous lesions by comparing the gene expression of stem-like cells in diseased tissues with normal stem cells |
| Entrez ID | Symbol | Replicates | Species | Organ | Tissue | Adj P-value | Log2FC | Malignancy |
| 9914 | ATP2C2 | HTA11_3410_2000001011 | Human | Colorectum | AD | 6.61e-10 | -4.29e-01 | 0.0155 |
| 9914 | ATP2C2 | HTA11_2951_2000001011 | Human | Colorectum | AD | 2.32e-07 | -8.16e-01 | 0.0216 |
| 9914 | ATP2C2 | HTA11_347_2000001011 | Human | Colorectum | AD | 4.68e-28 | 1.23e+00 | -0.1954 |
| 9914 | ATP2C2 | HTA11_411_2000001011 | Human | Colorectum | SER | 2.35e-07 | 9.96e-01 | -0.2602 |
| 9914 | ATP2C2 | HTA11_2112_2000001011 | Human | Colorectum | SER | 1.76e-14 | 7.85e-01 | -0.2196 |
| 9914 | ATP2C2 | HTA11_696_2000001011 | Human | Colorectum | AD | 5.29e-14 | 9.70e-01 | -0.1464 |
| 9914 | ATP2C2 | HTA11_2992_2000001011 | Human | Colorectum | SER | 1.56e-09 | 6.27e-01 | -0.1706 |
| 9914 | ATP2C2 | HTA11_546_2000001011 | Human | Colorectum | AD | 3.97e-06 | 7.46e-01 | -0.0842 |
| 9914 | ATP2C2 | HTA11_866_3004761011 | Human | Colorectum | AD | 4.50e-06 | -4.72e-01 | 0.096 |
| 9914 | ATP2C2 | HTA11_7663_2000001011 | Human | Colorectum | SER | 4.28e-03 | 4.36e-01 | 0.0131 |
| 9914 | ATP2C2 | HTA11_10711_2000001011 | Human | Colorectum | AD | 1.09e-06 | -5.74e-01 | 0.0338 |
| 9914 | ATP2C2 | HTA11_6818_2000001011 | Human | Colorectum | AD | 1.51e-08 | 7.77e-01 | 0.0112 |
| 9914 | ATP2C2 | HTA11_99999970781_79442 | Human | Colorectum | MSS | 6.11e-32 | -6.96e-01 | 0.294 |
| 9914 | ATP2C2 | HTA11_99999965104_69814 | Human | Colorectum | MSS | 1.97e-11 | 8.42e-01 | 0.281 |
| 9914 | ATP2C2 | HTA11_99999973899_84307 | Human | Colorectum | MSS | 2.05e-13 | -8.59e-01 | 0.2585 |
| 9914 | ATP2C2 | HTA11_99999974143_84620 | Human | Colorectum | MSS | 7.33e-06 | -4.39e-01 | 0.3005 |
| 9914 | ATP2C2 | F007 | Human | Colorectum | FAP | 9.17e-17 | -7.61e-01 | 0.1176 |
| 9914 | ATP2C2 | A002-C-010 | Human | Colorectum | FAP | 8.34e-10 | -4.46e-01 | 0.242 |
| 9914 | ATP2C2 | A001-C-207 | Human | Colorectum | FAP | 7.31e-26 | -8.45e-01 | 0.1278 |
| 9914 | ATP2C2 | A015-C-203 | Human | Colorectum | FAP | 1.33e-60 | -1.00e+00 | -0.1294 |
| Page: 1 2 3 4 5 6 |
| Tissue | Expression Dynamics | Abbreviation |
| Colorectum (GSE201348) |  | FAP: Familial adenomatous polyposis |
| CRC: Colorectal cancer | ||
| Colorectum (HTA11) |  | AD: Adenomas |
| SER: Sessile serrated lesions | ||
| MSI-H: Microsatellite-high colorectal cancer | ||
| MSS: Microsatellite stable colorectal cancer | ||
| Esophagus | 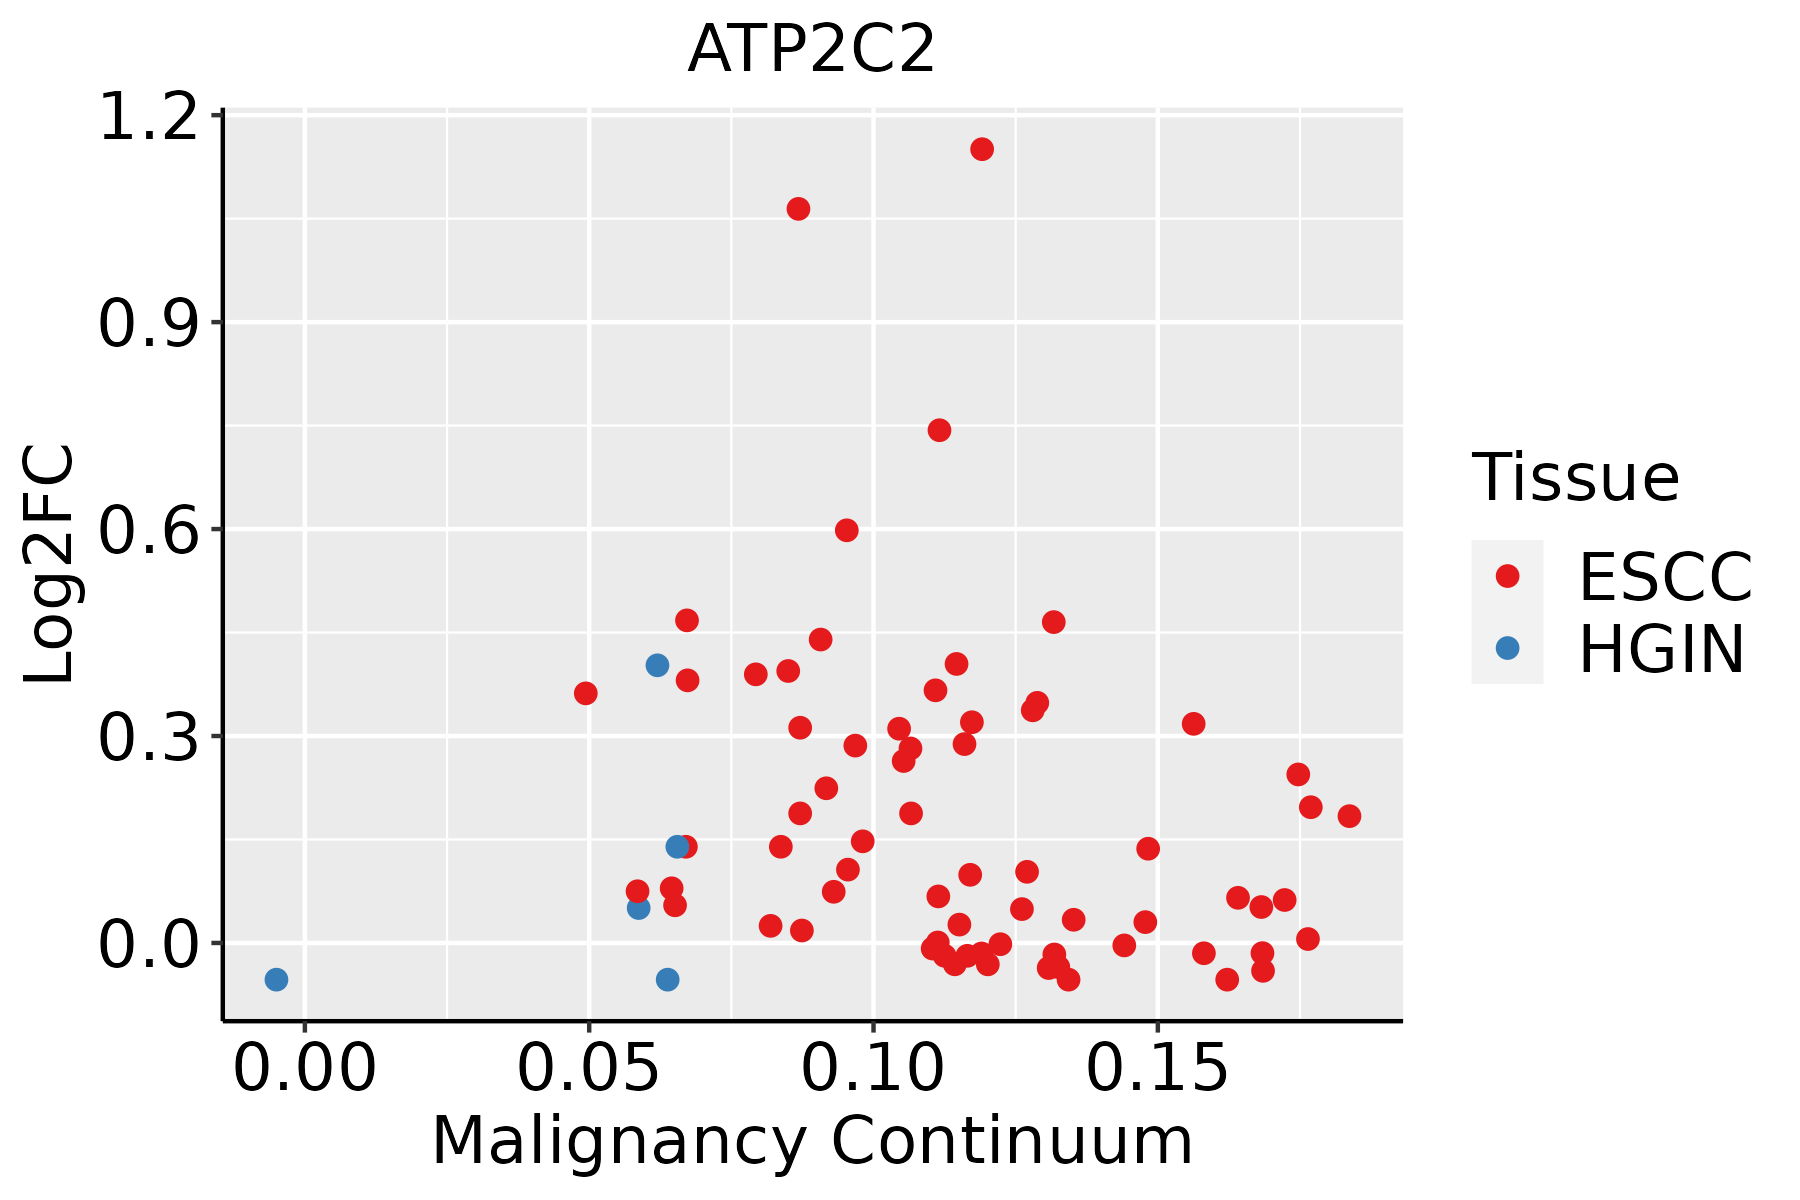 | ESCC: Esophageal squamous cell carcinoma |
| HGIN: High-grade intraepithelial neoplasias | ||
| LGIN: Low-grade intraepithelial neoplasias | ||
| Lung | 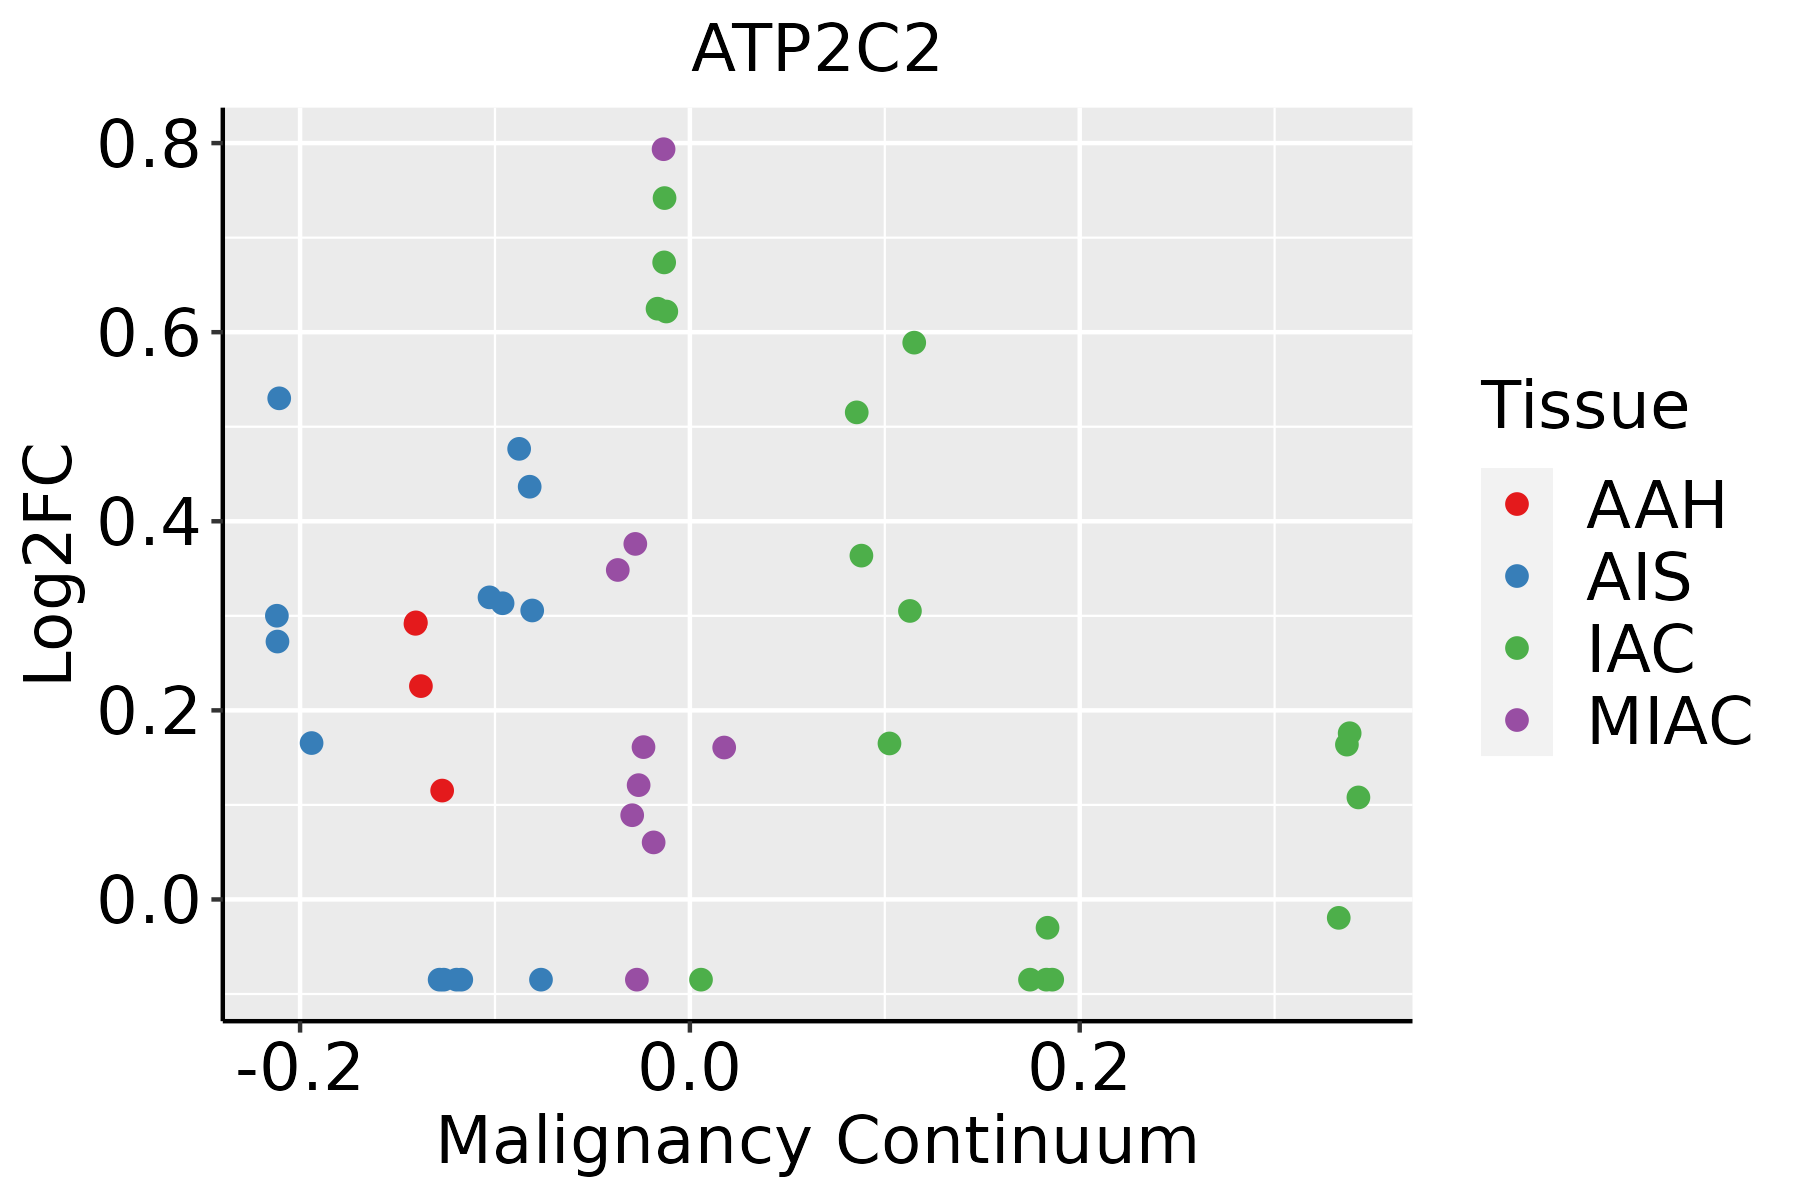 | AAH: Atypical adenomatous hyperplasia |
| AIS: Adenocarcinoma in situ | ||
| IAC: Invasive lung adenocarcinoma | ||
| MIA: Minimally invasive adenocarcinoma | ||
| Oral Cavity | 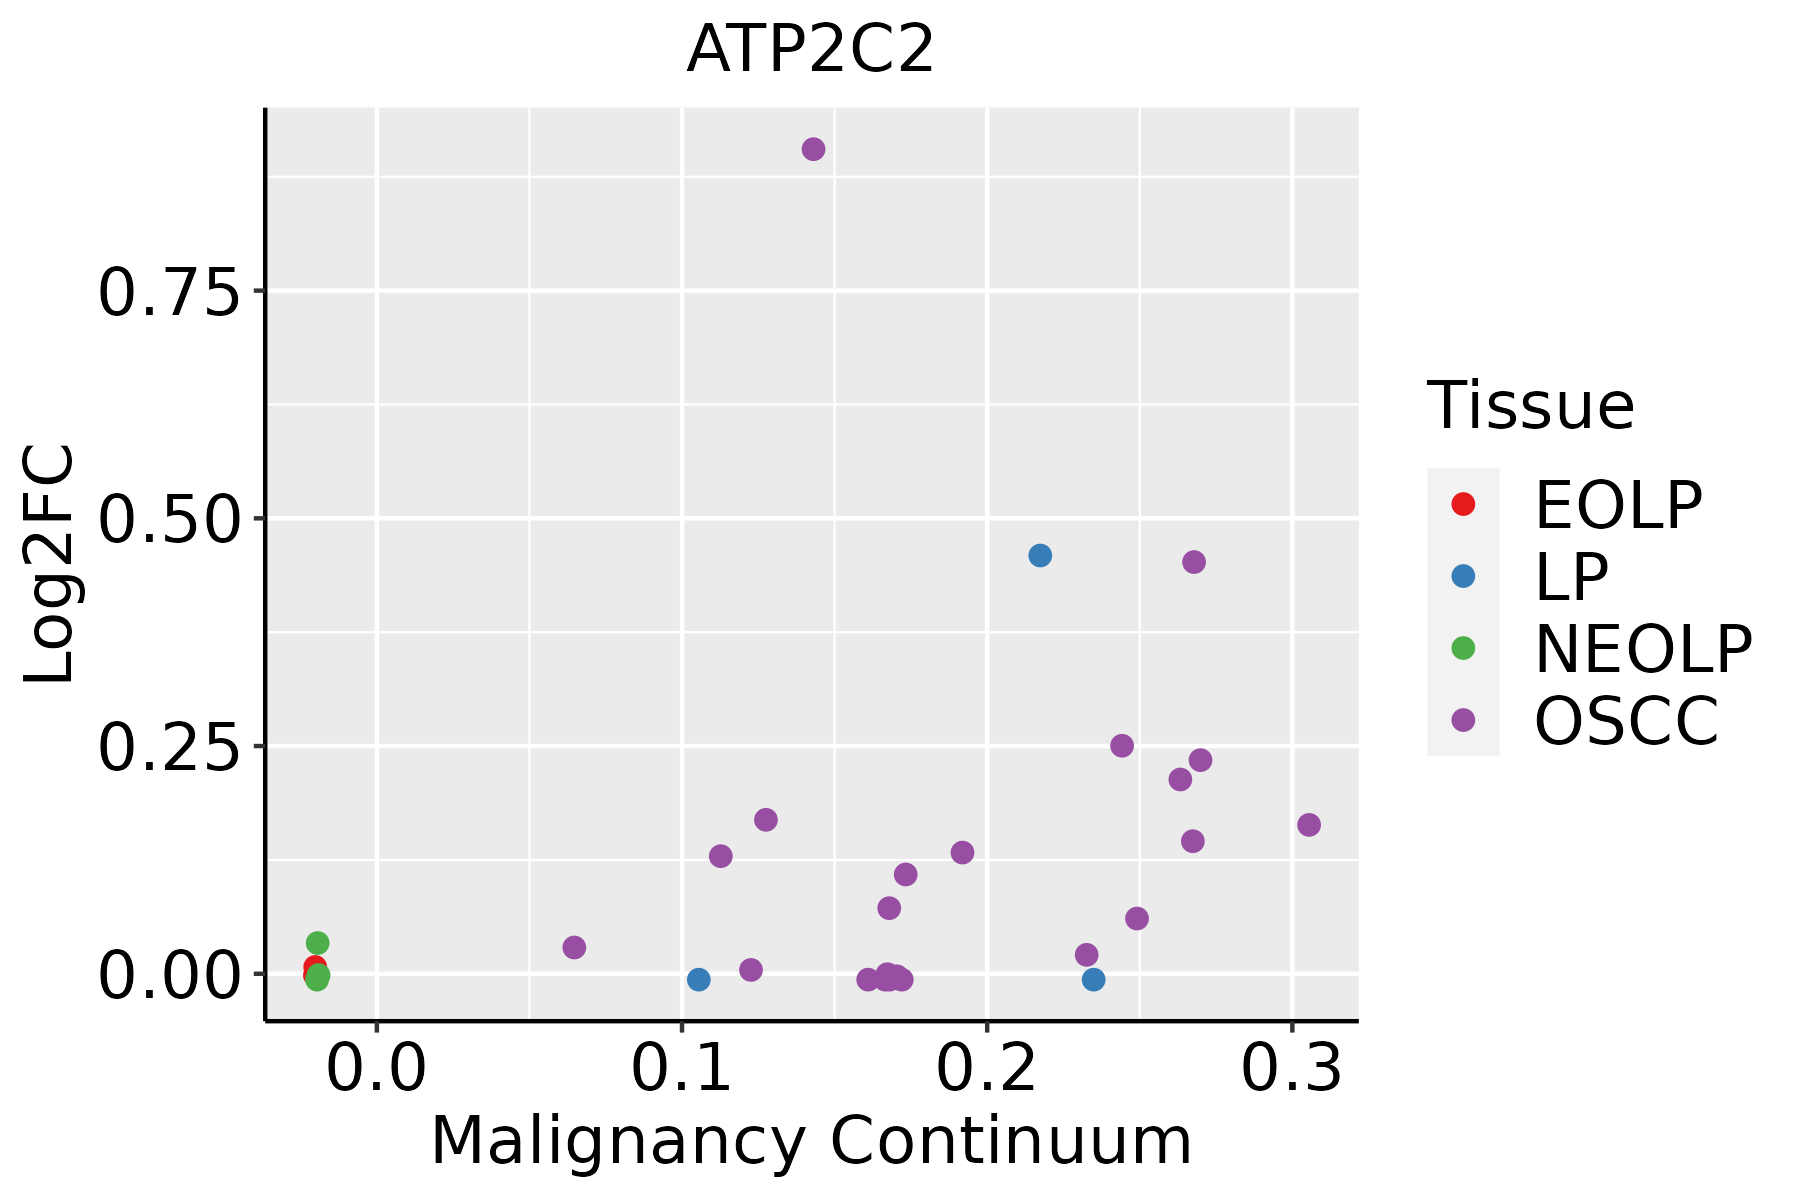 | EOLP: Erosive Oral lichen planus |
| LP: leukoplakia | ||
| NEOLP: Non-erosive oral lichen planus | ||
| OSCC: Oral squamous cell carcinoma | ||
| Prostate |  | BPH: Benign Prostatic Hyperplasia |
| ∗log2FC in expression of this searched gene in stem-like cells from each diseased tissue sample relative to stem-like cells in normal samples in each tissue plotted against the malignancy continuum. Samples are colored based on if they are from different disease stage. |
Top |
Malignant transformation related pathway analysis |
| Find out the enriched GO biological processes and KEGG pathways involved in transition from healthy to precancer to cancer |
| Tissue | Disease Stage | Enriched GO biological Processes |
| Colorectum | AD |  |
| Colorectum | SER |  |
| Colorectum | MSS |  |
| Colorectum | MSI-H |  |
| Colorectum | FAP |  |
| ∗Top 15 enriched GO BP terms are showed in the bar plot of each disease state in each tissue. Each row represents a significant GO biological process which is colored according to the -log10(p.adjust). |
| Page: 1 2 3 4 5 6 7 8 9 |
| GO ID | Tissue | Disease Stage | Description | Gene Ratio | Bg Ratio | pvalue | p.adjust | Count |
| GO:0072659 | Colorectum | AD | protein localization to plasma membrane | 122/3918 | 284/18723 | 2.86e-17 | 1.49e-14 | 122 |
| GO:1990778 | Colorectum | AD | protein localization to cell periphery | 129/3918 | 333/18723 | 5.51e-14 | 1.15e-11 | 129 |
| GO:0048732 | Colorectum | AD | gland development | 149/3918 | 436/18723 | 6.07e-11 | 6.33e-09 | 149 |
| GO:0030879 | Colorectum | AD | mammary gland development | 53/3918 | 137/18723 | 1.46e-06 | 4.58e-05 | 53 |
| GO:0061180 | Colorectum | AD | mammary gland epithelium development | 28/3918 | 67/18723 | 8.74e-05 | 1.35e-03 | 28 |
| GO:0071421 | Colorectum | AD | manganese ion transmembrane transport | 6/3918 | 10/18723 | 8.03e-03 | 4.73e-02 | 6 |
| GO:00726591 | Colorectum | SER | protein localization to plasma membrane | 92/2897 | 284/18723 | 6.36e-13 | 1.86e-10 | 92 |
| GO:19907781 | Colorectum | SER | protein localization to cell periphery | 98/2897 | 333/18723 | 6.09e-11 | 9.57e-09 | 98 |
| GO:00487321 | Colorectum | SER | gland development | 112/2897 | 436/18723 | 1.75e-08 | 1.28e-06 | 112 |
| GO:00611801 | Colorectum | SER | mammary gland epithelium development | 22/2897 | 67/18723 | 3.11e-04 | 5.03e-03 | 22 |
| GO:00308791 | Colorectum | SER | mammary gland development | 37/2897 | 137/18723 | 3.61e-04 | 5.61e-03 | 37 |
| GO:00726592 | Colorectum | MSS | protein localization to plasma membrane | 113/3467 | 284/18723 | 3.23e-17 | 1.55e-14 | 113 |
| GO:19907782 | Colorectum | MSS | protein localization to cell periphery | 120/3467 | 333/18723 | 2.02e-14 | 5.47e-12 | 120 |
| GO:00487322 | Colorectum | MSS | gland development | 143/3467 | 436/18723 | 3.85e-13 | 8.01e-11 | 143 |
| GO:00308792 | Colorectum | MSS | mammary gland development | 51/3467 | 137/18723 | 1.88e-07 | 8.26e-06 | 51 |
| GO:00611802 | Colorectum | MSS | mammary gland epithelium development | 28/3467 | 67/18723 | 8.47e-06 | 2.11e-04 | 28 |
| GO:00726594 | Colorectum | FAP | protein localization to plasma membrane | 95/2622 | 284/18723 | 4.86e-17 | 9.93e-14 | 95 |
| GO:19907784 | Colorectum | FAP | protein localization to cell periphery | 100/2622 | 333/18723 | 2.19e-14 | 2.68e-11 | 100 |
| GO:00487324 | Colorectum | FAP | gland development | 103/2622 | 436/18723 | 3.61e-08 | 3.12e-06 | 103 |
| GO:0010959 | Colorectum | FAP | regulation of metal ion transport | 83/2622 | 406/18723 | 2.06e-04 | 2.96e-03 | 83 |
| Page: 1 2 3 |
| Pathway ID | Tissue | Disease Stage | Description | Gene Ratio | Bg Ratio | pvalue | p.adjust | qvalue | Count |
| Page: 1 |
Top |
Cell-cell communication analysis |
| Identification of potential cell-cell interactions between two cell types and their ligand-receptor pairs for different disease states |
| Ligand | Receptor | LRpair | Pathway | Tissue | Disease Stage |
| Page: 1 |
Top |
Single-cell gene regulatory network inference analysis |
| Find out the significant the regulons (TFs) and the target genes of each regulon across cell types for different disease states |
| TF | Cell Type | Tissue | Disease Stage | Target Gene | RSS | Regulon Activity |
| ∗The dot plots of a searched regulon are shown for all cell subpopulations in each disease state of each tissue based on the regulon specific score inferred using pySCENIC and by calculating the average expression. |
| Page: 1 |
Top |
Somatic mutation of malignant transformation related genes |
| Annotation of somatic variants for genes involved in malignant transformation |
| Hugo Symbol | Variant Class | Variant Classification | dbSNP RS | HGVSc | HGVSp | HGVSp Short | SWISSPROT | BIOTYPE | SIFT | PolyPhen | Tumor Sample Barcode | Tissue | Histology | Sex | Age | Stage | Therapy Types | Drugs | Outcome |
| ATP2C2 | SNV | Missense_Mutation | rs373029761 | c.1657N>T | p.Arg553Trp | p.R553W | protein_coding | deleterious(0) | probably_damaging(1) | TCGA-A8-A09M-01 | Breast | breast invasive carcinoma | Female | >=65 | III/IV | Chemotherapy | paclitaxel | CR | |
| ATP2C2 | SNV | Missense_Mutation | c.1009N>C | p.Glu337Gln | p.E337Q | protein_coding | deleterious(0) | probably_damaging(0.999) | TCGA-AC-A23H-01 | Breast | breast invasive carcinoma | Female | >=65 | I/II | Unknown | Unknown | PD | ||
| ATP2C2 | SNV | Missense_Mutation | c.2158N>C | p.Glu720Gln | p.E720Q | protein_coding | deleterious(0.01) | probably_damaging(0.999) | TCGA-AC-A23H-01 | Breast | breast invasive carcinoma | Female | >=65 | I/II | Unknown | Unknown | PD | ||
| ATP2C2 | SNV | Missense_Mutation | rs531822897 | c.1478C>T | p.Ala493Val | p.A493V | protein_coding | deleterious(0.03) | benign(0.218) | TCGA-AN-A046-01 | Breast | breast invasive carcinoma | Female | >=65 | I/II | Unknown | Unknown | SD | |
| ATP2C2 | SNV | Missense_Mutation | c.550N>G | p.Arg184Gly | p.R184G | protein_coding | deleterious(0.05) | possibly_damaging(0.859) | TCGA-AN-A0XU-01 | Breast | breast invasive carcinoma | Female | <65 | I/II | Unknown | Unknown | SD | ||
| ATP2C2 | SNV | Missense_Mutation | c.2857N>A | p.Glu953Lys | p.E953K | protein_coding | deleterious(0) | probably_damaging(0.999) | TCGA-BH-A0DP-01 | Breast | breast invasive carcinoma | Female | <65 | I/II | Hormone Therapy | arimidex | SD | ||
| ATP2C2 | SNV | Missense_Mutation | rs772764894 | c.2005G>A | p.Val669Met | p.V669M | protein_coding | deleterious(0) | probably_damaging(0.954) | TCGA-BH-A18G-01 | Breast | breast invasive carcinoma | Female | >=65 | I/II | Unknown | Unknown | SD | |
| ATP2C2 | SNV | Missense_Mutation | c.1187C>T | p.Thr396Met | p.T396M | protein_coding | deleterious(0.01) | probably_damaging(1) | TCGA-BH-A18V-01 | Breast | breast invasive carcinoma | Female | <65 | I/II | Unknown | Unknown | SD | ||
| ATP2C2 | SNV | Missense_Mutation | c.320T>C | p.Leu107Pro | p.L107P | protein_coding | deleterious(0) | probably_damaging(0.979) | TCGA-D8-A1XQ-01 | Breast | breast invasive carcinoma | Female | >=65 | I/II | Unknown | Unknown | SD | ||
| ATP2C2 | insertion | In_Frame_Ins | novel | c.1078_1079insCACGCTCTCCTCGAATCCAGCCAACCC | p.Ile360delinsThrArgSerProArgIleGlnProThrLeu | p.I360delinsTRSPRIQPTL | protein_coding | TCGA-A8-A07R-01 | Breast | breast invasive carcinoma | Female | >=65 | III/IV | Ancillary | zoledronic | SD |
| Page: 1 2 3 4 5 6 7 8 9 10 |
Top |
Related drugs of malignant transformation related genes |
| Identification of chemicals and drugs interact with genes involved in malignant transfromation |
| (DGIdb 4.0) |
| Entrez ID | Symbol | Category | Interaction Types | Drug Claim Name | Drug Name | PMIDs |
| Page: 1 |

Copyright 2023-Present -The University of Texas Health Science Center at Houston |