| Tissue | Expression Dynamics | Abbreviation |
| Cervix | 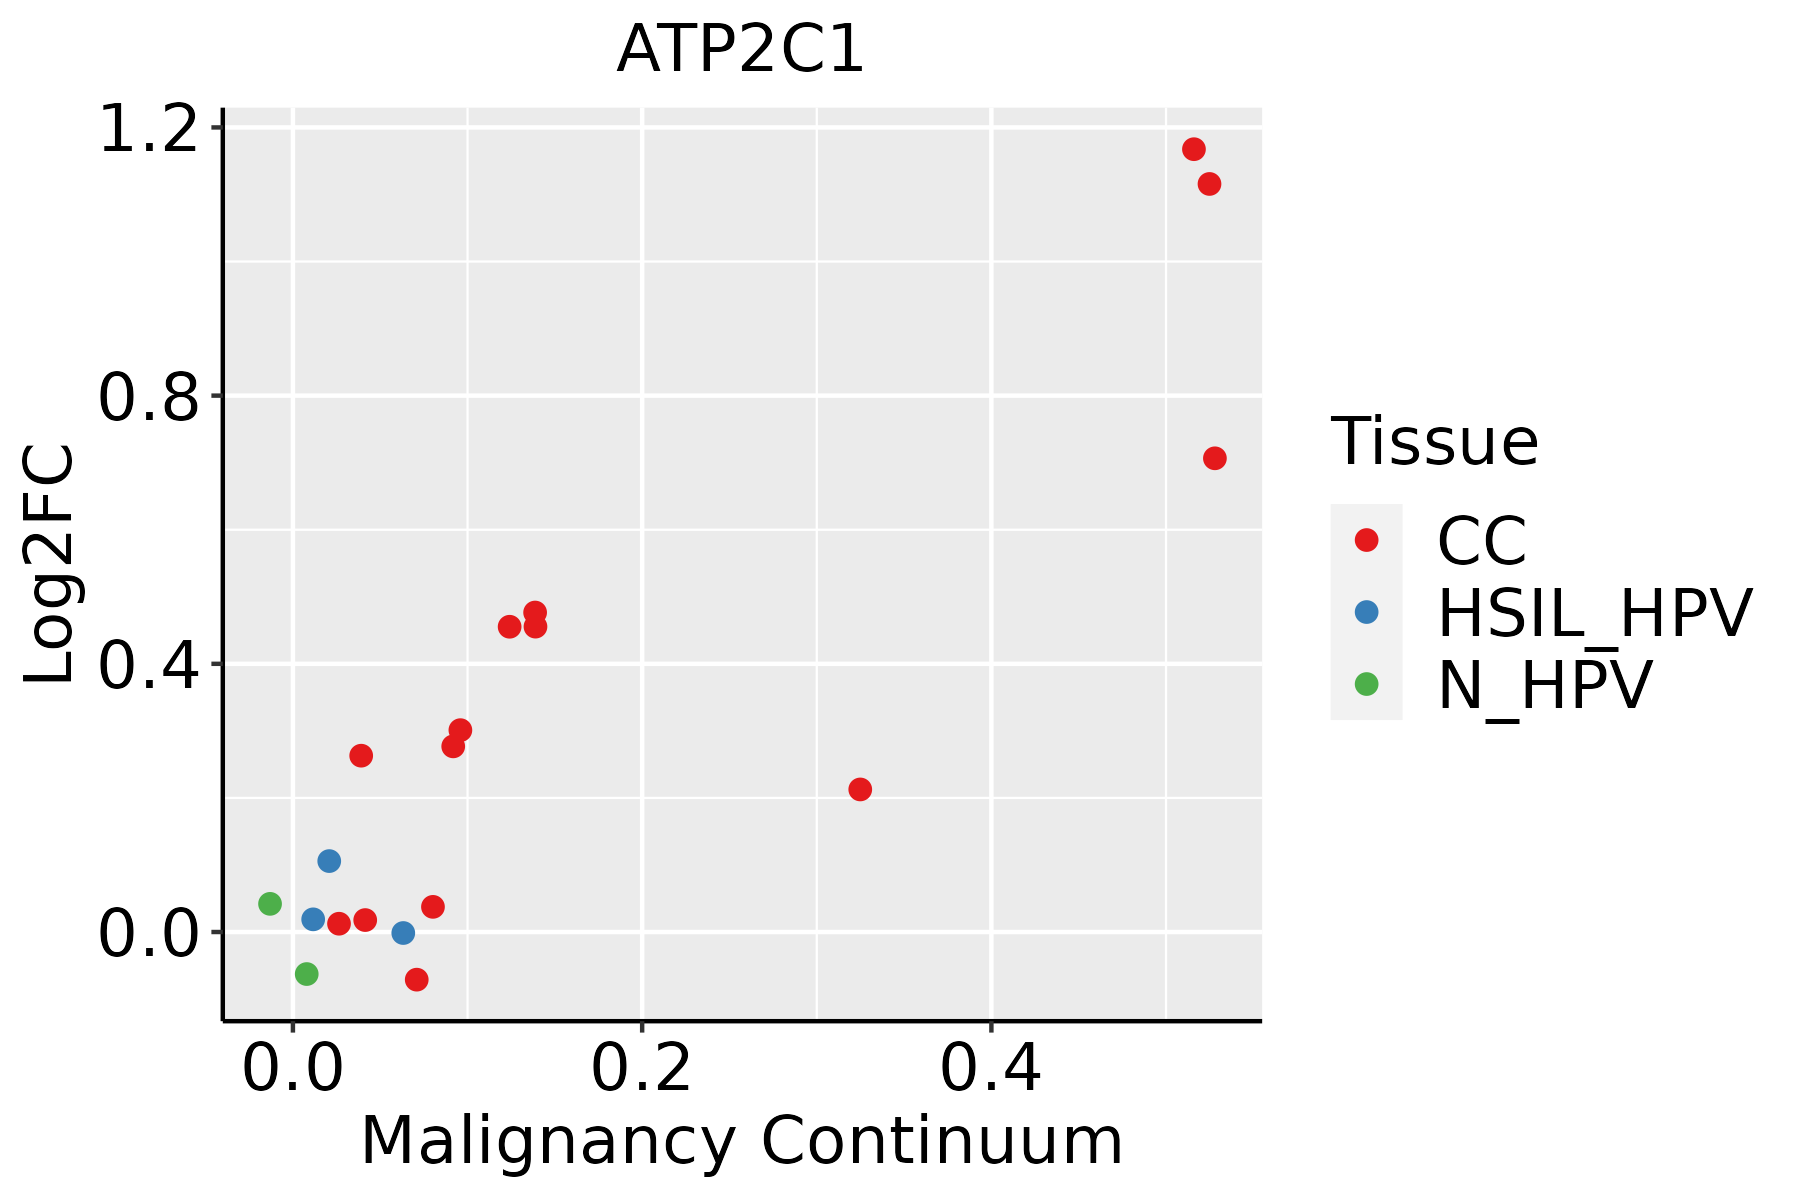 | CC: Cervix cancer |
| HSIL_HPV: HPV-infected high-grade squamous intraepithelial lesions |
| N_HPV: HPV-infected normal cervix |
| Colorectum (GSE201348) |  | FAP: Familial adenomatous polyposis |
| CRC: Colorectal cancer |
| Colorectum (HTA11) |  | AD: Adenomas |
| SER: Sessile serrated lesions |
| MSI-H: Microsatellite-high colorectal cancer |
| MSS: Microsatellite stable colorectal cancer |
| Esophagus | 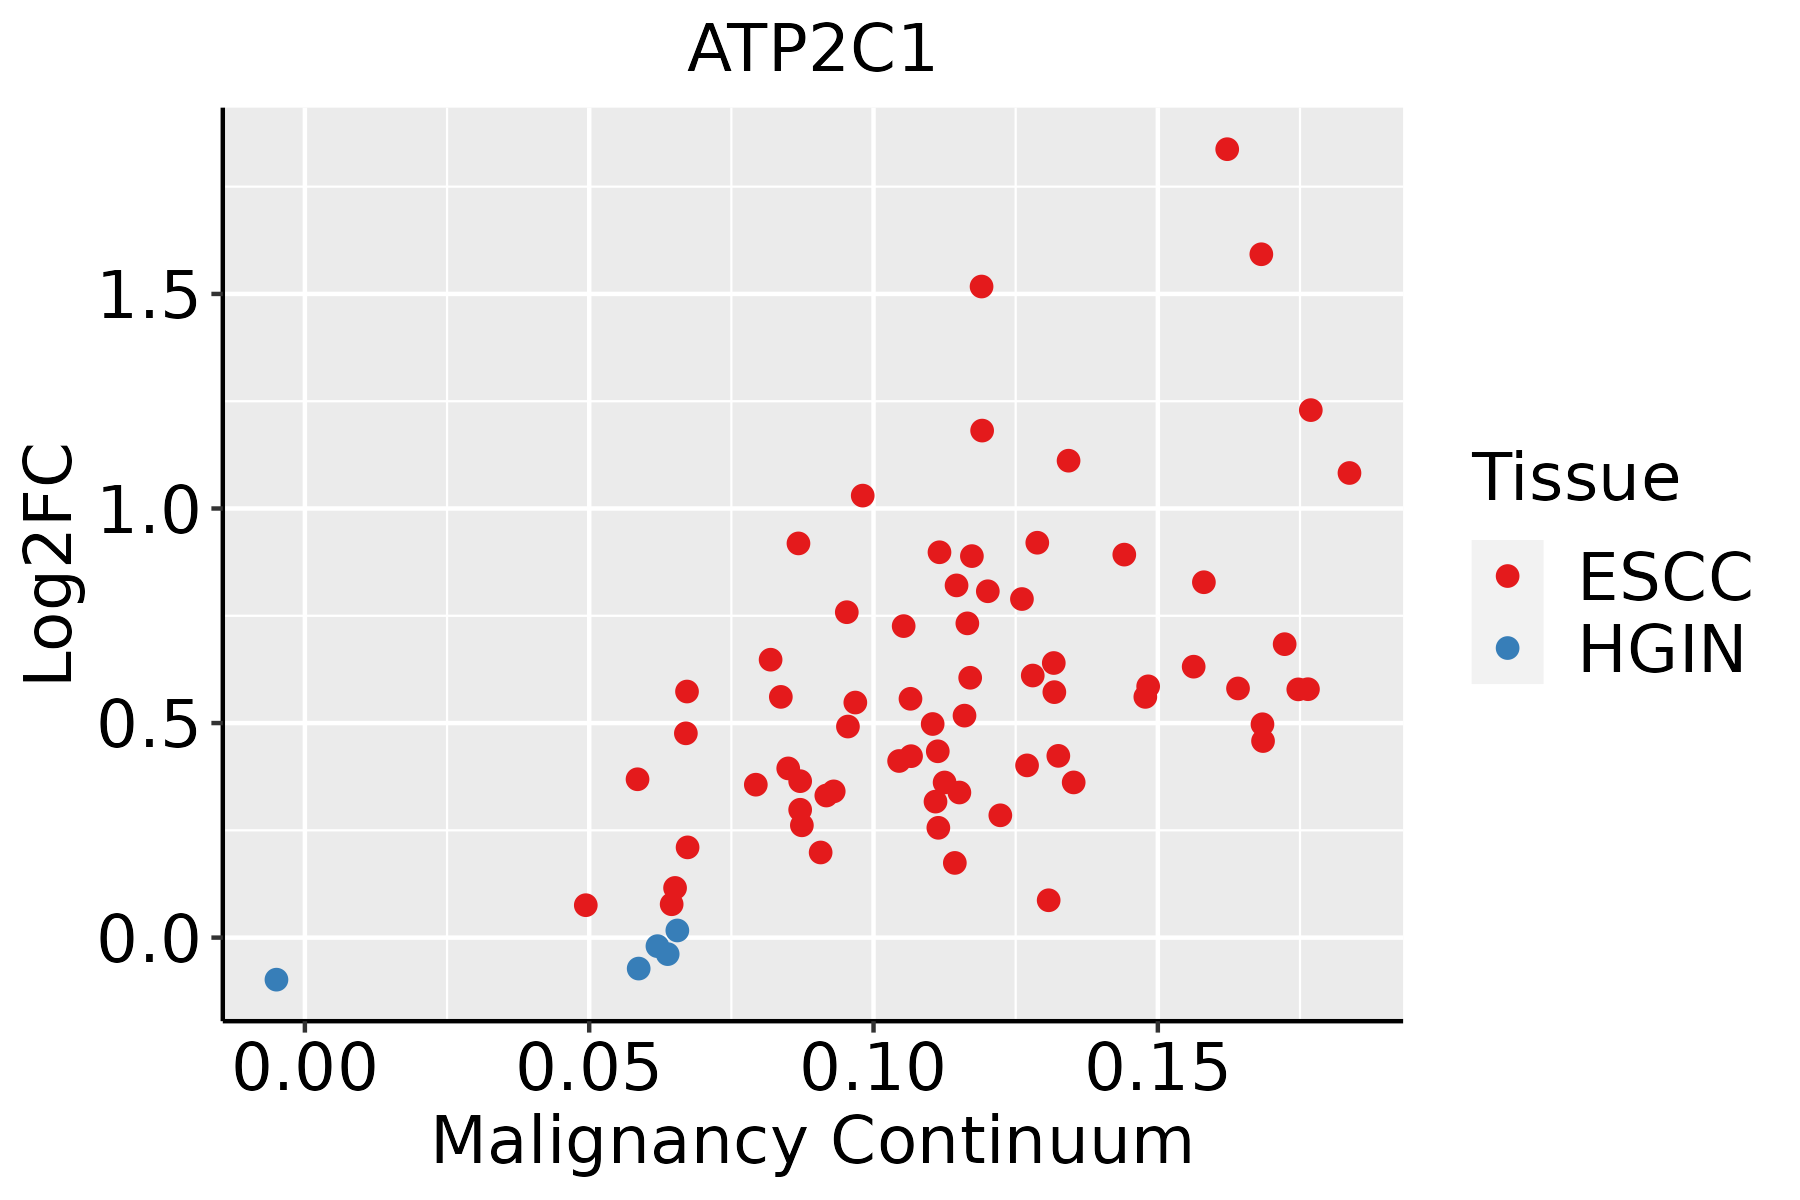 | ESCC: Esophageal squamous cell carcinoma |
| HGIN: High-grade intraepithelial neoplasias |
| LGIN: Low-grade intraepithelial neoplasias |
| Liver |  | HCC: Hepatocellular carcinoma |
| NAFLD: Non-alcoholic fatty liver disease |
| Lung | 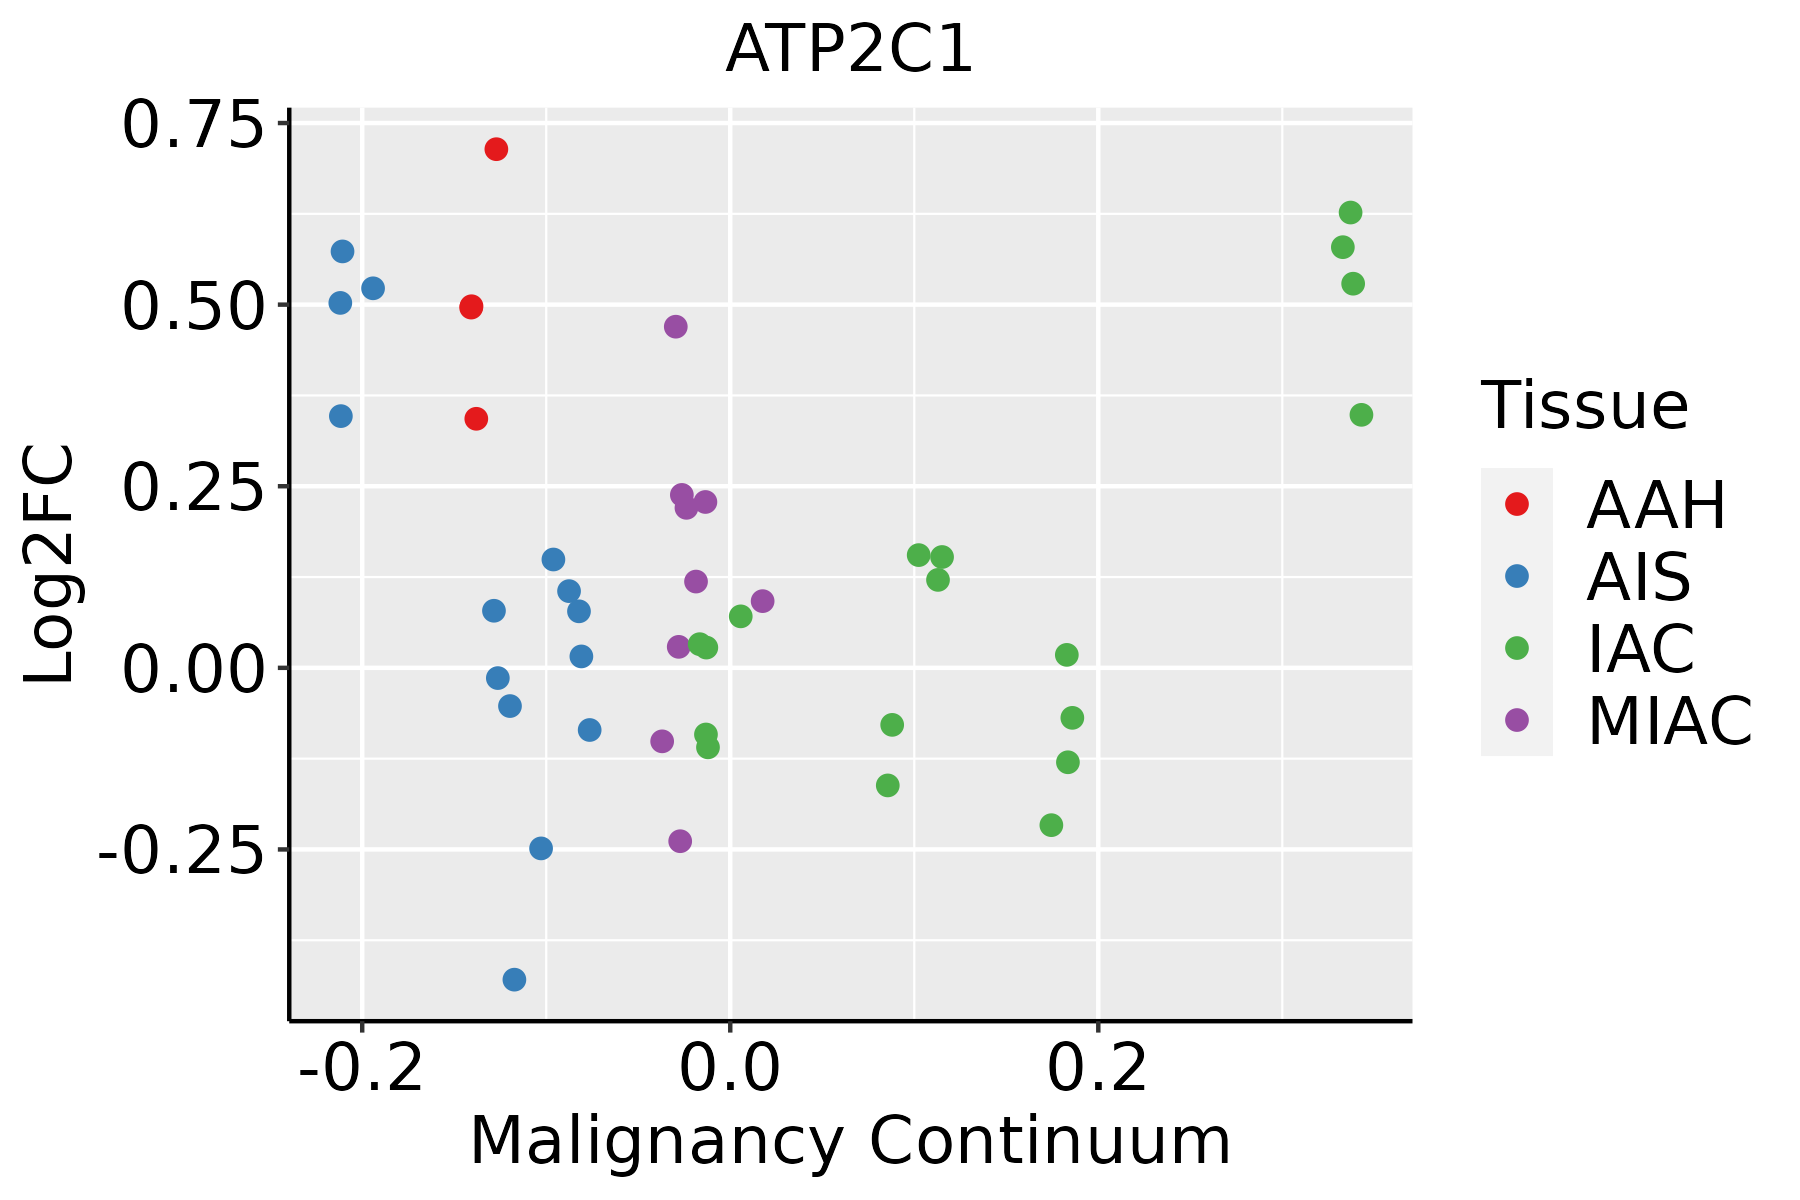 | AAH: Atypical adenomatous hyperplasia |
| AIS: Adenocarcinoma in situ |
| IAC: Invasive lung adenocarcinoma |
| MIA: Minimally invasive adenocarcinoma |
| Oral Cavity |  | EOLP: Erosive Oral lichen planus |
| LP: leukoplakia |
| NEOLP: Non-erosive oral lichen planus |
| OSCC: Oral squamous cell carcinoma |
| Prostate | 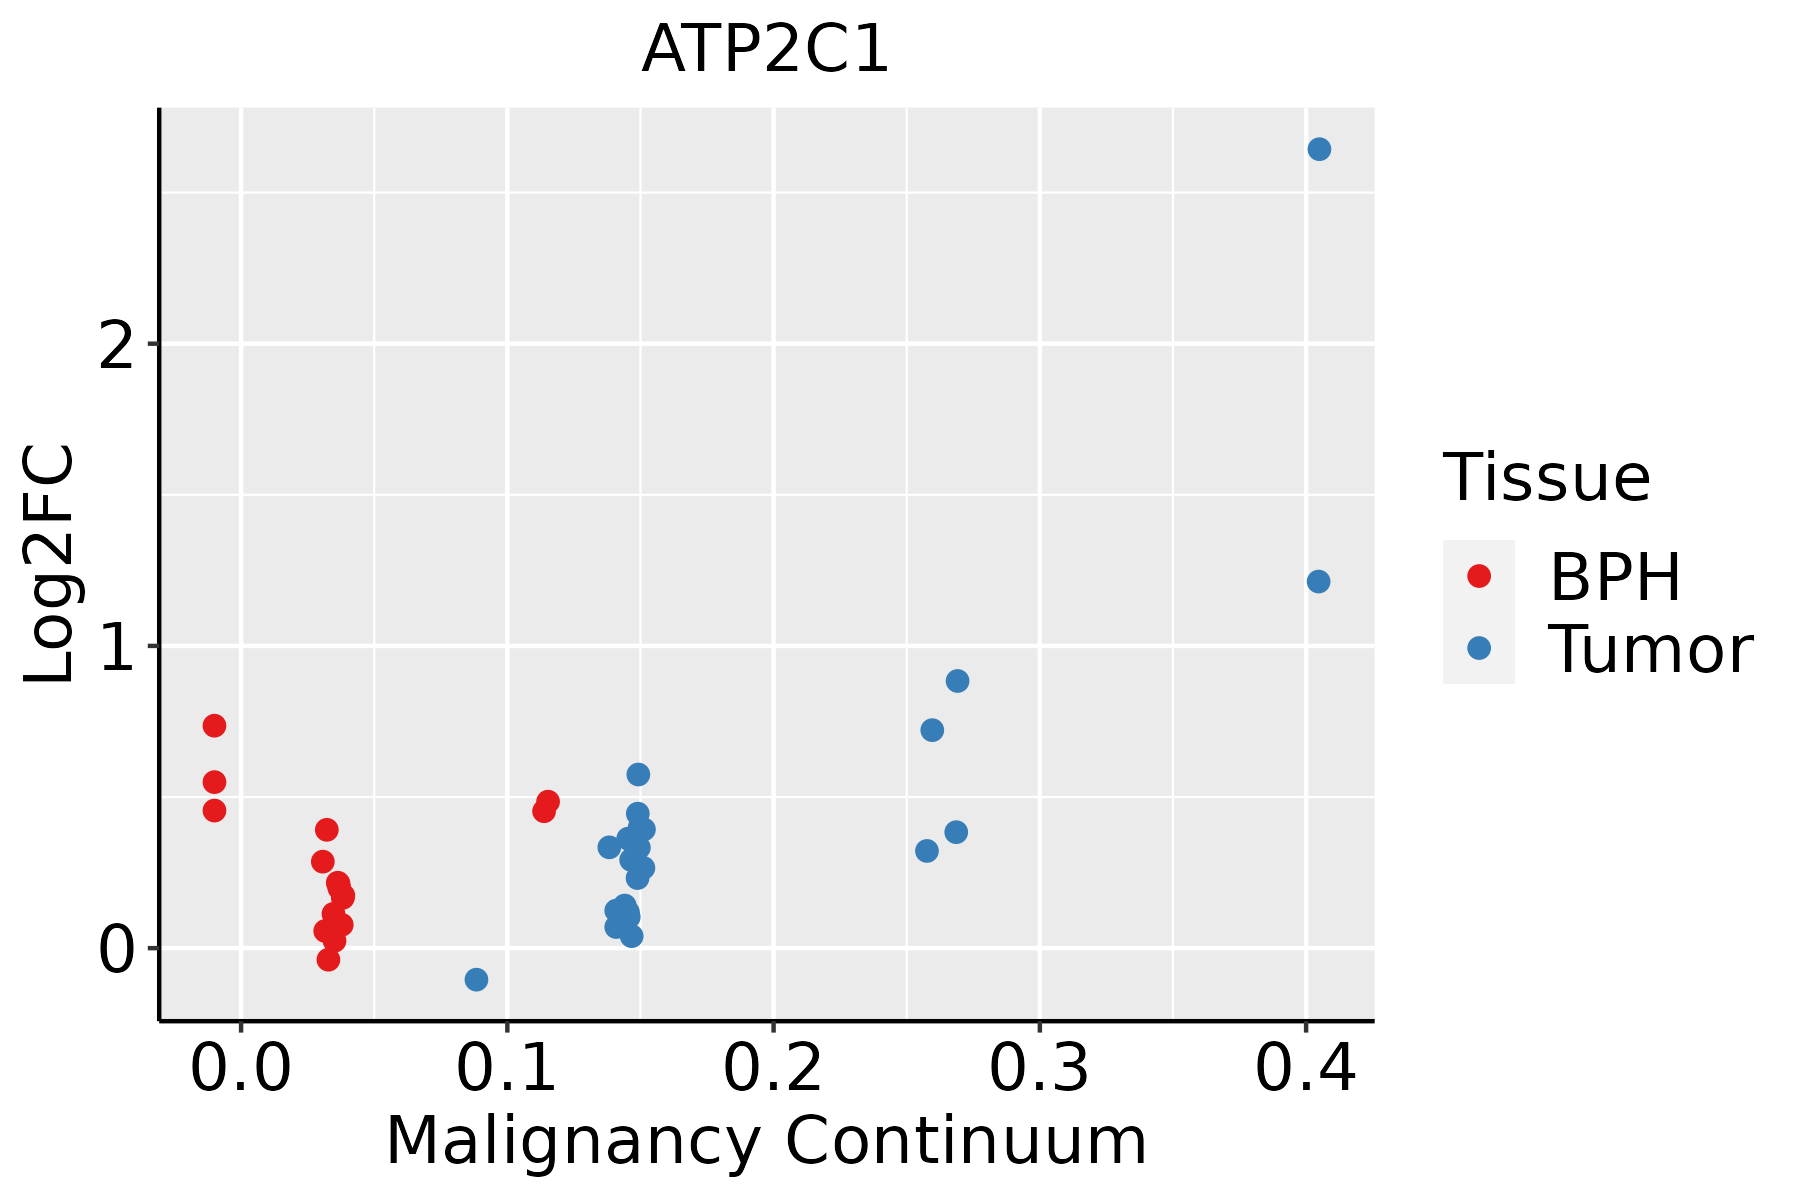 | BPH: Benign Prostatic Hyperplasia |
| Skin | 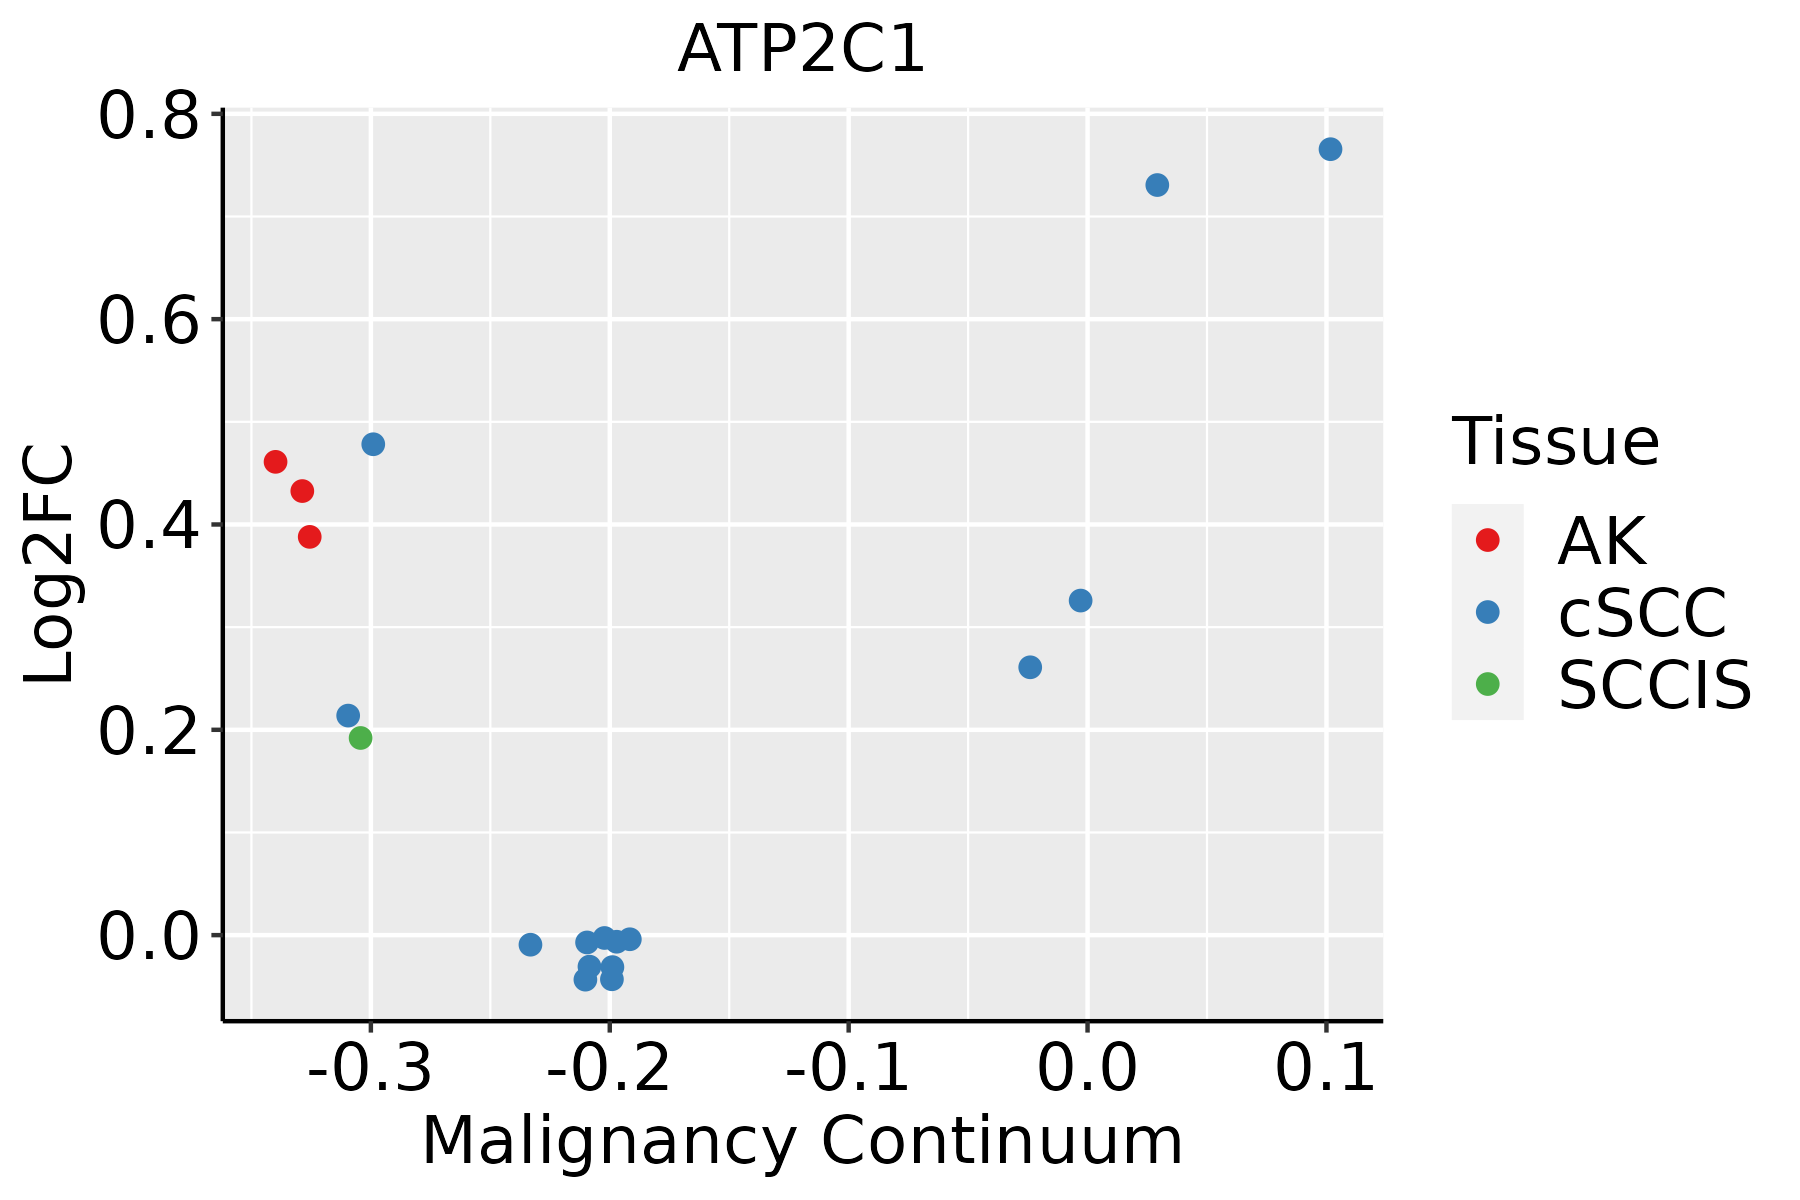 | AK: Actinic keratosis |
| cSCC: Cutaneous squamous cell carcinoma |
| SCCIS:squamous cell carcinoma in situ |
| Thyroid | 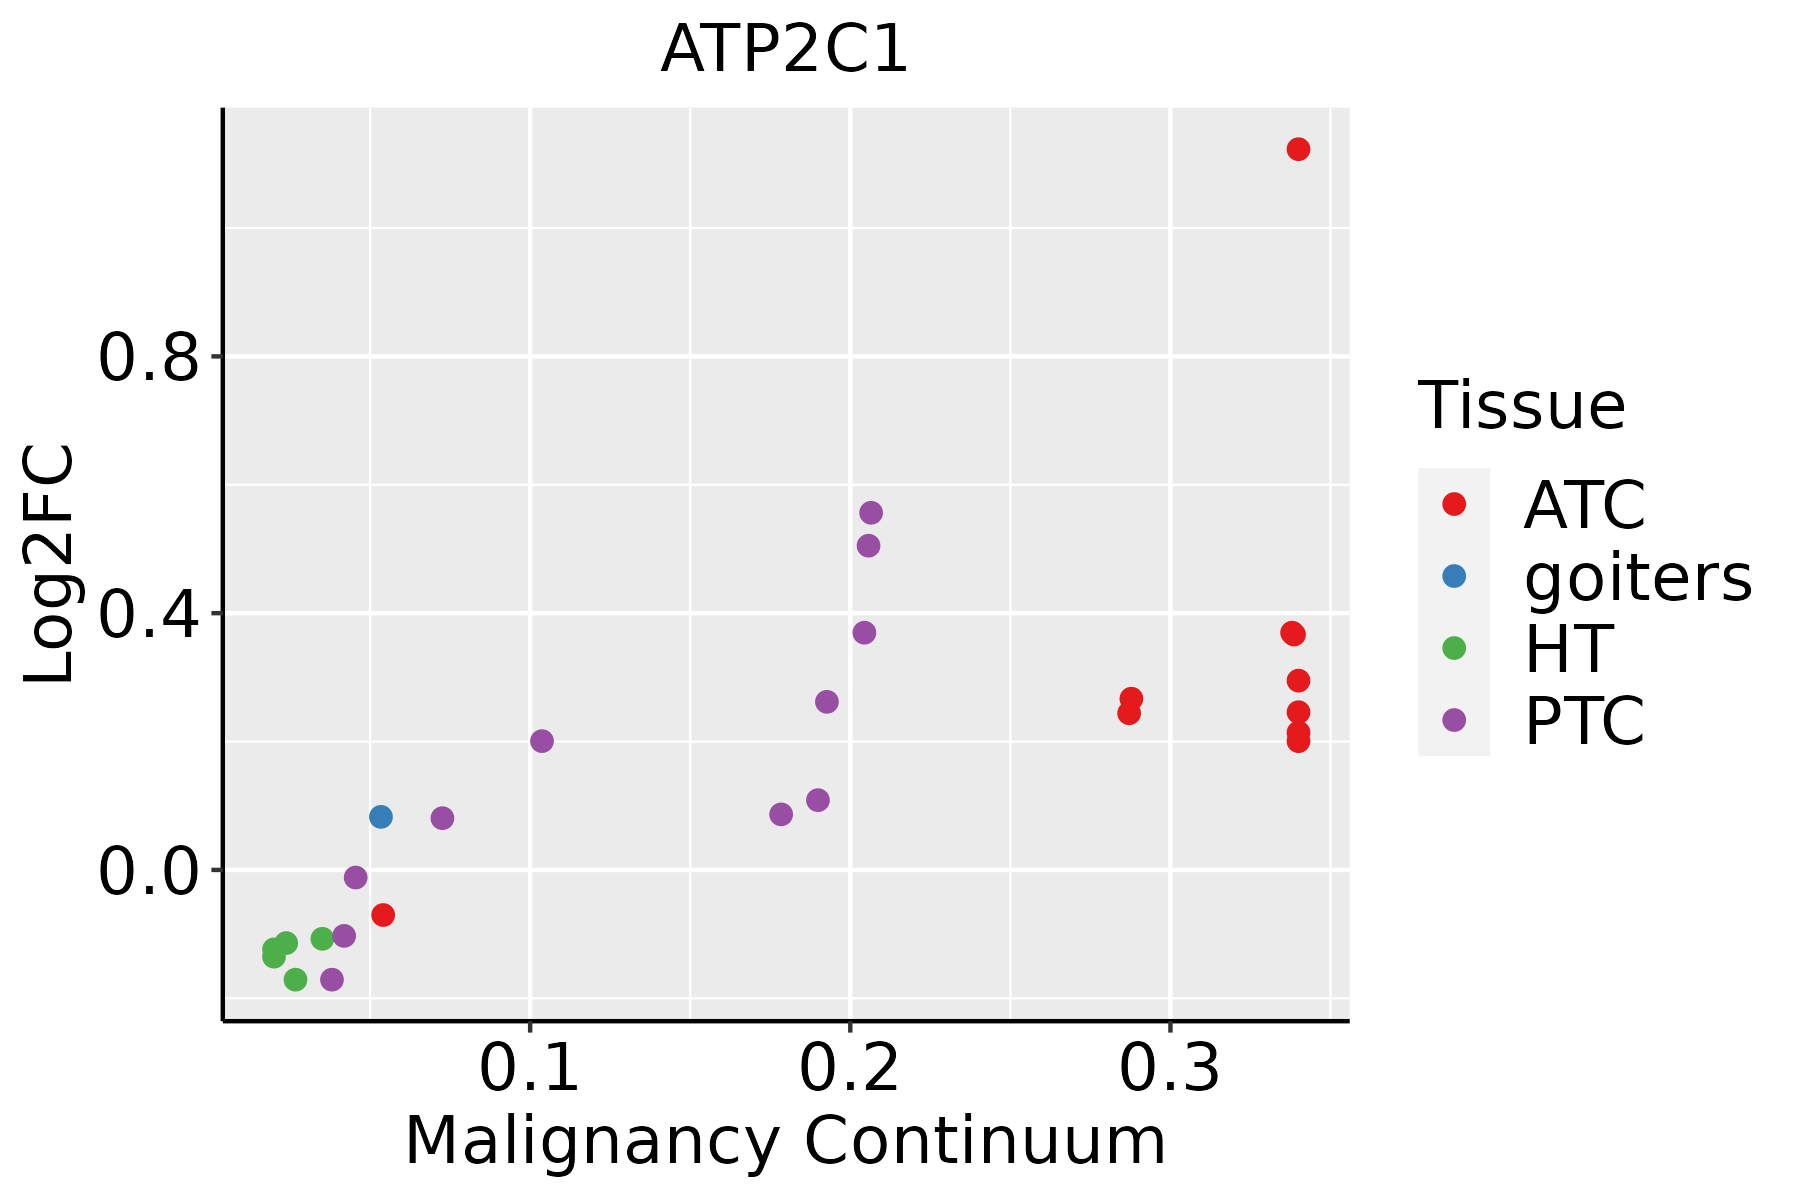 | ATC: Anaplastic thyroid cancer |
| HT: Hashimoto's thyroiditis |
| PTC: Papillary thyroid cancer |
| GO ID | Tissue | Disease Stage | Description | Gene Ratio | Bg Ratio | pvalue | p.adjust | Count |
| GO:00085446 | Cervix | CC | epidermis development | 83/2311 | 324/18723 | 3.91e-11 | 8.54e-09 | 83 |
| GO:190382910 | Cervix | CC | positive regulation of cellular protein localization | 72/2311 | 276/18723 | 3.20e-10 | 4.46e-08 | 72 |
| GO:007265910 | Cervix | CC | protein localization to plasma membrane | 73/2311 | 284/18723 | 4.95e-10 | 6.73e-08 | 73 |
| GO:19907788 | Cervix | CC | protein localization to cell periphery | 78/2311 | 333/18723 | 1.22e-08 | 9.73e-07 | 78 |
| GO:005122210 | Cervix | CC | positive regulation of protein transport | 72/2311 | 303/18723 | 2.36e-08 | 1.70e-06 | 72 |
| GO:190495110 | Cervix | CC | positive regulation of establishment of protein localization | 73/2311 | 319/18723 | 9.69e-08 | 5.25e-06 | 73 |
| GO:19043779 | Cervix | CC | positive regulation of protein localization to cell periphery | 24/2311 | 69/18723 | 1.21e-06 | 4.15e-05 | 24 |
| GO:00315328 | Cervix | CC | actin cytoskeleton reorganization | 31/2311 | 107/18723 | 3.34e-06 | 8.99e-05 | 31 |
| GO:19030788 | Cervix | CC | positive regulation of protein localization to plasma membrane | 21/2311 | 62/18723 | 8.91e-06 | 2.03e-04 | 21 |
| GO:19054778 | Cervix | CC | positive regulation of protein localization to membrane | 29/2311 | 106/18723 | 2.29e-05 | 4.01e-04 | 29 |
| GO:00988767 | Cervix | CC | vesicle-mediated transport to the plasma membrane | 34/2311 | 136/18723 | 3.75e-05 | 5.91e-04 | 34 |
| GO:00068927 | Cervix | CC | post-Golgi vesicle-mediated transport | 28/2311 | 104/18723 | 4.31e-05 | 6.61e-04 | 28 |
| GO:00431228 | Cervix | CC | regulation of I-kappaB kinase/NF-kappaB signaling | 53/2311 | 249/18723 | 4.50e-05 | 6.87e-04 | 53 |
| GO:00901509 | Cervix | CC | establishment of protein localization to membrane | 54/2311 | 260/18723 | 7.67e-05 | 1.05e-03 | 54 |
| GO:19030768 | Cervix | CC | regulation of protein localization to plasma membrane | 27/2311 | 104/18723 | 1.15e-04 | 1.44e-03 | 27 |
| GO:00072497 | Cervix | CC | I-kappaB kinase/NF-kappaB signaling | 56/2311 | 281/18723 | 1.81e-04 | 2.12e-03 | 56 |
| GO:00481938 | Cervix | CC | Golgi vesicle transport | 58/2311 | 296/18723 | 2.24e-04 | 2.54e-03 | 58 |
| GO:19043758 | Cervix | CC | regulation of protein localization to cell periphery | 30/2311 | 125/18723 | 2.28e-04 | 2.56e-03 | 30 |
| GO:19054758 | Cervix | CC | regulation of protein localization to membrane | 36/2311 | 175/18723 | 1.33e-03 | 1.05e-02 | 36 |
| GO:00068936 | Cervix | CC | Golgi to plasma membrane transport | 16/2311 | 60/18723 | 2.00e-03 | 1.46e-02 | 16 |
| Hugo Symbol | Variant Class | Variant Classification | dbSNP RS | HGVSc | HGVSp | HGVSp Short | SWISSPROT | BIOTYPE | SIFT | PolyPhen | Tumor Sample Barcode | Tissue | Histology | Sex | Age | Stage | Therapy Types | Drugs | Outcome |
| ATP2C1 | SNV | Missense_Mutation | | c.514N>C | p.Glu172Gln | p.E172Q | P98194 | protein_coding | tolerated(0.17) | benign(0.037) | TCGA-A1-A0SI-01 | Breast | breast invasive carcinoma | Female | <65 | I/II | Unknown | Unknown | SD |
| ATP2C1 | SNV | Missense_Mutation | | c.2170N>A | p.Glu724Lys | p.E724K | P98194 | protein_coding | deleterious(0.02) | probably_damaging(0.995) | TCGA-AN-A046-01 | Breast | breast invasive carcinoma | Female | >=65 | I/II | Unknown | Unknown | SD |
| ATP2C1 | SNV | Missense_Mutation | | c.359N>C | p.Leu120Pro | p.L120P | P98194 | protein_coding | deleterious(0) | probably_damaging(1) | TCGA-AO-A128-01 | Breast | breast invasive carcinoma | Female | <65 | I/II | Chemotherapy | doxorubicin | SD |
| ATP2C1 | SNV | Missense_Mutation | | c.1271G>C | p.Gly424Ala | p.G424A | P98194 | protein_coding | tolerated(0.3) | benign(0.406) | TCGA-AR-A24Q-01 | Breast | breast invasive carcinoma | Female | <65 | I/II | Chemotherapy | doxorubicin | SD |
| ATP2C1 | SNV | Missense_Mutation | | c.1339N>C | p.Asp447His | p.D447H | P98194 | protein_coding | deleterious(0.01) | possibly_damaging(0.81) | TCGA-D8-A1JA-01 | Breast | breast invasive carcinoma | Female | <65 | III/IV | Chemotherapy | adriamycin | PD |
| ATP2C1 | SNV | Missense_Mutation | rs145949576 | c.1994C>T | p.Ser665Leu | p.S665L | P98194 | protein_coding | deleterious(0) | possibly_damaging(0.611) | TCGA-EW-A6SA-01 | Breast | breast invasive carcinoma | Male | <65 | I/II | Unknown | Unknown | SD |
| ATP2C1 | insertion | Nonsense_Mutation | novel | c.195_196insTAGAATAAT | p.Val65_Ser66insTer | p.V65_S66ins* | P98194 | protein_coding | | | TCGA-A7-A26I-01 | Breast | breast invasive carcinoma | Female | >=65 | I/II | Chemotherapy | cytoxan | SD |
| ATP2C1 | deletion | Frame_Shift_Del | | c.685delT | p.Cys229ValfsTer4 | p.C229Vfs*4 | P98194 | protein_coding | | | TCGA-A8-A09Z-01 | Breast | breast invasive carcinoma | Female | >=65 | I/II | Unknown | Unknown | SD |
| ATP2C1 | deletion | Frame_Shift_Del | | c.340delN | p.Asn115IlefsTer16 | p.N115Ifs*16 | P98194 | protein_coding | | | TCGA-D8-A27V-01 | Breast | breast invasive carcinoma | Female | <65 | I/II | Hormone Therapy | tamoxiphen | SD |
| ATP2C1 | SNV | Missense_Mutation | novel | c.2336C>T | p.Pro779Leu | p.P779L | P98194 | protein_coding | deleterious(0) | probably_damaging(1) | TCGA-2W-A8YY-01 | Cervix | cervical & endocervical cancer | Female | <65 | I/II | Chemotherapy | cisplatin | CR |
| Entrez ID | Symbol | Category | Interaction Types | Drug Claim Name | Drug Name | PMIDs |
| 27032 | ATP2C1 | ENZYME, TRANSPORTER, DRUGGABLE GENOME | | ENFLURANE | ENFLURANE | |
| 27032 | ATP2C1 | ENZYME, TRANSPORTER, DRUGGABLE GENOME | | ISOFLURANE | ISOFLURANE | |
| 27032 | ATP2C1 | ENZYME, TRANSPORTER, DRUGGABLE GENOME | | SEVOFLURANE | SEVOFLURANE | |
| 27032 | ATP2C1 | ENZYME, TRANSPORTER, DRUGGABLE GENOME | | ISOFLURANE | ISOFLURANE | |
| 27032 | ATP2C1 | ENZYME, TRANSPORTER, DRUGGABLE GENOME | | ENFLURANE | ENFLURANE | |
| 27032 | ATP2C1 | ENZYME, TRANSPORTER, DRUGGABLE GENOME | | SEVOFLURANE | SEVOFLURANE | |
| 27032 | ATP2C1 | ENZYME, TRANSPORTER, DRUGGABLE GENOME | | DESFLURANE | DESFLURANE | |
| 27032 | ATP2C1 | ENZYME, TRANSPORTER, DRUGGABLE GENOME | | DESFLURANE | DESFLURANE | |


