| Tissue | Expression Dynamics | Abbreviation |
| Colorectum (GSE201348) |  | FAP: Familial adenomatous polyposis |
| CRC: Colorectal cancer |
| Colorectum (HTA11) |  | AD: Adenomas |
| SER: Sessile serrated lesions |
| MSI-H: Microsatellite-high colorectal cancer |
| MSS: Microsatellite stable colorectal cancer |
| Esophagus | 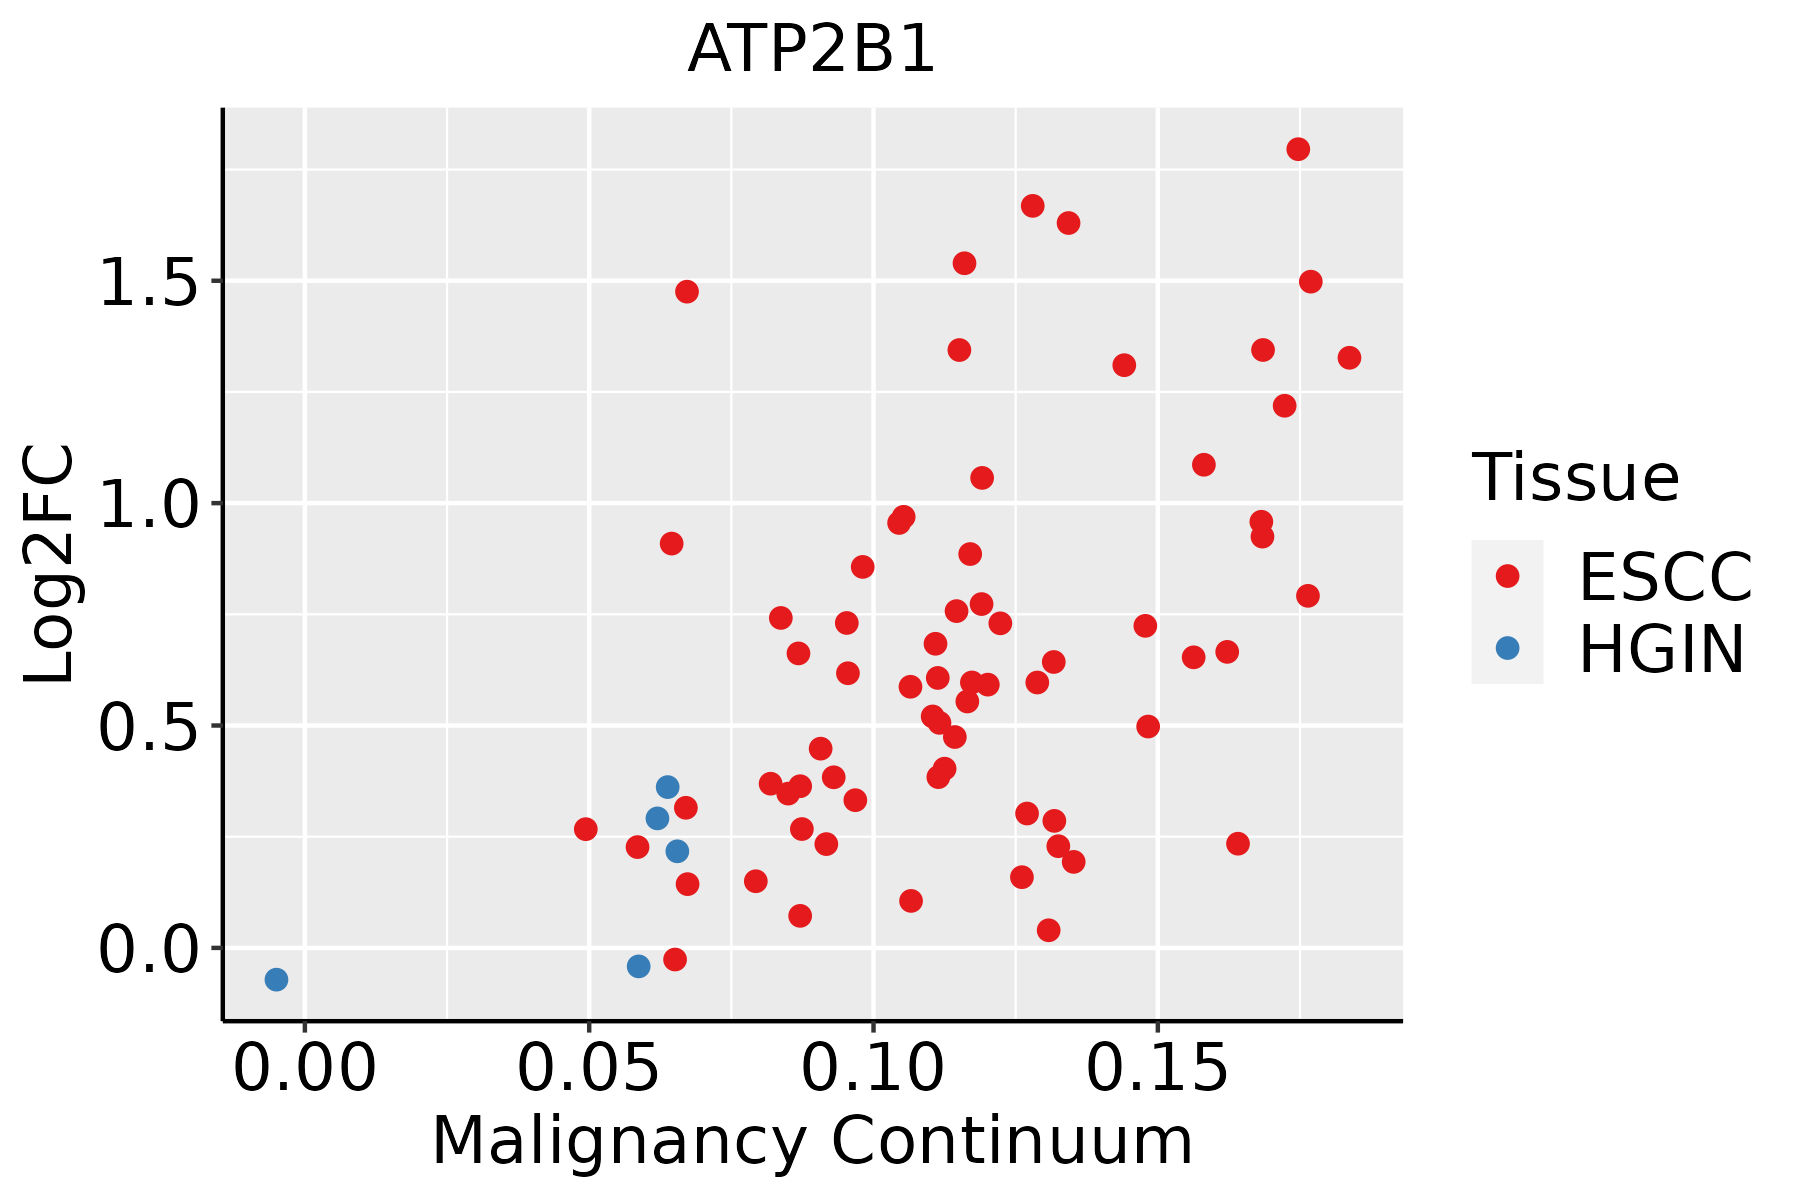 | ESCC: Esophageal squamous cell carcinoma |
| HGIN: High-grade intraepithelial neoplasias |
| LGIN: Low-grade intraepithelial neoplasias |
| GC | 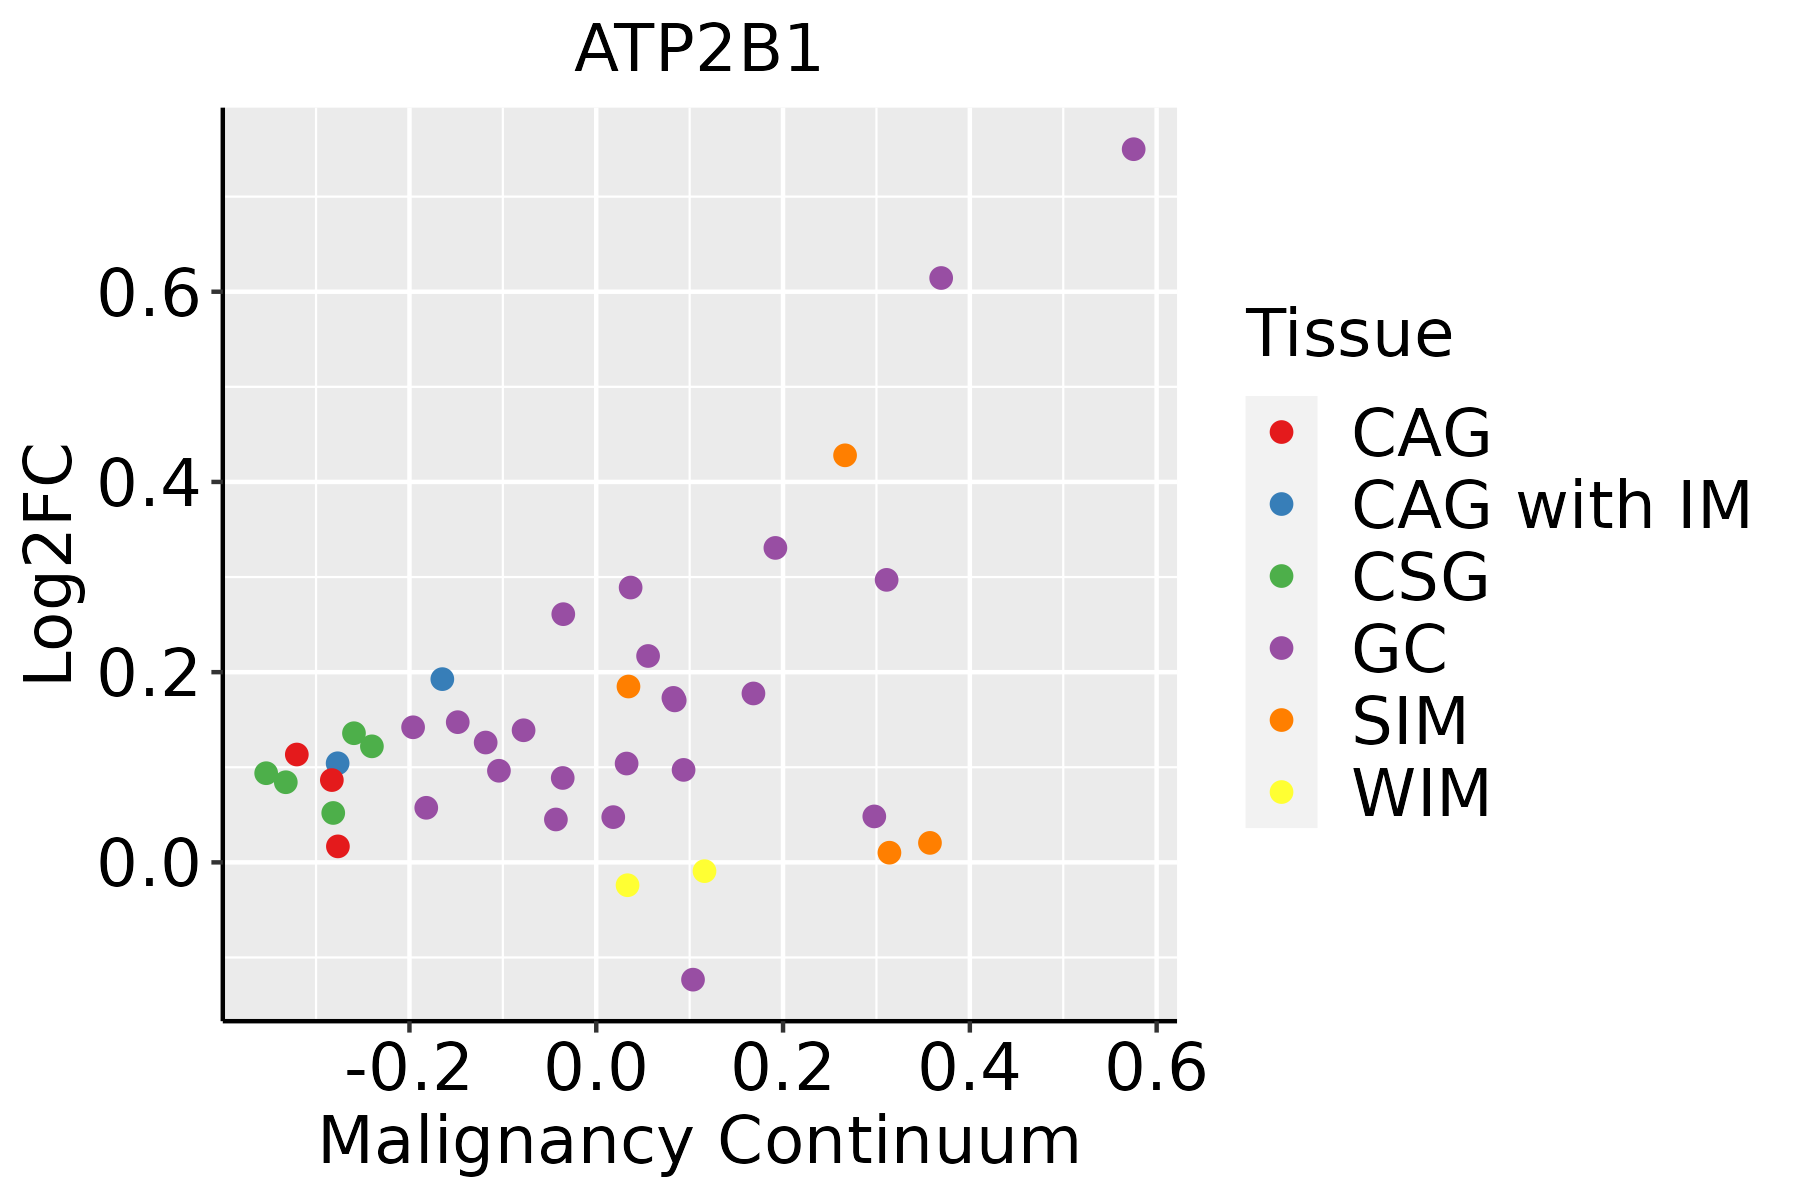 | CAG: Chronic atrophic gastritis |
| CAG with IM: Chronic atrophic gastritis with intestinal metaplasia |
| CSG: Chronic superficial gastritis |
| GC: Gastric cancer |
| SIM: Severe intestinal metaplasia |
| WIM: Wild intestinal metaplasia |
| Liver | 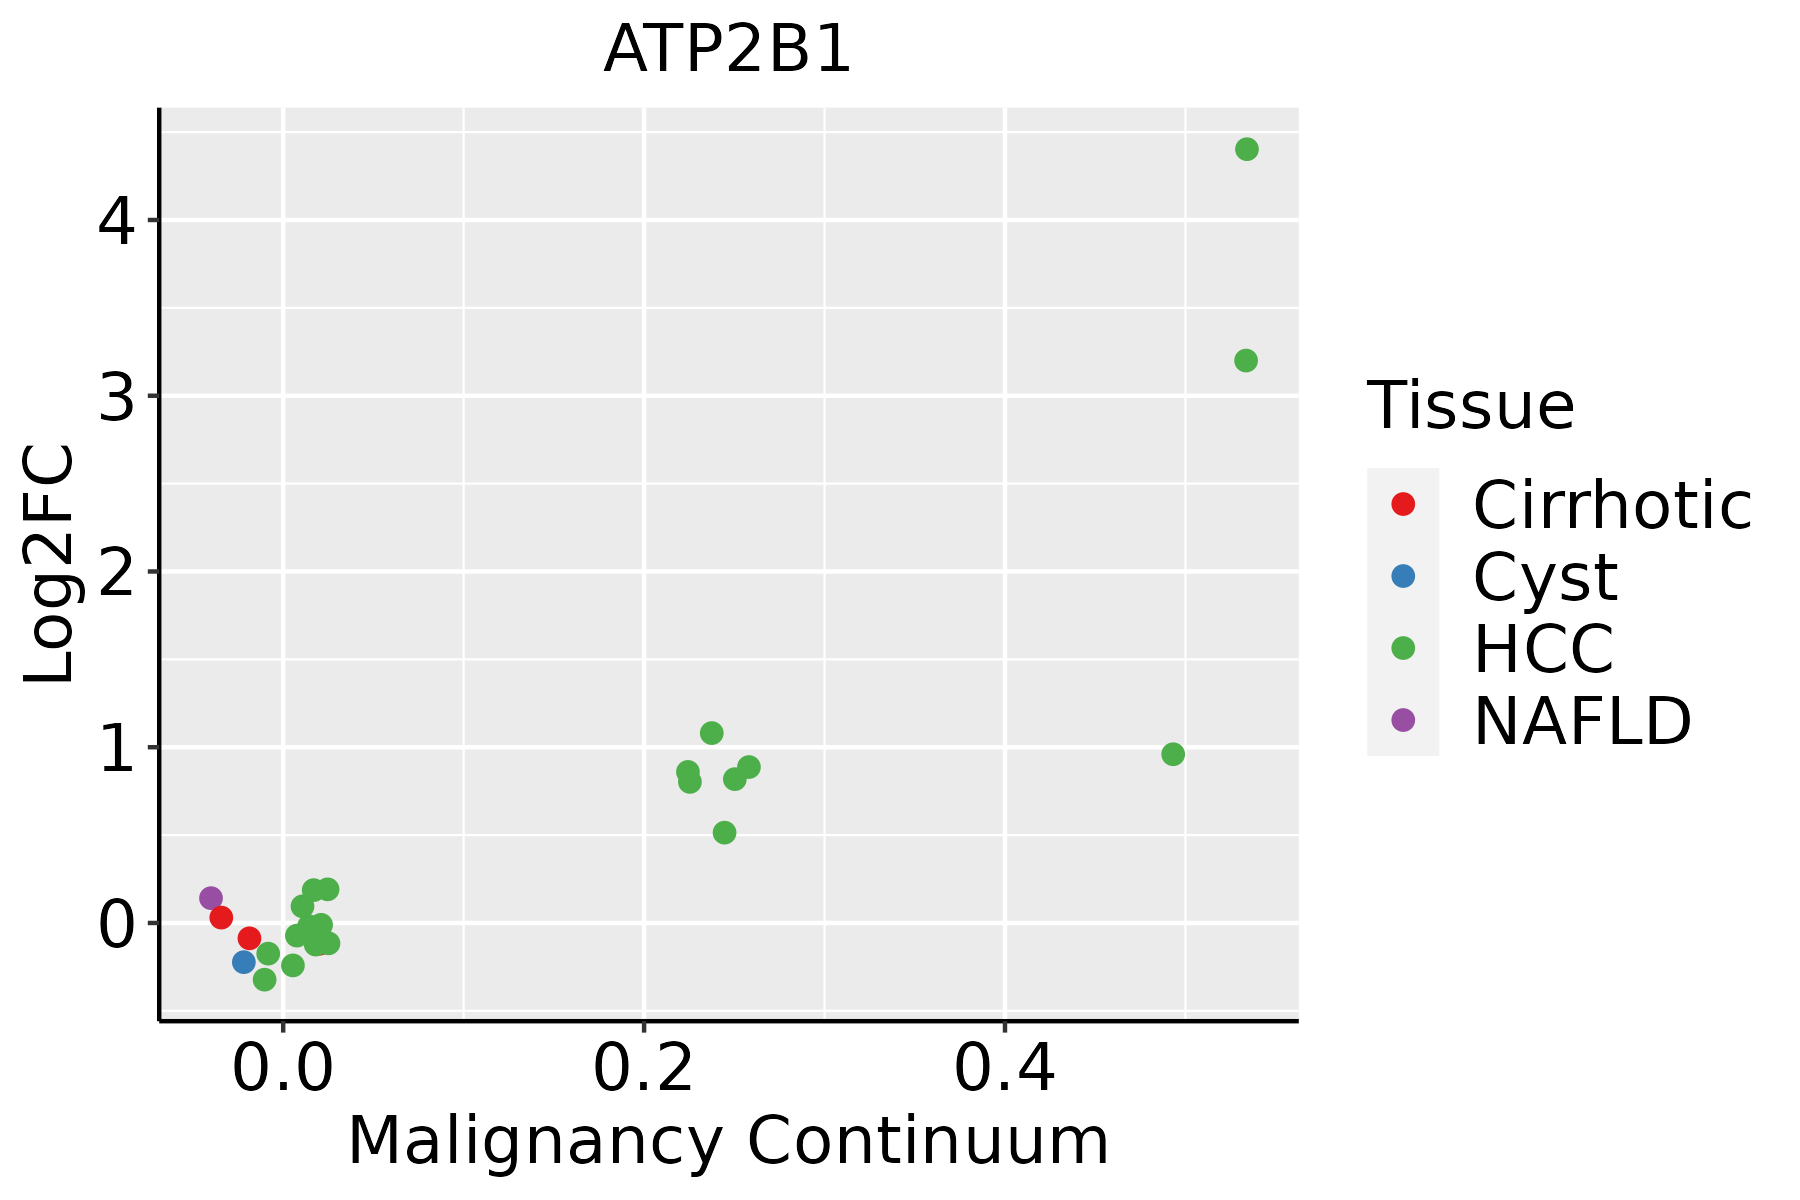 | HCC: Hepatocellular carcinoma |
| NAFLD: Non-alcoholic fatty liver disease |
| Oral Cavity | 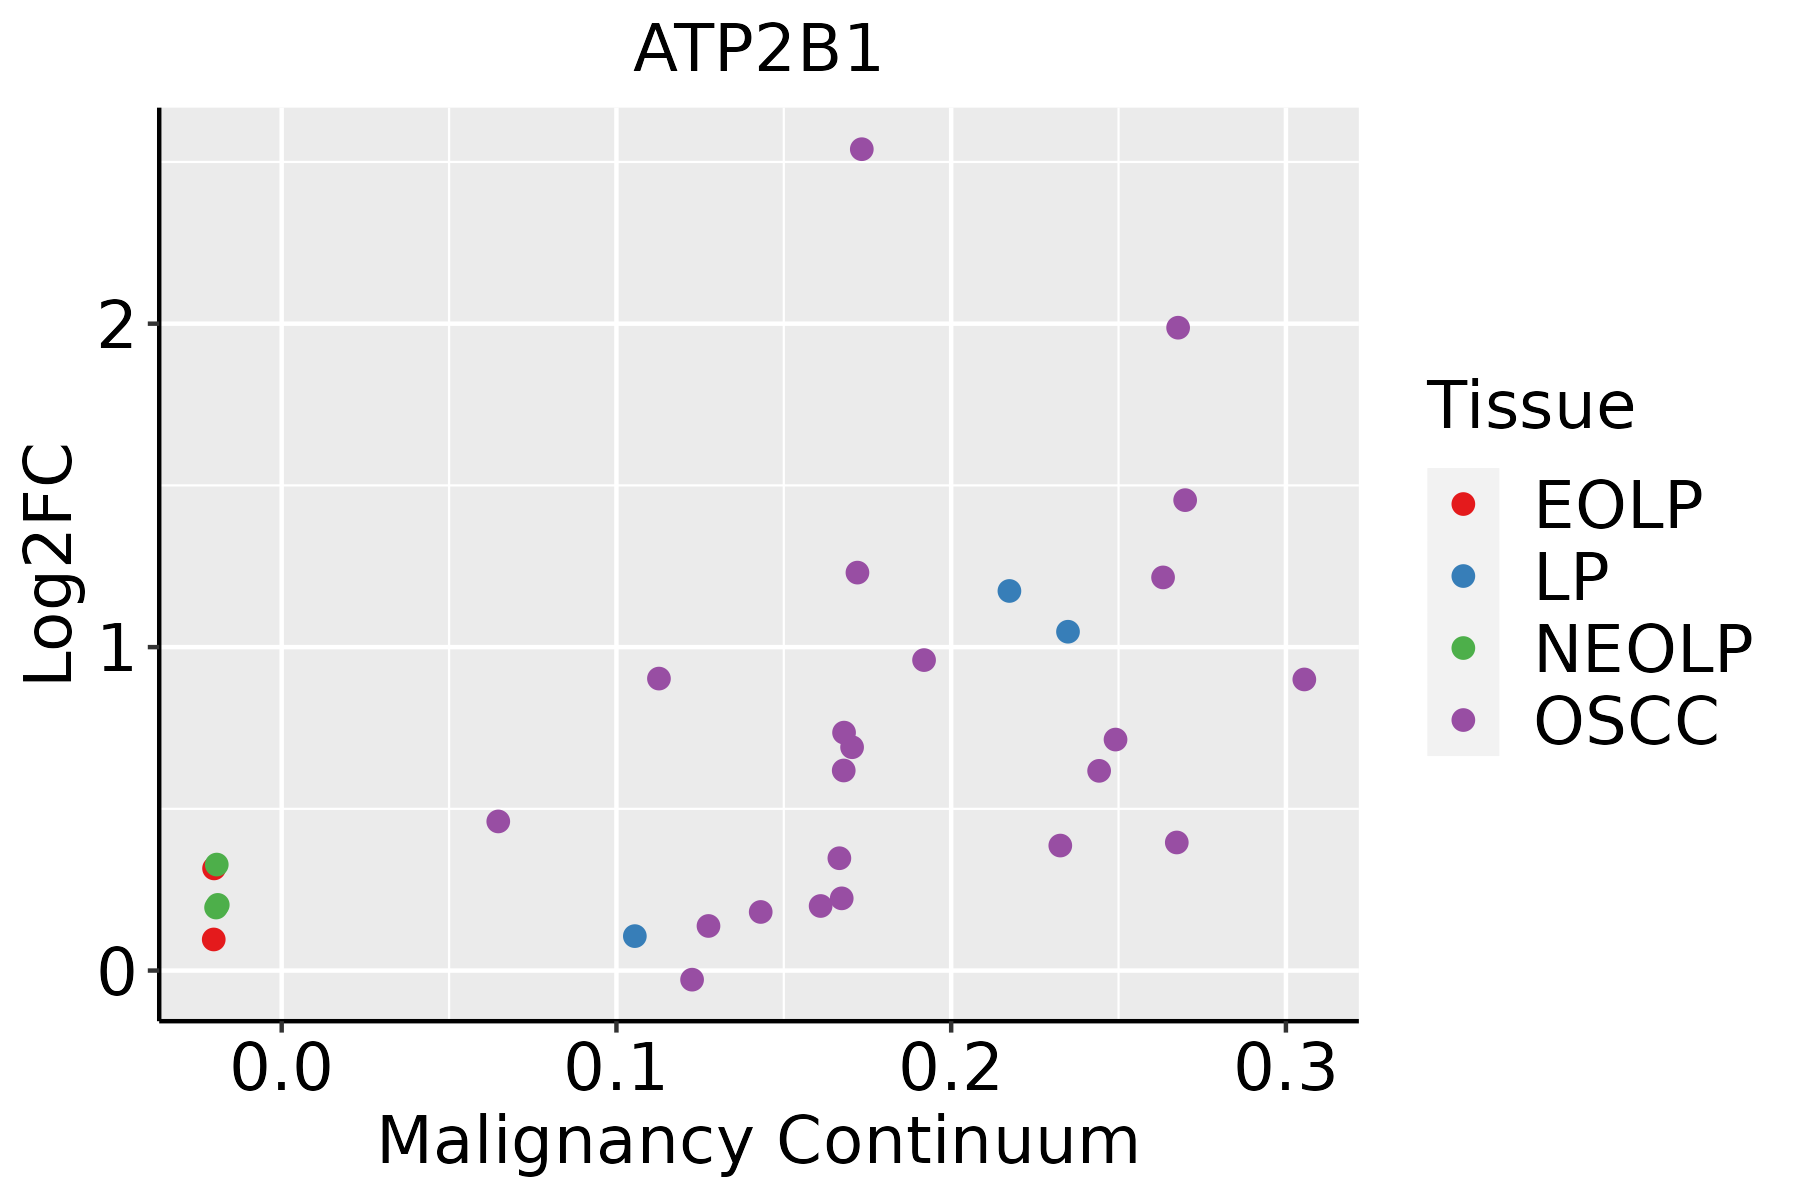 | EOLP: Erosive Oral lichen planus |
| LP: leukoplakia |
| NEOLP: Non-erosive oral lichen planus |
| OSCC: Oral squamous cell carcinoma |
| Prostate | 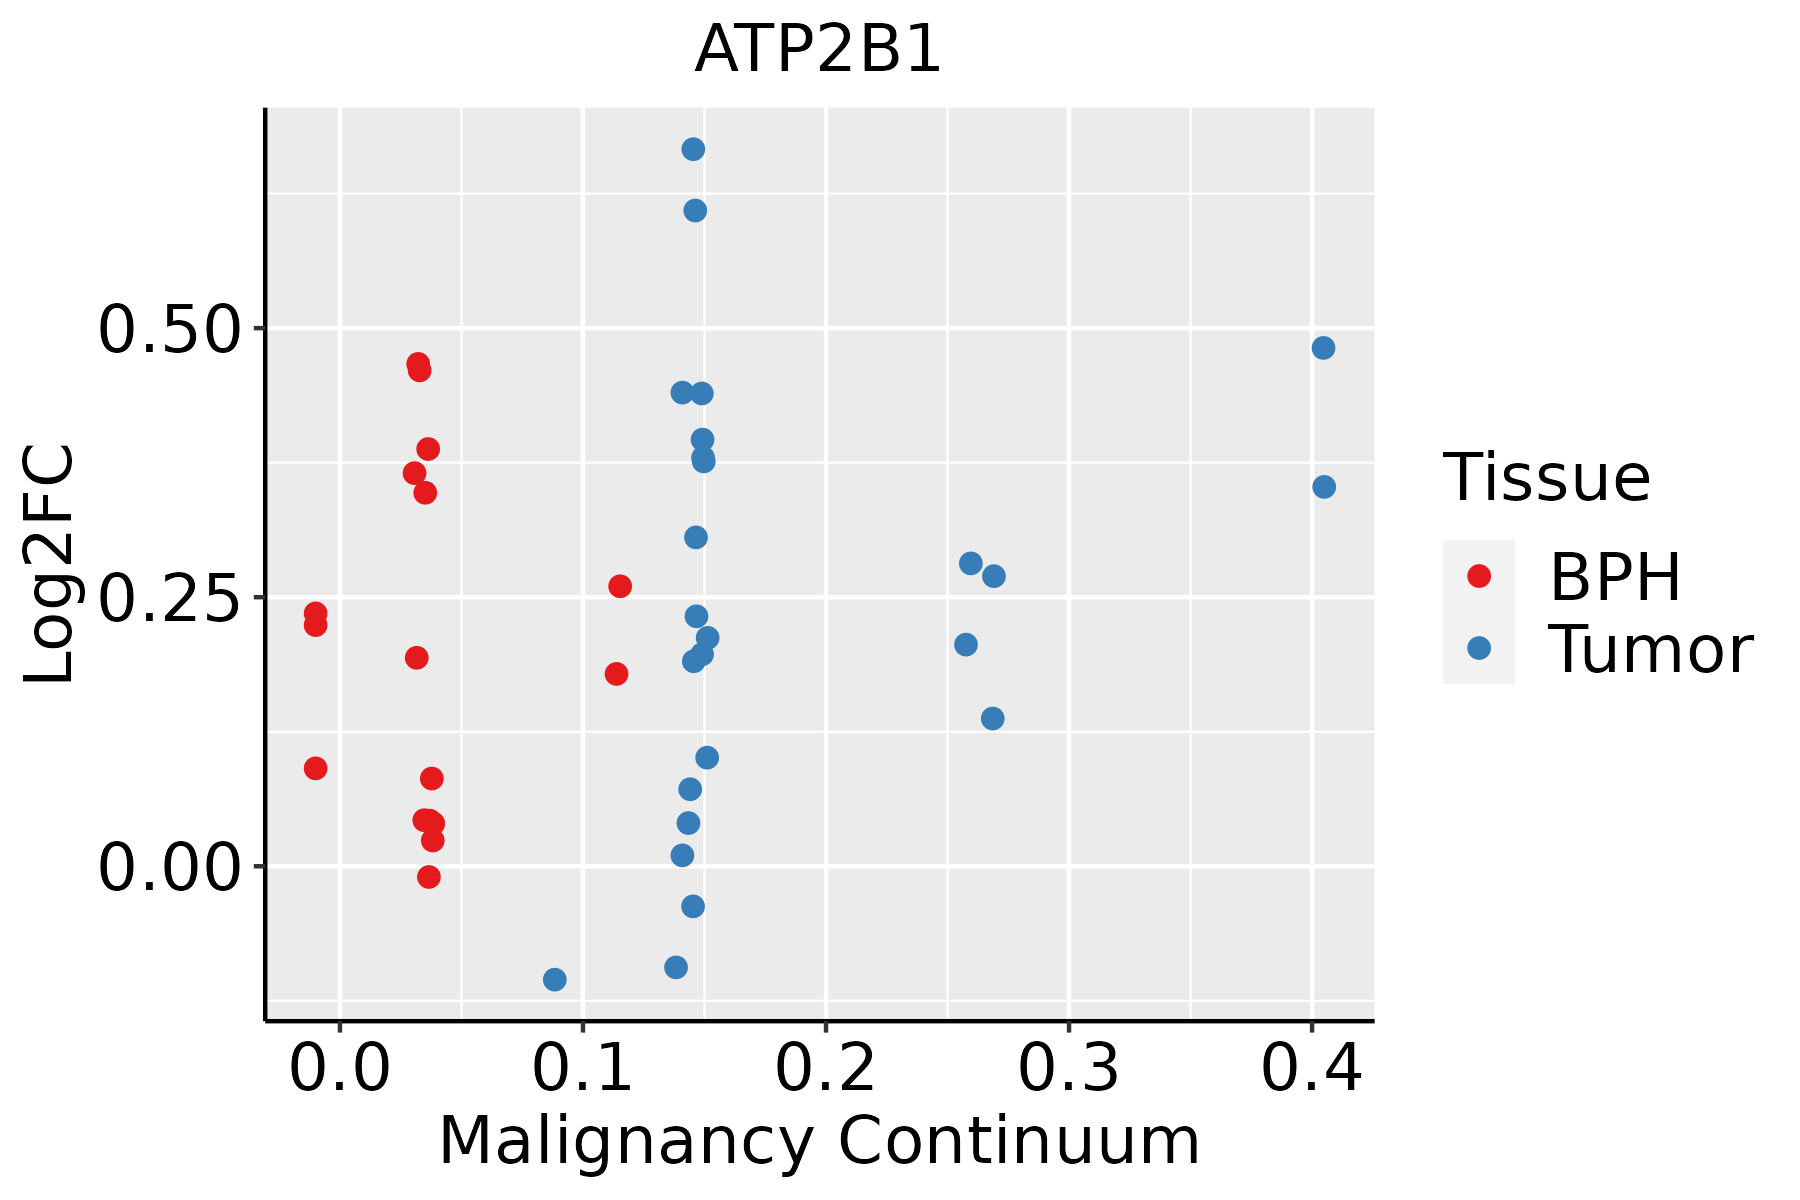 | BPH: Benign Prostatic Hyperplasia |
| Skin |  | AK: Actinic keratosis |
| cSCC: Cutaneous squamous cell carcinoma |
| SCCIS:squamous cell carcinoma in situ |
| Thyroid | 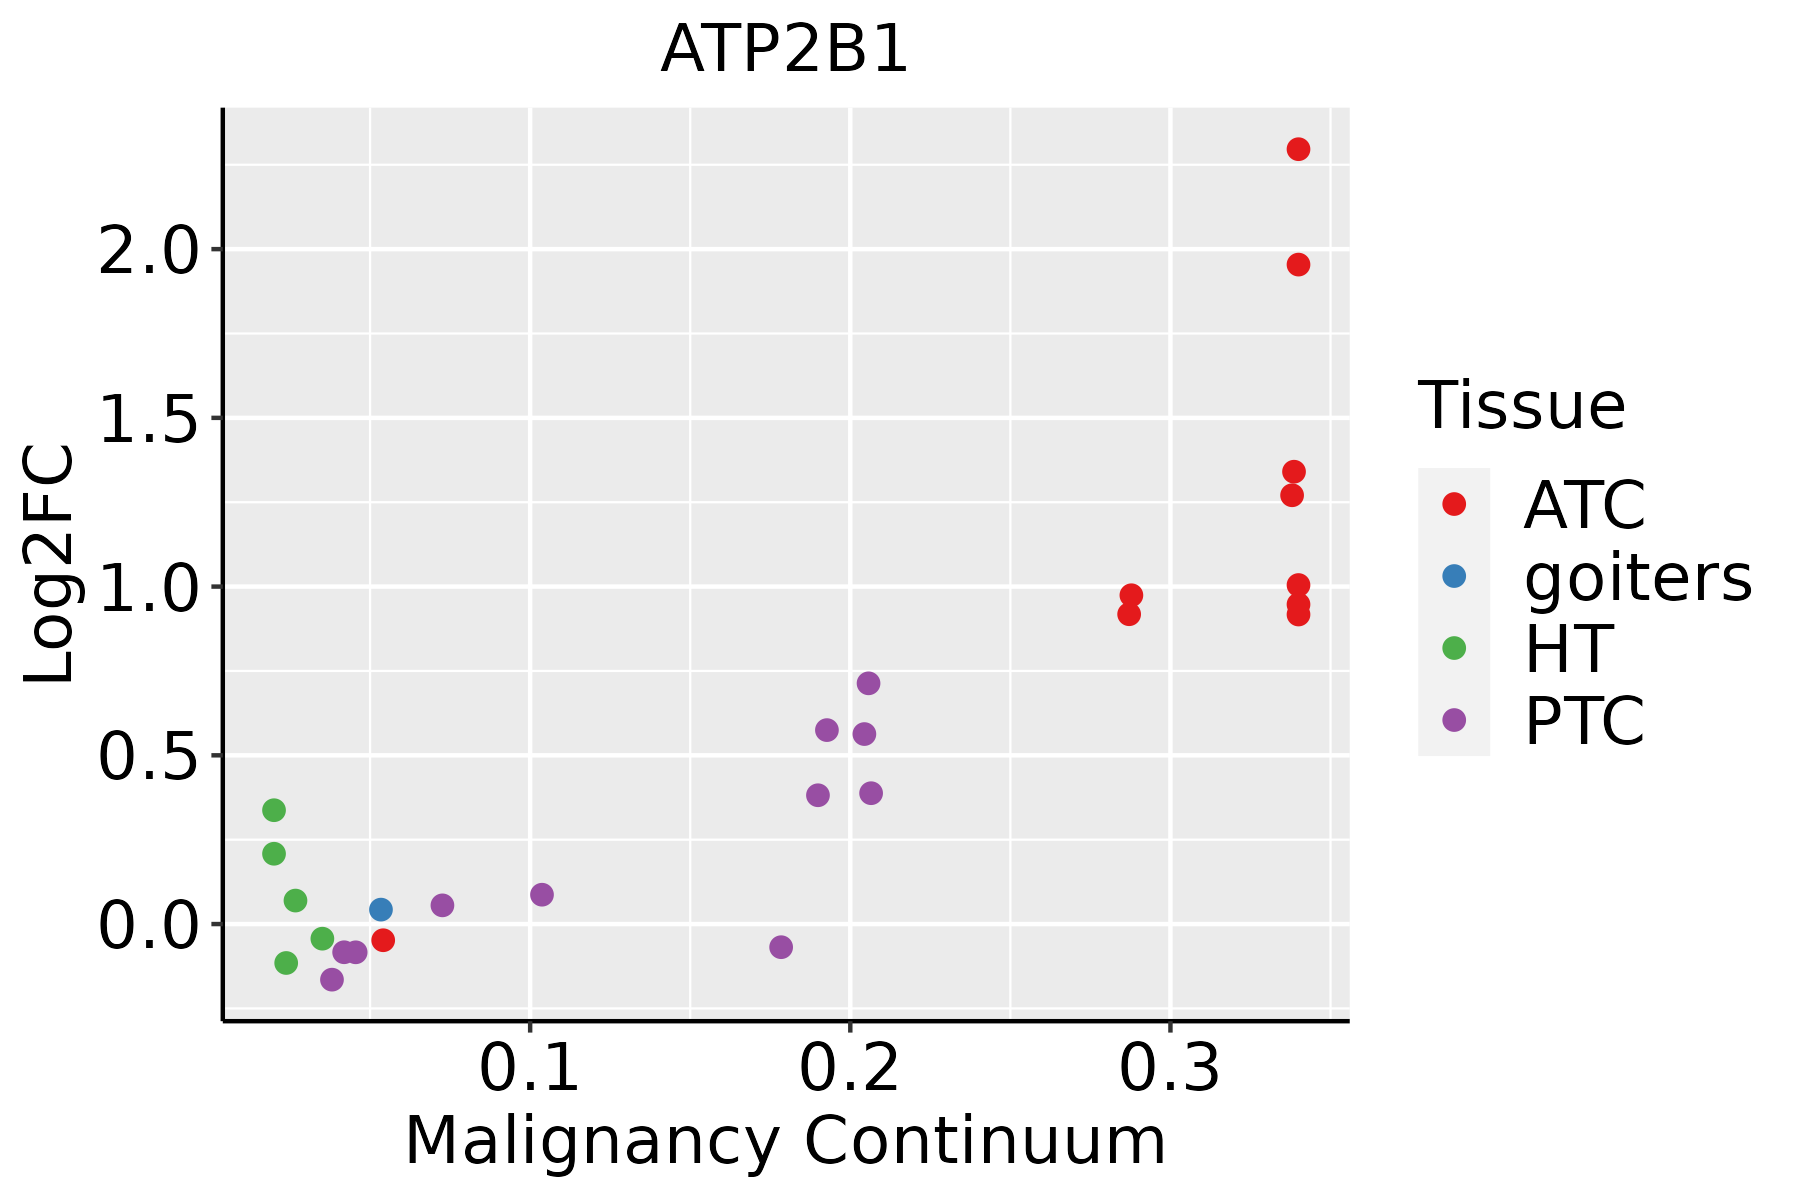 | ATC: Anaplastic thyroid cancer |
| HT: Hashimoto's thyroiditis |
| PTC: Papillary thyroid cancer |
| GO ID | Tissue | Disease Stage | Description | Gene Ratio | Bg Ratio | pvalue | p.adjust | Count |
| GO:0032868 | Colorectum | AD | response to insulin | 91/3918 | 264/18723 | 2.02e-07 | 8.48e-06 | 91 |
| GO:0071383 | Colorectum | AD | cellular response to steroid hormone stimulus | 73/3918 | 204/18723 | 6.31e-07 | 2.24e-05 | 73 |
| GO:1901653 | Colorectum | AD | cellular response to peptide | 114/3918 | 359/18723 | 8.32e-07 | 2.88e-05 | 114 |
| GO:0032869 | Colorectum | AD | cellular response to insulin stimulus | 72/3918 | 203/18723 | 1.10e-06 | 3.68e-05 | 72 |
| GO:0071375 | Colorectum | AD | cellular response to peptide hormone stimulus | 95/3918 | 290/18723 | 1.50e-06 | 4.66e-05 | 95 |
| GO:0043434 | Colorectum | AD | response to peptide hormone | 126/3918 | 414/18723 | 2.70e-06 | 7.86e-05 | 126 |
| GO:0031667 | Colorectum | AD | response to nutrient levels | 138/3918 | 474/18723 | 1.22e-05 | 2.68e-04 | 138 |
| GO:0048545 | Colorectum | AD | response to steroid hormone | 104/3918 | 339/18723 | 1.33e-05 | 2.90e-04 | 104 |
| GO:0060249 | Colorectum | AD | anatomical structure homeostasis | 94/3918 | 314/18723 | 9.37e-05 | 1.42e-03 | 94 |
| GO:0009409 | Colorectum | AD | response to cold | 22/3918 | 49/18723 | 1.40e-04 | 1.98e-03 | 22 |
| GO:0071496 | Colorectum | AD | cellular response to external stimulus | 94/3918 | 320/18723 | 1.98e-04 | 2.64e-03 | 94 |
| GO:0007568 | Colorectum | AD | aging | 98/3918 | 339/18723 | 2.77e-04 | 3.39e-03 | 98 |
| GO:1901654 | Colorectum | AD | response to ketone | 59/3918 | 194/18723 | 1.14e-03 | 1.04e-02 | 59 |
| GO:0090257 | Colorectum | AD | regulation of muscle system process | 73/3918 | 252/18723 | 1.46e-03 | 1.24e-02 | 73 |
| GO:0031668 | Colorectum | AD | cellular response to extracellular stimulus | 71/3918 | 246/18723 | 1.86e-03 | 1.52e-02 | 71 |
| GO:0031669 | Colorectum | AD | cellular response to nutrient levels | 63/3918 | 215/18723 | 2.19e-03 | 1.73e-02 | 63 |
| GO:0097305 | Colorectum | AD | response to alcohol | 71/3918 | 253/18723 | 4.01e-03 | 2.80e-02 | 71 |
| GO:0001503 | Colorectum | AD | ossification | 106/3918 | 408/18723 | 7.68e-03 | 4.64e-02 | 106 |
| GO:00713832 | Colorectum | MSS | cellular response to steroid hormone stimulus | 72/3467 | 204/18723 | 8.87e-09 | 5.43e-07 | 72 |
| GO:00485452 | Colorectum | MSS | response to steroid hormone | 101/3467 | 339/18723 | 2.60e-07 | 1.10e-05 | 101 |
| Pathway ID | Tissue | Disease Stage | Description | Gene Ratio | Bg Ratio | pvalue | p.adjust | qvalue | Count |
| hsa04961 | Colorectum | AD | Endocrine and other factor-regulated calcium reabsorption | 24/2092 | 53/8465 | 8.49e-04 | 5.93e-03 | 3.78e-03 | 24 |
| hsa04972 | Colorectum | AD | Pancreatic secretion | 36/2092 | 102/8465 | 1.06e-02 | 3.98e-02 | 2.54e-02 | 36 |
| hsa049611 | Colorectum | AD | Endocrine and other factor-regulated calcium reabsorption | 24/2092 | 53/8465 | 8.49e-04 | 5.93e-03 | 3.78e-03 | 24 |
| hsa049721 | Colorectum | AD | Pancreatic secretion | 36/2092 | 102/8465 | 1.06e-02 | 3.98e-02 | 2.54e-02 | 36 |
| hsa049614 | Colorectum | MSS | Endocrine and other factor-regulated calcium reabsorption | 24/1875 | 53/8465 | 1.49e-04 | 1.24e-03 | 7.61e-04 | 24 |
| hsa049724 | Colorectum | MSS | Pancreatic secretion | 33/1875 | 102/8465 | 1.09e-02 | 3.75e-02 | 2.30e-02 | 33 |
| hsa049615 | Colorectum | MSS | Endocrine and other factor-regulated calcium reabsorption | 24/1875 | 53/8465 | 1.49e-04 | 1.24e-03 | 7.61e-04 | 24 |
| hsa049725 | Colorectum | MSS | Pancreatic secretion | 33/1875 | 102/8465 | 1.09e-02 | 3.75e-02 | 2.30e-02 | 33 |
| hsa049726 | Colorectum | FAP | Pancreatic secretion | 34/1404 | 102/8465 | 2.43e-05 | 2.78e-04 | 1.69e-04 | 34 |
| hsa049616 | Colorectum | FAP | Endocrine and other factor-regulated calcium reabsorption | 18/1404 | 53/8465 | 1.52e-03 | 7.94e-03 | 4.83e-03 | 18 |
| hsa040222 | Colorectum | FAP | cGMP-PKG signaling pathway | 42/1404 | 167/8465 | 2.84e-03 | 1.27e-02 | 7.70e-03 | 42 |
| hsa04261 | Colorectum | FAP | Adrenergic signaling in cardiomyocytes | 38/1404 | 154/8465 | 6.16e-03 | 2.34e-02 | 1.42e-02 | 38 |
| hsa04024 | Colorectum | FAP | cAMP signaling pathway | 51/1404 | 225/8465 | 1.02e-02 | 3.68e-02 | 2.24e-02 | 51 |
| hsa04970 | Colorectum | FAP | Salivary secretion | 24/1404 | 93/8465 | 1.52e-02 | 4.99e-02 | 3.03e-02 | 24 |
| hsa04925 | Colorectum | FAP | Aldosterone synthesis and secretion | 25/1404 | 98/8465 | 1.55e-02 | 4.99e-02 | 3.04e-02 | 25 |
| hsa049727 | Colorectum | FAP | Pancreatic secretion | 34/1404 | 102/8465 | 2.43e-05 | 2.78e-04 | 1.69e-04 | 34 |
| hsa049617 | Colorectum | FAP | Endocrine and other factor-regulated calcium reabsorption | 18/1404 | 53/8465 | 1.52e-03 | 7.94e-03 | 4.83e-03 | 18 |
| hsa040223 | Colorectum | FAP | cGMP-PKG signaling pathway | 42/1404 | 167/8465 | 2.84e-03 | 1.27e-02 | 7.70e-03 | 42 |
| hsa042611 | Colorectum | FAP | Adrenergic signaling in cardiomyocytes | 38/1404 | 154/8465 | 6.16e-03 | 2.34e-02 | 1.42e-02 | 38 |
| hsa040241 | Colorectum | FAP | cAMP signaling pathway | 51/1404 | 225/8465 | 1.02e-02 | 3.68e-02 | 2.24e-02 | 51 |
| Hugo Symbol | Variant Class | Variant Classification | dbSNP RS | HGVSc | HGVSp | HGVSp Short | SWISSPROT | BIOTYPE | SIFT | PolyPhen | Tumor Sample Barcode | Tissue | Histology | Sex | Age | Stage | Therapy Types | Drugs | Outcome |
| ATP2B1 | SNV | Missense_Mutation | novel | c.2065G>A | p.Glu689Lys | p.E689K | P20020 | protein_coding | deleterious(0) | probably_damaging(0.991) | TCGA-A2-A0CL-01 | Breast | breast invasive carcinoma | Female | <65 | III/IV | Chemotherapy | cytoxan | SD |
| ATP2B1 | SNV | Missense_Mutation | | c.1486N>A | p.His496Asn | p.H496N | P20020 | protein_coding | deleterious(0.03) | benign(0.201) | TCGA-A2-A0CX-01 | Breast | breast invasive carcinoma | Female | <65 | I/II | Chemotherapy | adriamycin | SD |
| ATP2B1 | SNV | Missense_Mutation | | c.763N>A | p.Asp255Asn | p.D255N | P20020 | protein_coding | tolerated(0.15) | benign(0.403) | TCGA-A2-A0SY-01 | Breast | breast invasive carcinoma | Female | <65 | III/IV | Hormone Therapy | arimidex | SD |
| ATP2B1 | SNV | Missense_Mutation | | c.2063C>A | p.Pro688His | p.P688H | P20020 | protein_coding | deleterious(0.01) | probably_damaging(0.999) | TCGA-A2-A25A-01 | Breast | breast invasive carcinoma | Female | <65 | I/II | Unspecific | Cytoxan | SD |
| ATP2B1 | SNV | Missense_Mutation | novel | c.1790N>A | p.Arg597Gln | p.R597Q | P20020 | protein_coding | deleterious(0.03) | probably_damaging(0.99) | TCGA-AN-A046-01 | Breast | breast invasive carcinoma | Female | >=65 | I/II | Unknown | Unknown | SD |
| ATP2B1 | SNV | Missense_Mutation | | c.703N>A | p.Asp235Asn | p.D235N | P20020 | protein_coding | deleterious(0.05) | probably_damaging(0.996) | TCGA-AN-A046-01 | Breast | breast invasive carcinoma | Female | >=65 | I/II | Unknown | Unknown | SD |
| ATP2B1 | SNV | Missense_Mutation | | c.3007A>G | p.Ile1003Val | p.I1003V | P20020 | protein_coding | tolerated(0.17) | benign(0.003) | TCGA-AN-A0FX-01 | Breast | breast invasive carcinoma | Female | <65 | I/II | Unknown | Unknown | SD |
| ATP2B1 | SNV | Missense_Mutation | | c.2563N>C | p.Phe855Leu | p.F855L | P20020 | protein_coding | deleterious(0.02) | probably_damaging(0.979) | TCGA-C8-A12O-01 | Breast | breast invasive carcinoma | Female | <65 | I/II | Unknown | Unknown | SD |
| ATP2B1 | SNV | Missense_Mutation | novel | c.2222G>A | p.Arg741Lys | p.R741K | P20020 | protein_coding | tolerated(0.15) | benign(0.033) | TCGA-C8-A274-01 | Breast | breast invasive carcinoma | Female | <65 | I/II | Hormone Therapy | tamoxiphen | SD |
| ATP2B1 | SNV | Missense_Mutation | novel | c.3278N>C | p.Ile1093Thr | p.I1093T | P20020 | protein_coding | deleterious(0.03) | benign(0.079) | TCGA-C8-A8HQ-01 | Breast | breast invasive carcinoma | Female | <65 | I/II | Unknown | Unknown | SD |


