| Tissue | Expression Dynamics | Abbreviation |
| Cervix | 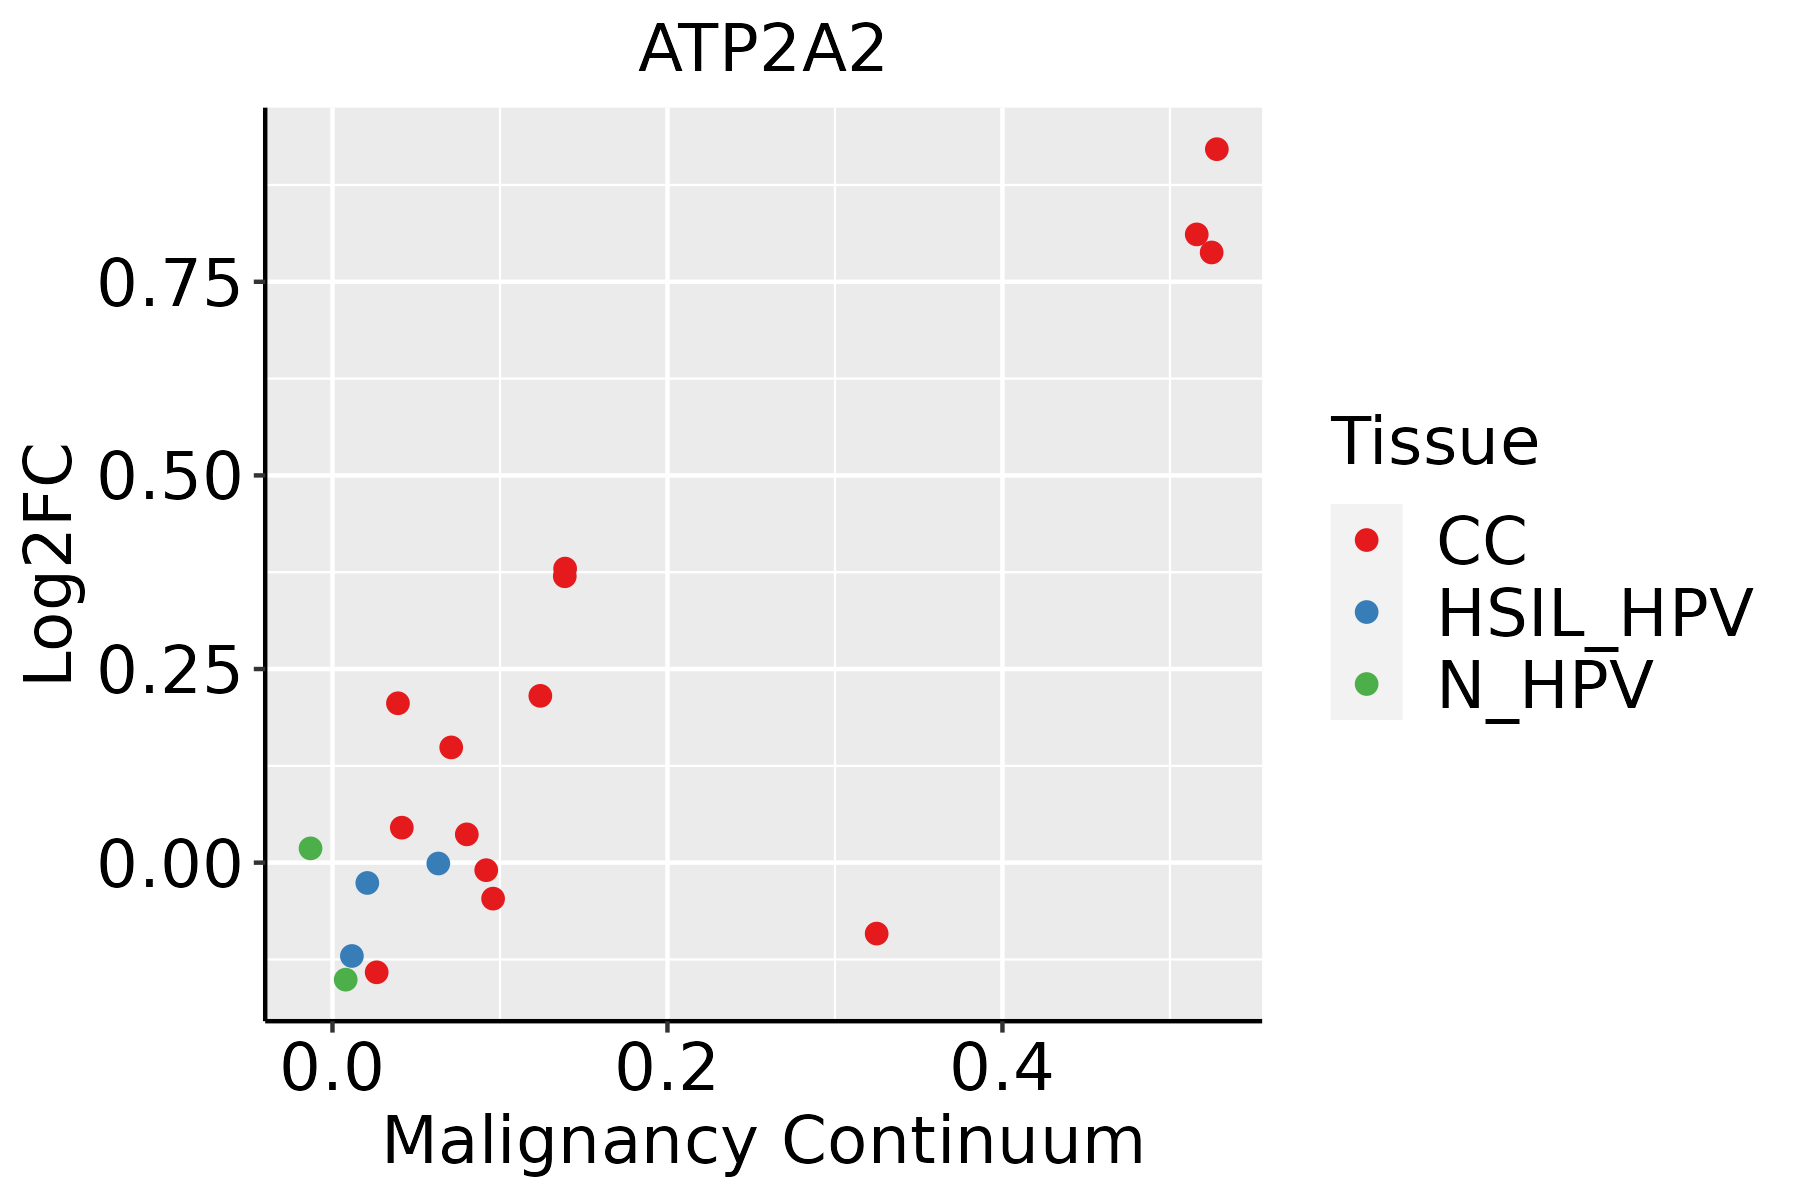 | CC: Cervix cancer |
| HSIL_HPV: HPV-infected high-grade squamous intraepithelial lesions |
| N_HPV: HPV-infected normal cervix |
| Colorectum (GSE201348) |  | FAP: Familial adenomatous polyposis |
| CRC: Colorectal cancer |
| Colorectum (HTA11) | 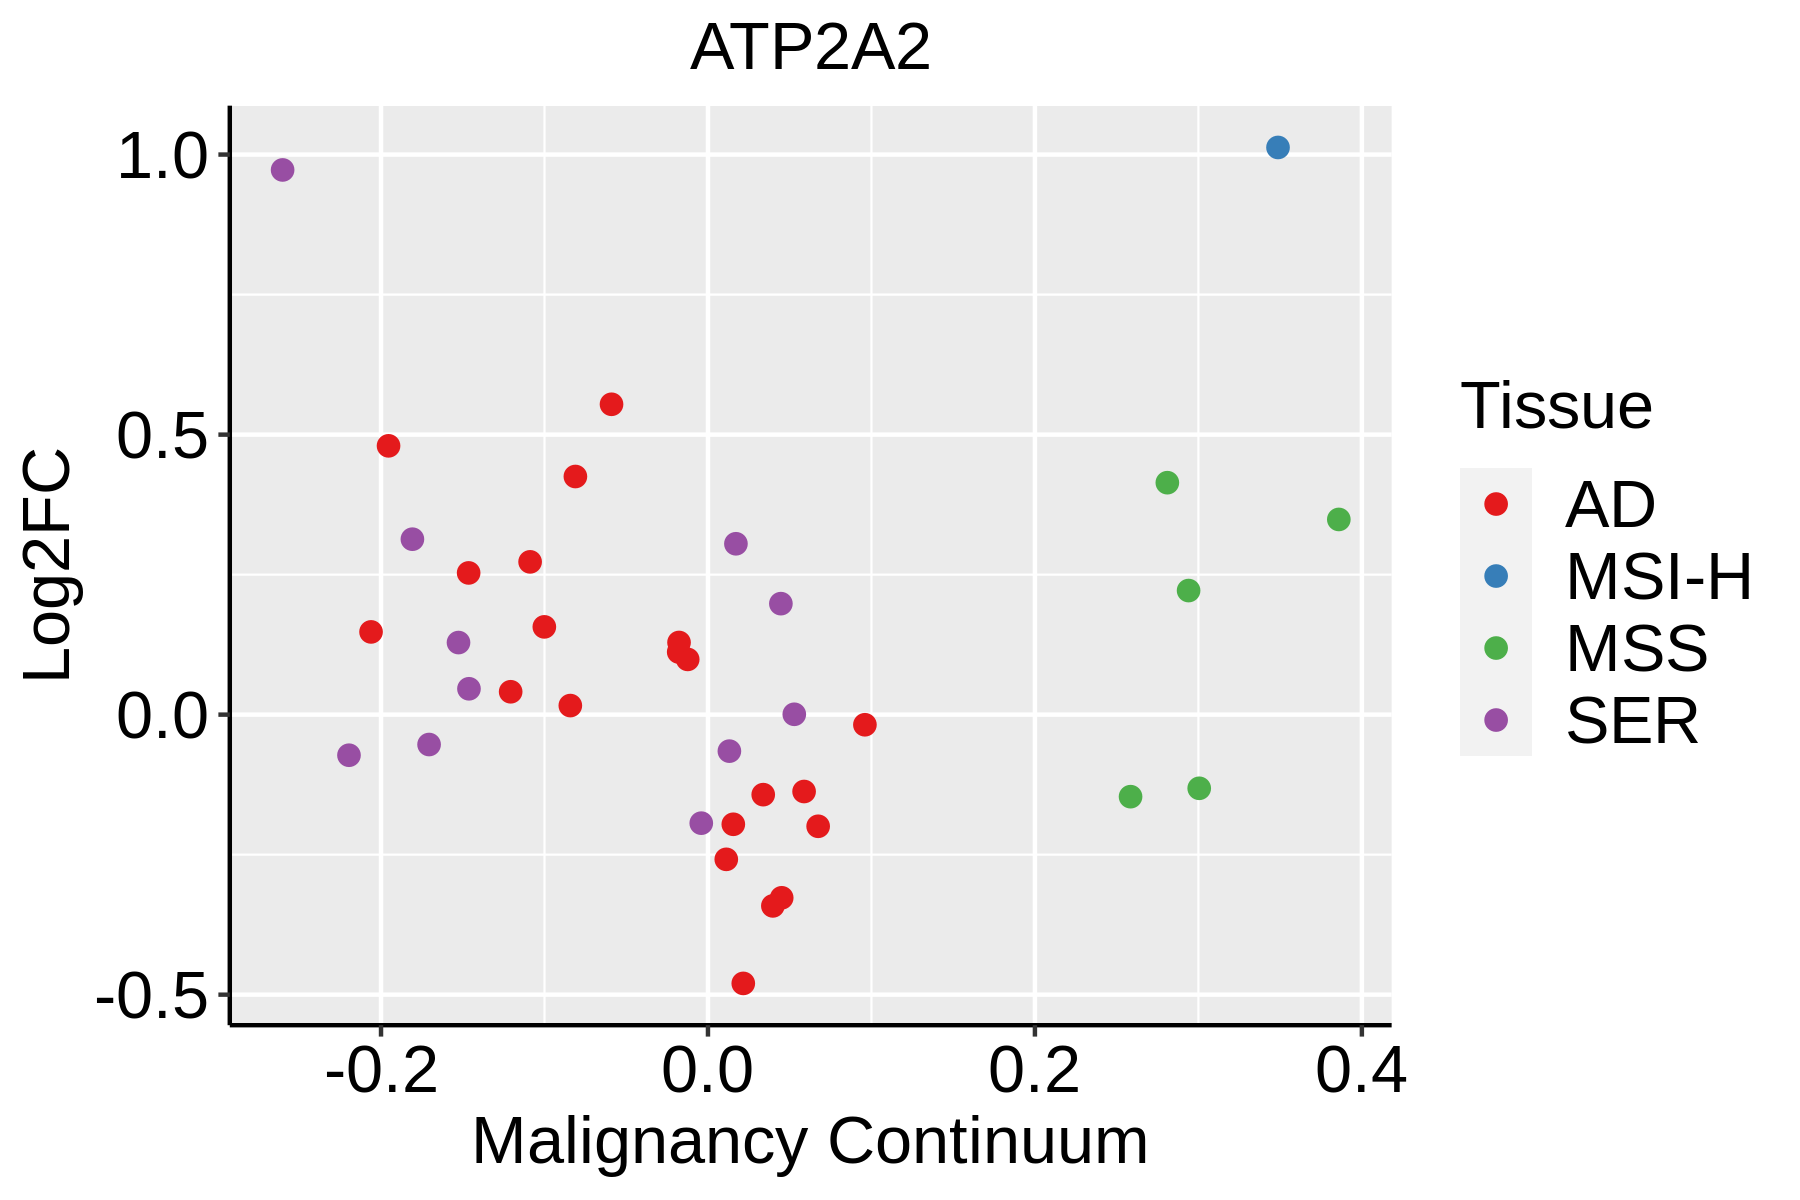 | AD: Adenomas |
| SER: Sessile serrated lesions |
| MSI-H: Microsatellite-high colorectal cancer |
| MSS: Microsatellite stable colorectal cancer |
| Endometrium | 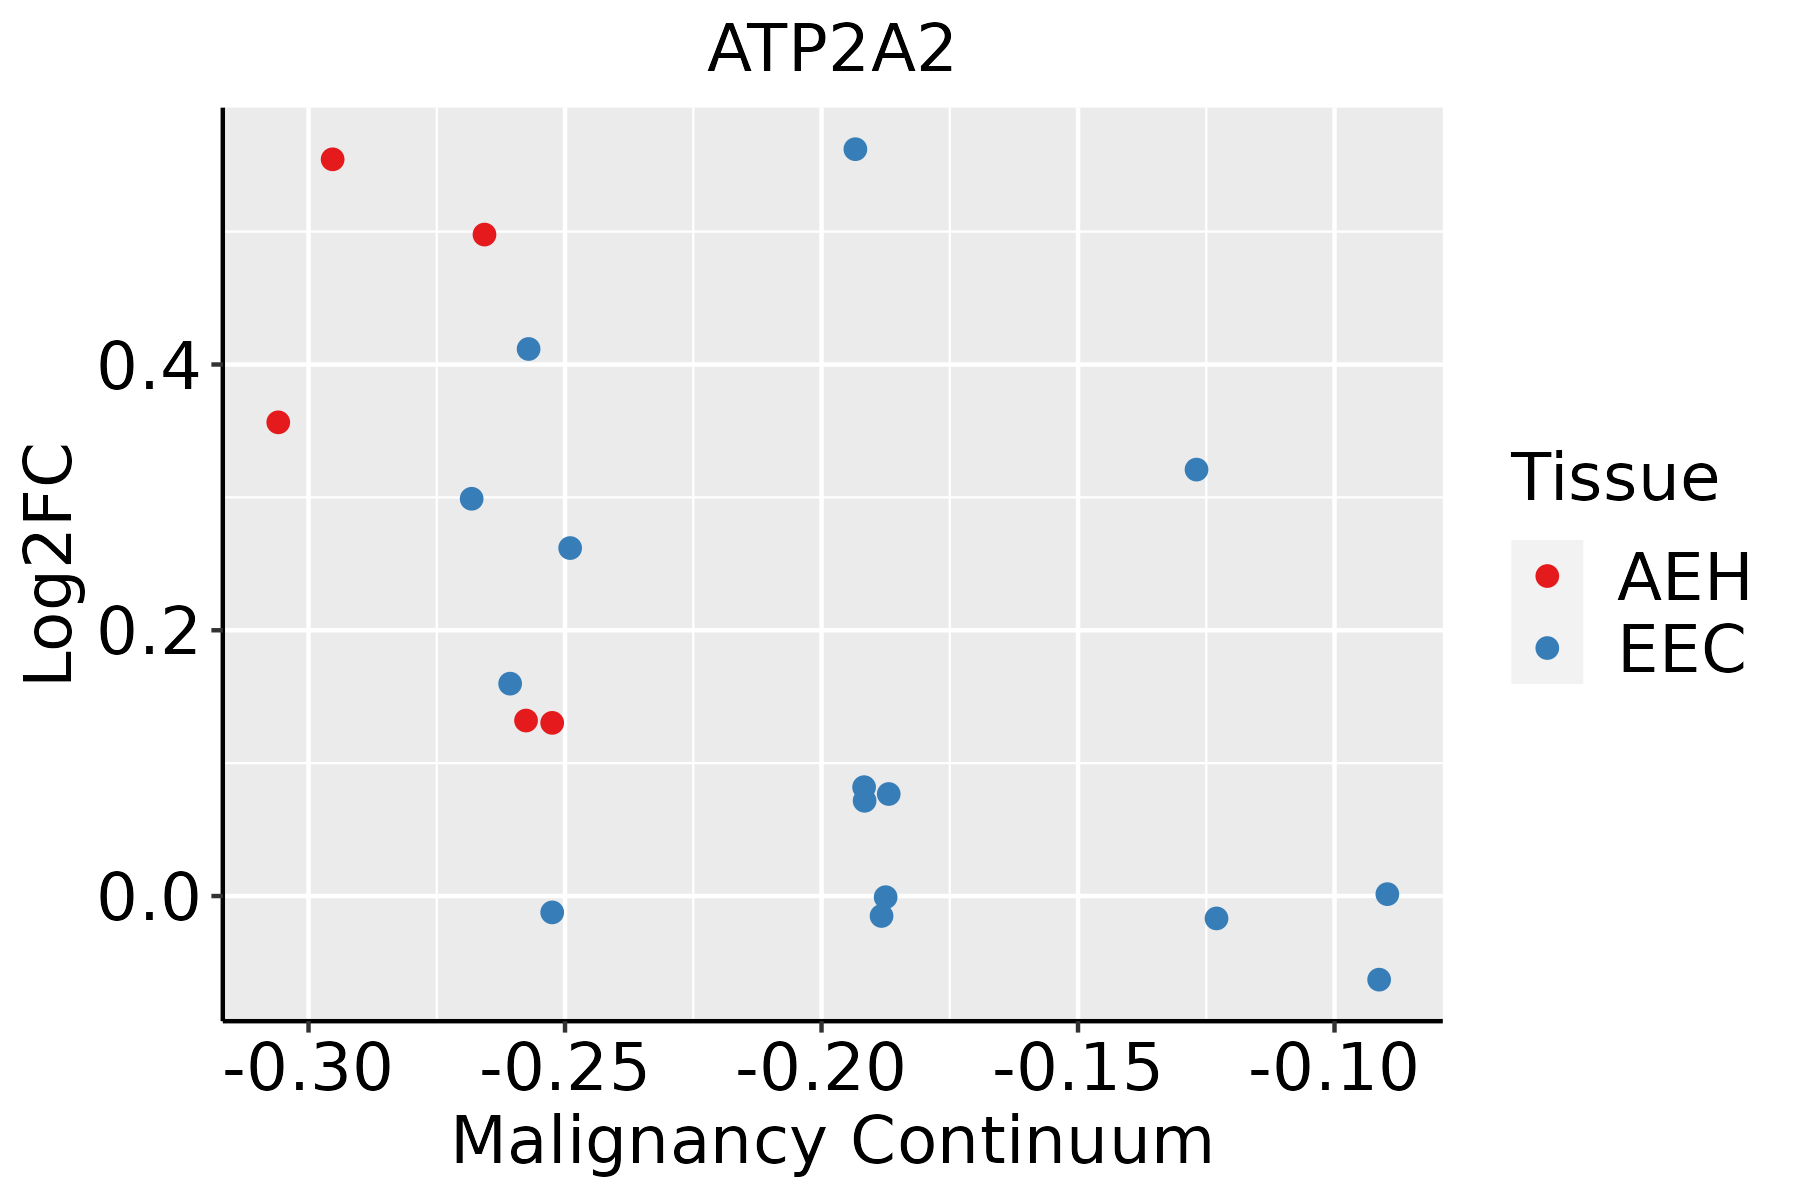 | AEH: Atypical endometrial hyperplasia |
| EEC: Endometrioid Cancer |
| Esophagus |  | ESCC: Esophageal squamous cell carcinoma |
| HGIN: High-grade intraepithelial neoplasias |
| LGIN: Low-grade intraepithelial neoplasias |
| Liver | 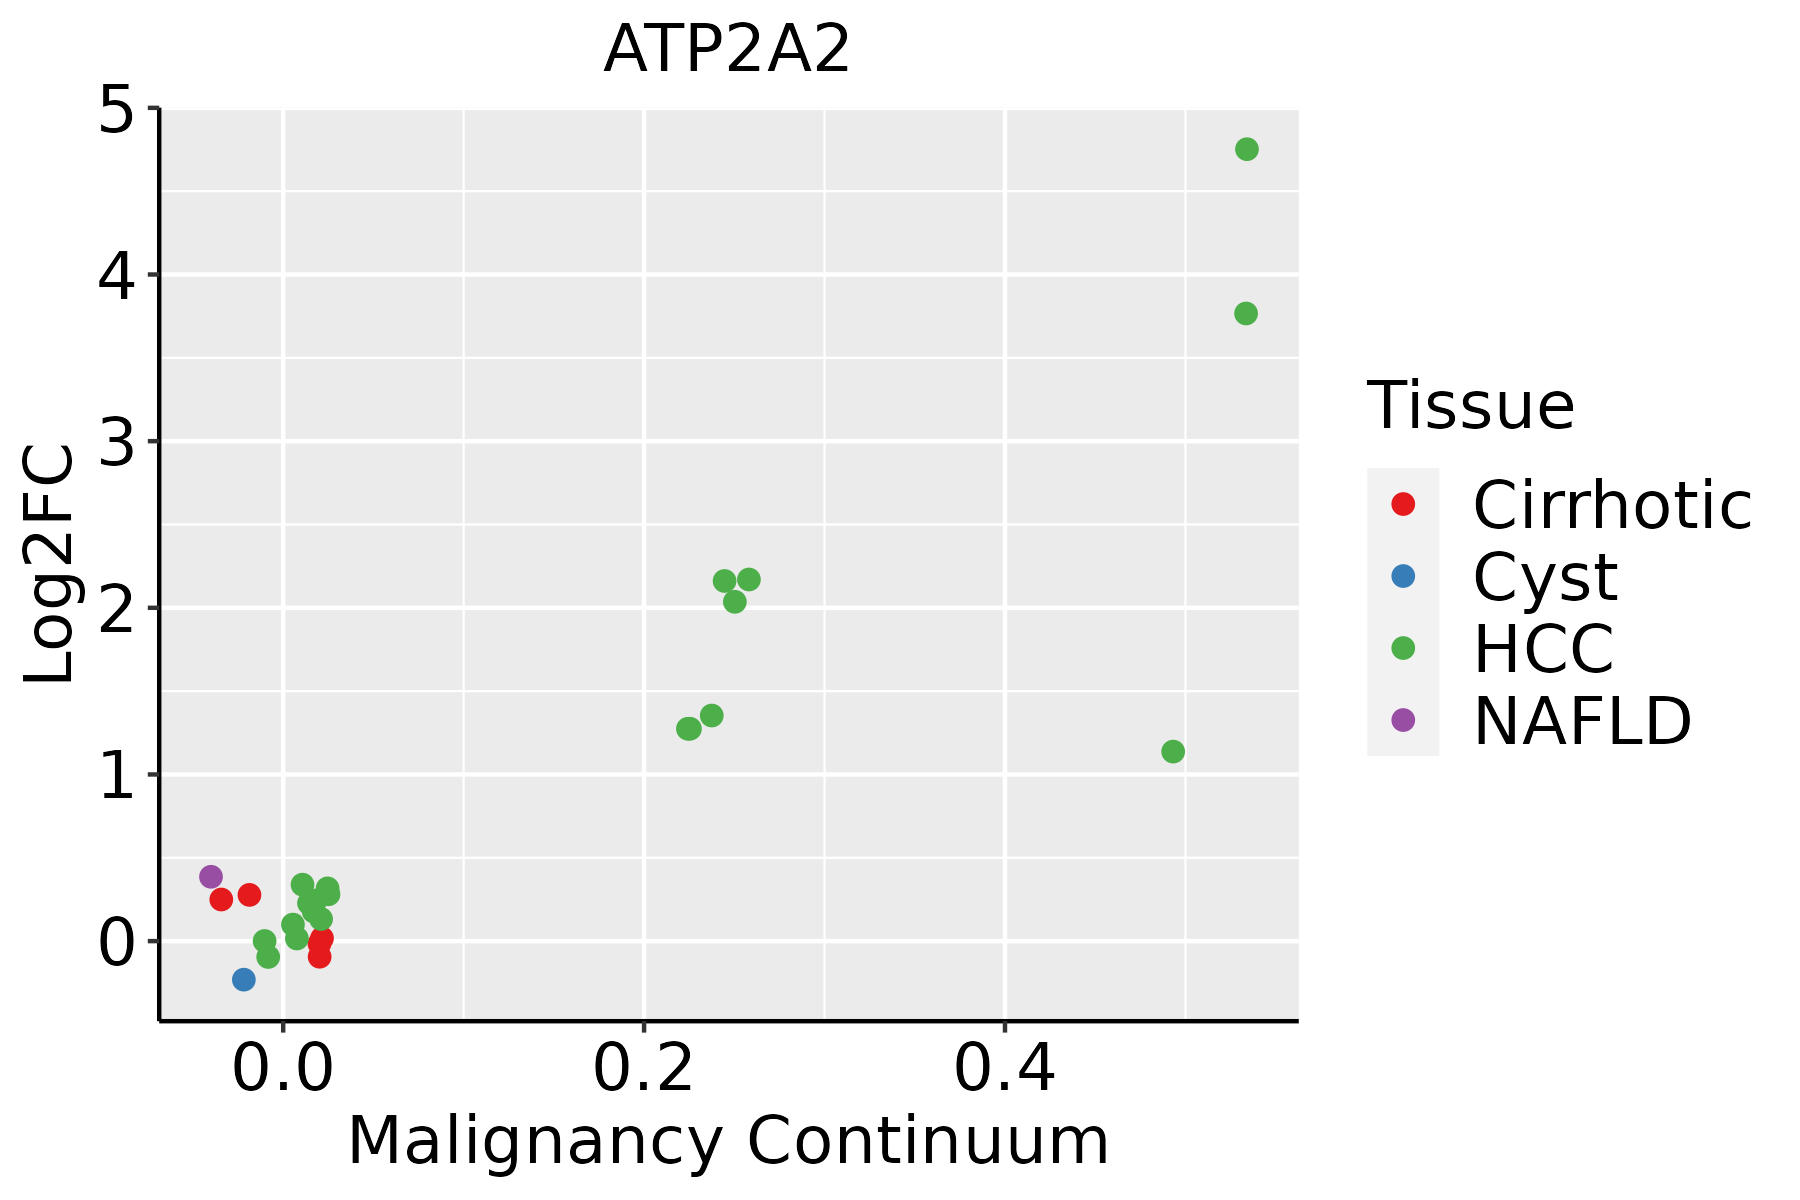 | HCC: Hepatocellular carcinoma |
| NAFLD: Non-alcoholic fatty liver disease |
| Lung | 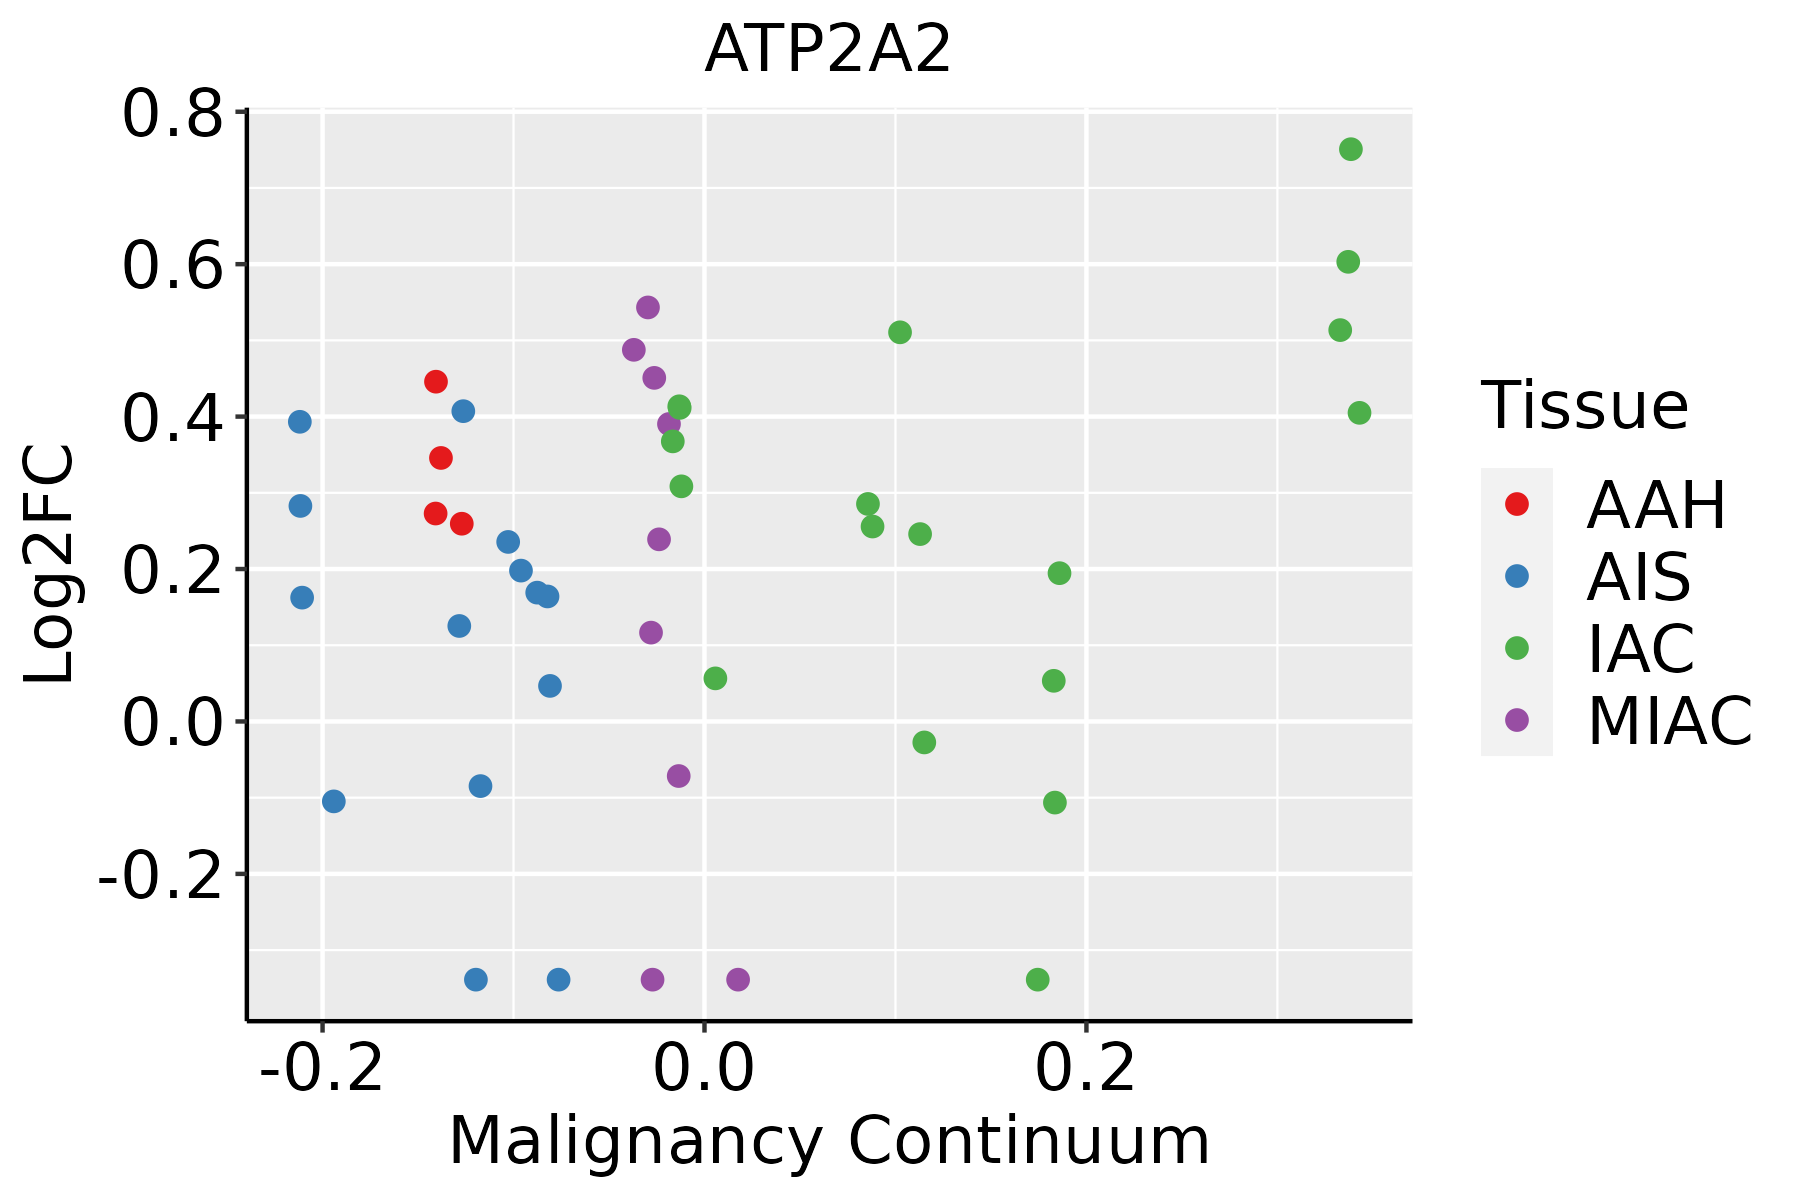 | AAH: Atypical adenomatous hyperplasia |
| AIS: Adenocarcinoma in situ |
| IAC: Invasive lung adenocarcinoma |
| MIA: Minimally invasive adenocarcinoma |
| Oral Cavity |  | EOLP: Erosive Oral lichen planus |
| LP: leukoplakia |
| NEOLP: Non-erosive oral lichen planus |
| OSCC: Oral squamous cell carcinoma |
| Prostate |  | BPH: Benign Prostatic Hyperplasia |
| Skin |  | AK: Actinic keratosis |
| cSCC: Cutaneous squamous cell carcinoma |
| SCCIS:squamous cell carcinoma in situ |
| Thyroid | 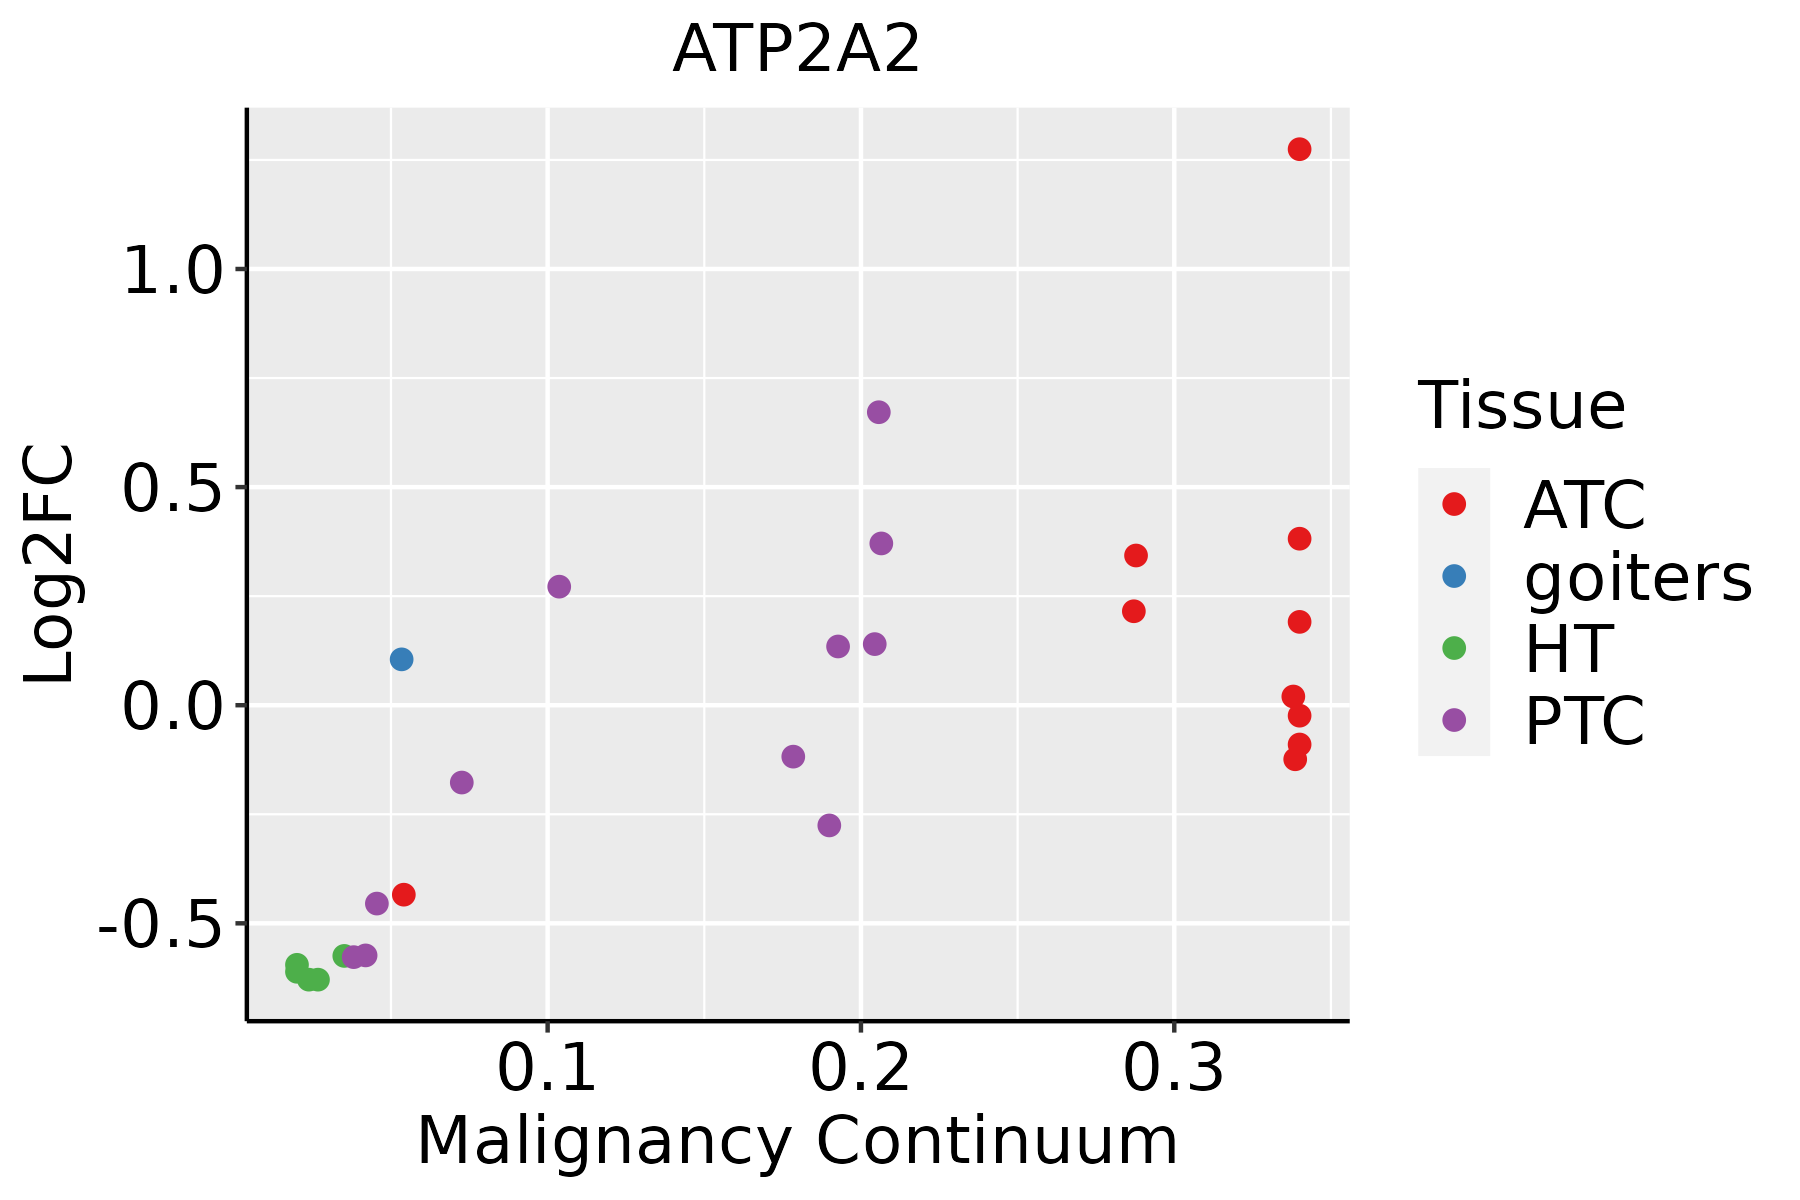 | ATC: Anaplastic thyroid cancer |
| HT: Hashimoto's thyroiditis |
| PTC: Papillary thyroid cancer |
| GO ID | Tissue | Disease Stage | Description | Gene Ratio | Bg Ratio | pvalue | p.adjust | Count |
| GO:00085446 | Cervix | CC | epidermis development | 83/2311 | 324/18723 | 3.91e-11 | 8.54e-09 | 83 |
| GO:003297010 | Cervix | CC | regulation of actin filament-based process | 96/2311 | 397/18723 | 4.00e-11 | 8.54e-09 | 96 |
| GO:000697910 | Cervix | CC | response to oxidative stress | 102/2311 | 446/18723 | 2.99e-10 | 4.36e-08 | 102 |
| GO:006219710 | Cervix | CC | cellular response to chemical stress | 76/2311 | 337/18723 | 1.01e-07 | 5.25e-06 | 76 |
| GO:005109810 | Cervix | CC | regulation of binding | 80/2311 | 363/18723 | 1.32e-07 | 6.42e-06 | 80 |
| GO:00022379 | Cervix | CC | response to molecule of bacterial origin | 78/2311 | 363/18723 | 5.55e-07 | 2.06e-05 | 78 |
| GO:00324969 | Cervix | CC | response to lipopolysaccharide | 74/2311 | 343/18723 | 9.15e-07 | 3.25e-05 | 74 |
| GO:003459910 | Cervix | CC | cellular response to oxidative stress | 63/2311 | 288/18723 | 3.58e-06 | 9.50e-05 | 63 |
| GO:003497610 | Cervix | CC | response to endoplasmic reticulum stress | 57/2311 | 256/18723 | 5.81e-06 | 1.42e-04 | 57 |
| GO:003460510 | Cervix | CC | cellular response to heat | 22/2311 | 69/18723 | 1.65e-05 | 3.20e-04 | 22 |
| GO:002241110 | Cervix | CC | cellular component disassembly | 83/2311 | 443/18723 | 6.04e-05 | 8.68e-04 | 83 |
| GO:00069846 | Cervix | CC | ER-nucleus signaling pathway | 16/2311 | 46/18723 | 7.12e-05 | 9.90e-04 | 16 |
| GO:00162367 | Cervix | CC | macroautophagy | 58/2311 | 291/18723 | 1.40e-04 | 1.70e-03 | 58 |
| GO:00433939 | Cervix | CC | regulation of protein binding | 42/2311 | 196/18723 | 2.27e-04 | 2.55e-03 | 42 |
| GO:00094089 | Cervix | CC | response to heat | 27/2311 | 110/18723 | 3.12e-04 | 3.32e-03 | 27 |
| GO:00324698 | Cervix | CC | endoplasmic reticulum calcium ion homeostasis | 10/2311 | 25/18723 | 4.52e-04 | 4.49e-03 | 10 |
| GO:00300487 | Cervix | CC | actin filament-based movement | 29/2311 | 127/18723 | 6.91e-04 | 6.33e-03 | 29 |
| GO:00426924 | Cervix | CC | muscle cell differentiation | 69/2311 | 384/18723 | 8.12e-04 | 7.09e-03 | 69 |
| GO:00092668 | Cervix | CC | response to temperature stimulus | 37/2311 | 178/18723 | 9.45e-04 | 7.95e-03 | 37 |
| GO:00511009 | Cervix | CC | negative regulation of binding | 34/2311 | 162/18723 | 1.25e-03 | 1.00e-02 | 34 |
| Pathway ID | Tissue | Disease Stage | Description | Gene Ratio | Bg Ratio | pvalue | p.adjust | qvalue | Count |
| hsa0501018 | Cervix | CC | Alzheimer disease | 113/1267 | 384/8465 | 9.67e-14 | 3.92e-12 | 2.32e-12 | 113 |
| hsa0502218 | Cervix | CC | Pathways of neurodegeneration - multiple diseases | 128/1267 | 476/8465 | 2.87e-12 | 9.29e-11 | 5.50e-11 | 128 |
| hsa0491918 | Cervix | CC | Thyroid hormone signaling pathway | 33/1267 | 121/8465 | 3.11e-04 | 1.65e-03 | 9.78e-04 | 33 |
| hsa0426018 | Cervix | CC | Cardiac muscle contraction | 23/1267 | 87/8465 | 3.71e-03 | 1.34e-02 | 7.91e-03 | 23 |
| hsa0501019 | Cervix | CC | Alzheimer disease | 113/1267 | 384/8465 | 9.67e-14 | 3.92e-12 | 2.32e-12 | 113 |
| hsa0502219 | Cervix | CC | Pathways of neurodegeneration - multiple diseases | 128/1267 | 476/8465 | 2.87e-12 | 9.29e-11 | 5.50e-11 | 128 |
| hsa0491919 | Cervix | CC | Thyroid hormone signaling pathway | 33/1267 | 121/8465 | 3.11e-04 | 1.65e-03 | 9.78e-04 | 33 |
| hsa0426019 | Cervix | CC | Cardiac muscle contraction | 23/1267 | 87/8465 | 3.71e-03 | 1.34e-02 | 7.91e-03 | 23 |
| hsa05010 | Colorectum | AD | Alzheimer disease | 174/2092 | 384/8465 | 1.82e-19 | 9.26e-18 | 5.91e-18 | 174 |
| hsa05022 | Colorectum | AD | Pathways of neurodegeneration - multiple diseases | 201/2092 | 476/8465 | 4.54e-18 | 1.27e-16 | 8.09e-17 | 201 |
| hsa05017 | Colorectum | AD | Spinocerebellar ataxia | 60/2092 | 143/8465 | 3.78e-06 | 4.35e-05 | 2.78e-05 | 60 |
| hsa04919 | Colorectum | AD | Thyroid hormone signaling pathway | 51/2092 | 121/8465 | 1.71e-05 | 1.73e-04 | 1.10e-04 | 51 |
| hsa04260 | Colorectum | AD | Cardiac muscle contraction | 32/2092 | 87/8465 | 7.92e-03 | 3.13e-02 | 2.00e-02 | 32 |
| hsa04972 | Colorectum | AD | Pancreatic secretion | 36/2092 | 102/8465 | 1.06e-02 | 3.98e-02 | 2.54e-02 | 36 |
| hsa050101 | Colorectum | AD | Alzheimer disease | 174/2092 | 384/8465 | 1.82e-19 | 9.26e-18 | 5.91e-18 | 174 |
| hsa050221 | Colorectum | AD | Pathways of neurodegeneration - multiple diseases | 201/2092 | 476/8465 | 4.54e-18 | 1.27e-16 | 8.09e-17 | 201 |
| hsa050171 | Colorectum | AD | Spinocerebellar ataxia | 60/2092 | 143/8465 | 3.78e-06 | 4.35e-05 | 2.78e-05 | 60 |
| hsa049191 | Colorectum | AD | Thyroid hormone signaling pathway | 51/2092 | 121/8465 | 1.71e-05 | 1.73e-04 | 1.10e-04 | 51 |
| hsa042601 | Colorectum | AD | Cardiac muscle contraction | 32/2092 | 87/8465 | 7.92e-03 | 3.13e-02 | 2.00e-02 | 32 |
| hsa049721 | Colorectum | AD | Pancreatic secretion | 36/2092 | 102/8465 | 1.06e-02 | 3.98e-02 | 2.54e-02 | 36 |
| Hugo Symbol | Variant Class | Variant Classification | dbSNP RS | HGVSc | HGVSp | HGVSp Short | SWISSPROT | BIOTYPE | SIFT | PolyPhen | Tumor Sample Barcode | Tissue | Histology | Sex | Age | Stage | Therapy Types | Drugs | Outcome |
| ATP2A2 | SNV | Missense_Mutation | | c.2234N>G | p.Ala745Gly | p.A745G | P16615 | protein_coding | deleterious(0) | benign(0.305) | TCGA-A2-A0D0-01 | Breast | breast invasive carcinoma | Female | <65 | I/II | Chemotherapy | cytoxan | SD |
| ATP2A2 | SNV | Missense_Mutation | | c.2234N>G | p.Ala745Gly | p.A745G | P16615 | protein_coding | deleterious(0) | benign(0.305) | TCGA-AN-A0AT-01 | Breast | breast invasive carcinoma | Female | <65 | I/II | Unknown | Unknown | SD |
| ATP2A2 | SNV | Missense_Mutation | novel | c.1771A>G | p.Thr591Ala | p.T591A | P16615 | protein_coding | deleterious(0) | probably_damaging(0.914) | TCGA-B6-A2IU-01 | Breast | breast invasive carcinoma | Female | <65 | I/II | Unknown | Unknown | PD |
| ATP2A2 | SNV | Missense_Mutation | | c.2440N>A | p.Asp814Asn | p.D814N | P16615 | protein_coding | tolerated(0.05) | benign(0.296) | TCGA-BH-A0HF-01 | Breast | breast invasive carcinoma | Female | >=65 | I/II | Hormone Therapy | arimidex | SD |
| ATP2A2 | SNV | Missense_Mutation | | c.2461N>T | p.Arg821Trp | p.R821W | P16615 | protein_coding | deleterious(0) | probably_damaging(1) | TCGA-E2-A14T-01 | Breast | breast invasive carcinoma | Female | <65 | I/II | Chemotherapy | doxorubicin | SD |
| ATP2A2 | SNV | Missense_Mutation | novel | c.3025N>A | p.Ala1009Thr | p.A1009T | P16615 | protein_coding | tolerated_low_confidence(0.1) | probably_damaging(0.971) | TCGA-LL-A6FQ-01 | Breast | breast invasive carcinoma | Female | >=65 | III/IV | Unknown | Unknown | SD |
| ATP2A2 | insertion | Frame_Shift_Ins | novel | c.244_245insGTCTGGAACTCTTGACCTC | p.Glu82GlyfsTer38 | p.E82Gfs*38 | P16615 | protein_coding | | | TCGA-AQ-A04J-01 | Breast | breast invasive carcinoma | Female | <65 | I/II | Chemotherapy | cytoxan | SD |
| ATP2A2 | insertion | Frame_Shift_Ins | novel | c.1849_1850insACTTGAGACAGCAGGAACCCATGTGTAGTTTAGAA | p.Gly617AspfsTer18 | p.G617Dfs*18 | P16615 | protein_coding | | | TCGA-B6-A0IN-01 | Breast | breast invasive carcinoma | Female | <65 | I/II | Unknown | Unknown | PD |
| ATP2A2 | SNV | Missense_Mutation | | c.1886N>A | p.Gly629Asp | p.G629D | P16615 | protein_coding | tolerated(0.08) | benign(0.003) | TCGA-C5-A1BM-01 | Cervix | cervical & endocervical cancer | Female | >=65 | I/II | Unknown | Unknown | SD |
| ATP2A2 | SNV | Missense_Mutation | | c.454N>C | p.Glu152Gln | p.E152Q | P16615 | protein_coding | deleterious(0.01) | benign(0.183) | TCGA-EK-A2RJ-01 | Cervix | cervical & endocervical cancer | Female | <65 | I/II | Unknown | Unknown | SD |


