
|
|||||
|
 | |
| |
| |
| |
| |
| |
|
Gene: ATP13A4 |
Gene summary for ATP13A4 |
| Gene information | Species | Human | Gene symbol | ATP13A4 | Gene ID | 84239 |
| Gene name | ATPase 13A4 | |
| Gene Alias | ATP13A4 | |
| Cytomap | 3q29 | |
| Gene Type | protein-coding | GO ID | GO:0006810 | UniProtAcc | B3KU47 |
Top |
Malignant transformation analysis |
| Identification of the aberrant gene expression in precancerous and cancerous lesions by comparing the gene expression of stem-like cells in diseased tissues with normal stem cells |
| Entrez ID | Symbol | Replicates | Species | Organ | Tissue | Adj P-value | Log2FC | Malignancy |
| 84239 | ATP13A4 | TD9 | Human | Lung | IAC | 4.86e-03 | 5.43e-01 | 0.088 |
| 84239 | ATP13A4 | RNA-P10T2-P10T2-2 | Human | Lung | AAH | 1.42e-02 | 8.07e-01 | -0.1406 |
| 84239 | ATP13A4 | RNA-P10T2-P10T2-4 | Human | Lung | AAH | 1.43e-02 | 6.94e-01 | -0.138 |
| 84239 | ATP13A4 | RNA-P17T-P17T-2 | Human | Lung | IAC | 1.56e-02 | 6.20e-01 | 0.3371 |
| 84239 | ATP13A4 | RNA-P17T-P17T-4 | Human | Lung | IAC | 4.57e-08 | 1.01e+00 | 0.343 |
| 84239 | ATP13A4 | RNA-P17T-P17T-6 | Human | Lung | IAC | 5.00e-09 | 9.28e-01 | 0.3385 |
| 84239 | ATP13A4 | RNA-P17T-P17T-8 | Human | Lung | IAC | 1.75e-05 | 7.83e-01 | 0.3329 |
| 84239 | ATP13A4 | RNA-P18T-P18T-2 | Human | Lung | IAC | 1.08e-03 | 1.33e+00 | 0.1129 |
| 84239 | ATP13A4 | RNA-P18T-P18T-4 | Human | Lung | IAC | 2.65e-02 | 1.16e+00 | 0.1024 |
| 84239 | ATP13A4 | RNA-P18T-P18T-6 | Human | Lung | IAC | 2.73e-03 | 1.39e+00 | 0.0856 |
| 84239 | ATP13A4 | RNA-P23T2-P23T2-2 | Human | Lung | MIAC | 9.65e-04 | 8.87e-01 | -0.028 |
| 84239 | ATP13A4 | RNA-P25T1-P25T1-1 | Human | Lung | AIS | 4.37e-18 | 9.47e-01 | -0.2116 |
| 84239 | ATP13A4 | RNA-P25T1-P25T1-2 | Human | Lung | AIS | 1.92e-08 | 9.37e-01 | -0.1941 |
| 84239 | ATP13A4 | RNA-P25T1-P25T1-3 | Human | Lung | AIS | 2.48e-09 | 8.06e-01 | -0.2107 |
| 84239 | ATP13A4 | RNA-P25T1-P25T1-4 | Human | Lung | AIS | 9.44e-11 | 7.67e-01 | -0.2119 |
| 84239 | ATP13A4 | RNA-P6T1-P6T1-1 | Human | Lung | MIAC | 3.01e-03 | 9.51e-01 | -0.0238 |
| 84239 | ATP13A4 | RNA-P6T1-P6T1-2 | Human | Lung | MIAC | 1.36e-06 | 1.19e+00 | -0.0186 |
| 84239 | ATP13A4 | RNA-P6T1-P6T1-3 | Human | Lung | MIAC | 2.07e-05 | 9.43e-01 | -0.0296 |
| 84239 | ATP13A4 | RNA-P6T1-P6T1-4 | Human | Lung | MIAC | 1.49e-09 | 1.17e+00 | -0.0263 |
| 84239 | ATP13A4 | RNA-P6T2-P6T2-1 | Human | Lung | IAC | 1.12e-46 | 1.21e+00 | -0.0166 |
| Page: 1 2 |
| Tissue | Expression Dynamics | Abbreviation |
| Lung | 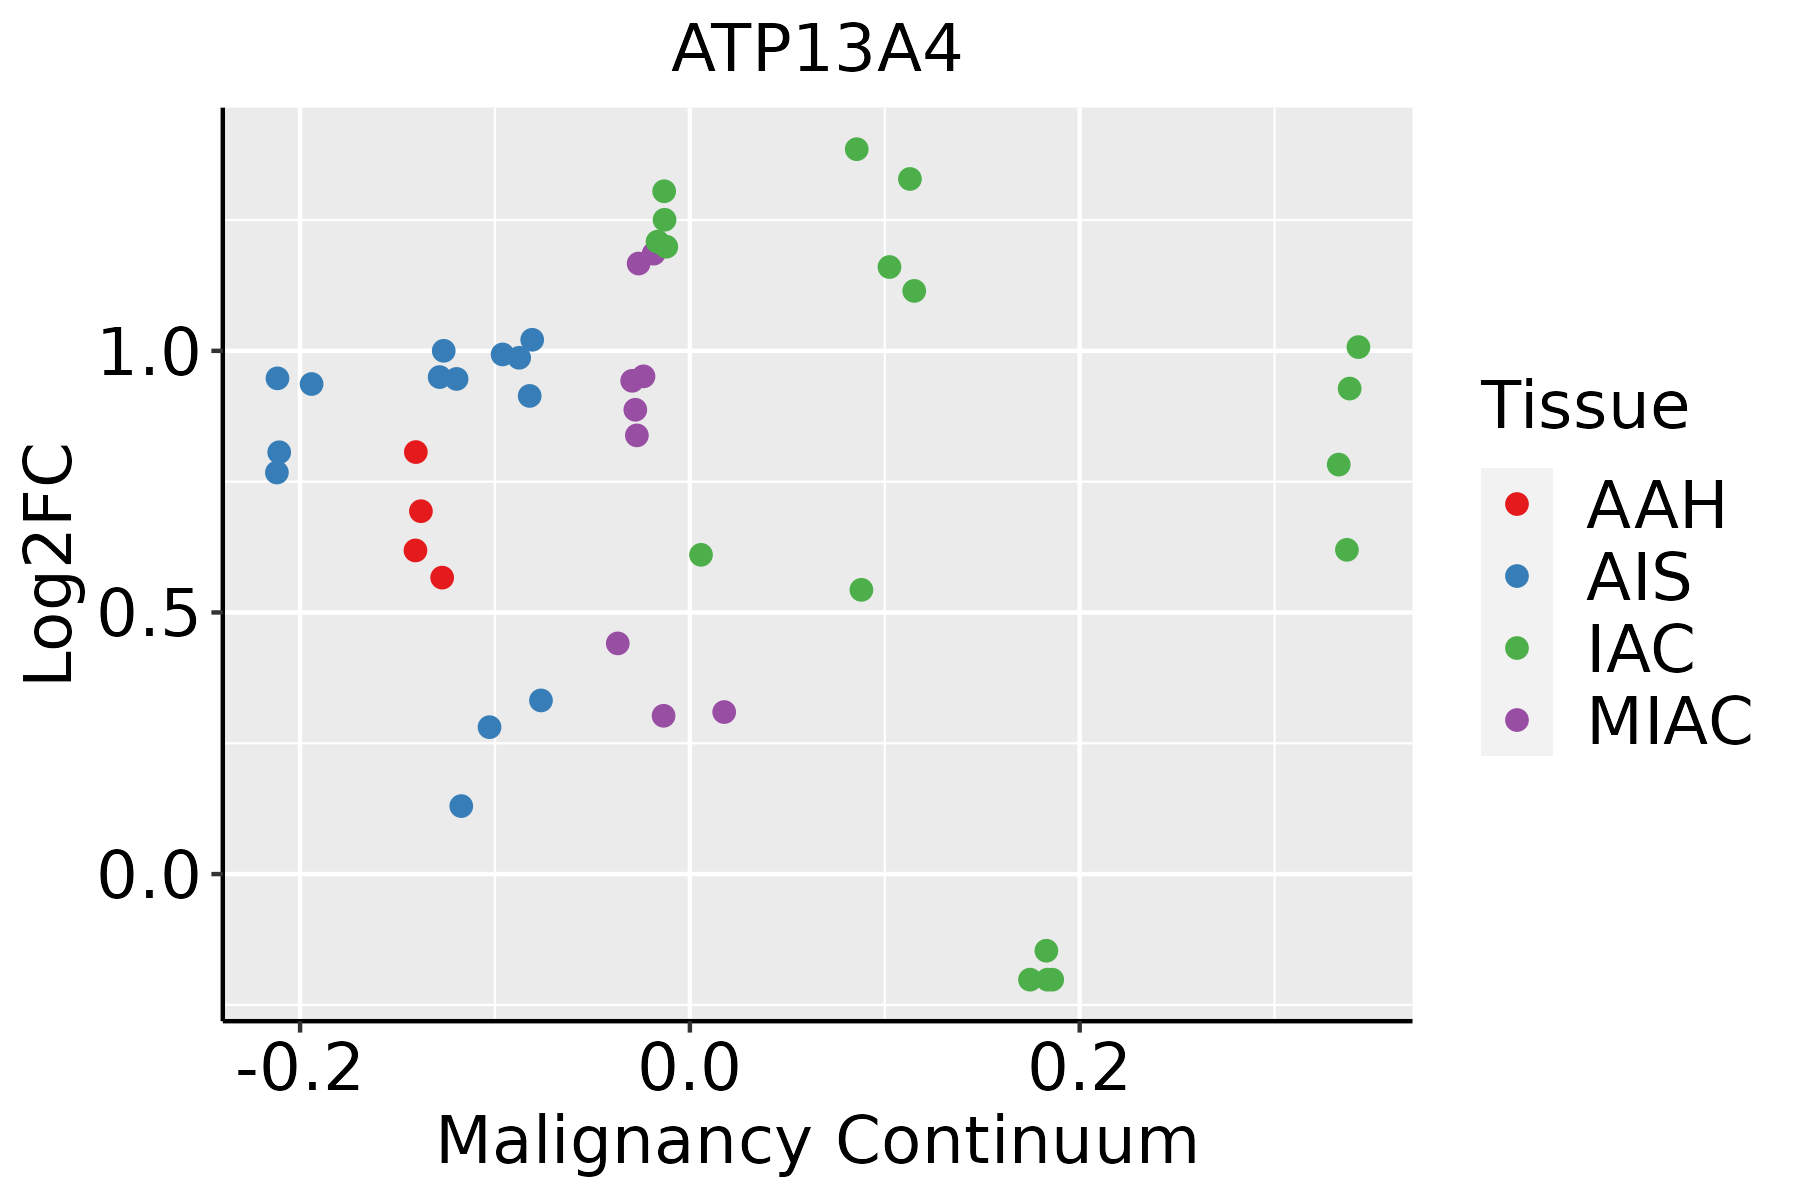 | AAH: Atypical adenomatous hyperplasia |
| AIS: Adenocarcinoma in situ | ||
| IAC: Invasive lung adenocarcinoma | ||
| MIA: Minimally invasive adenocarcinoma | ||
| Thyroid | 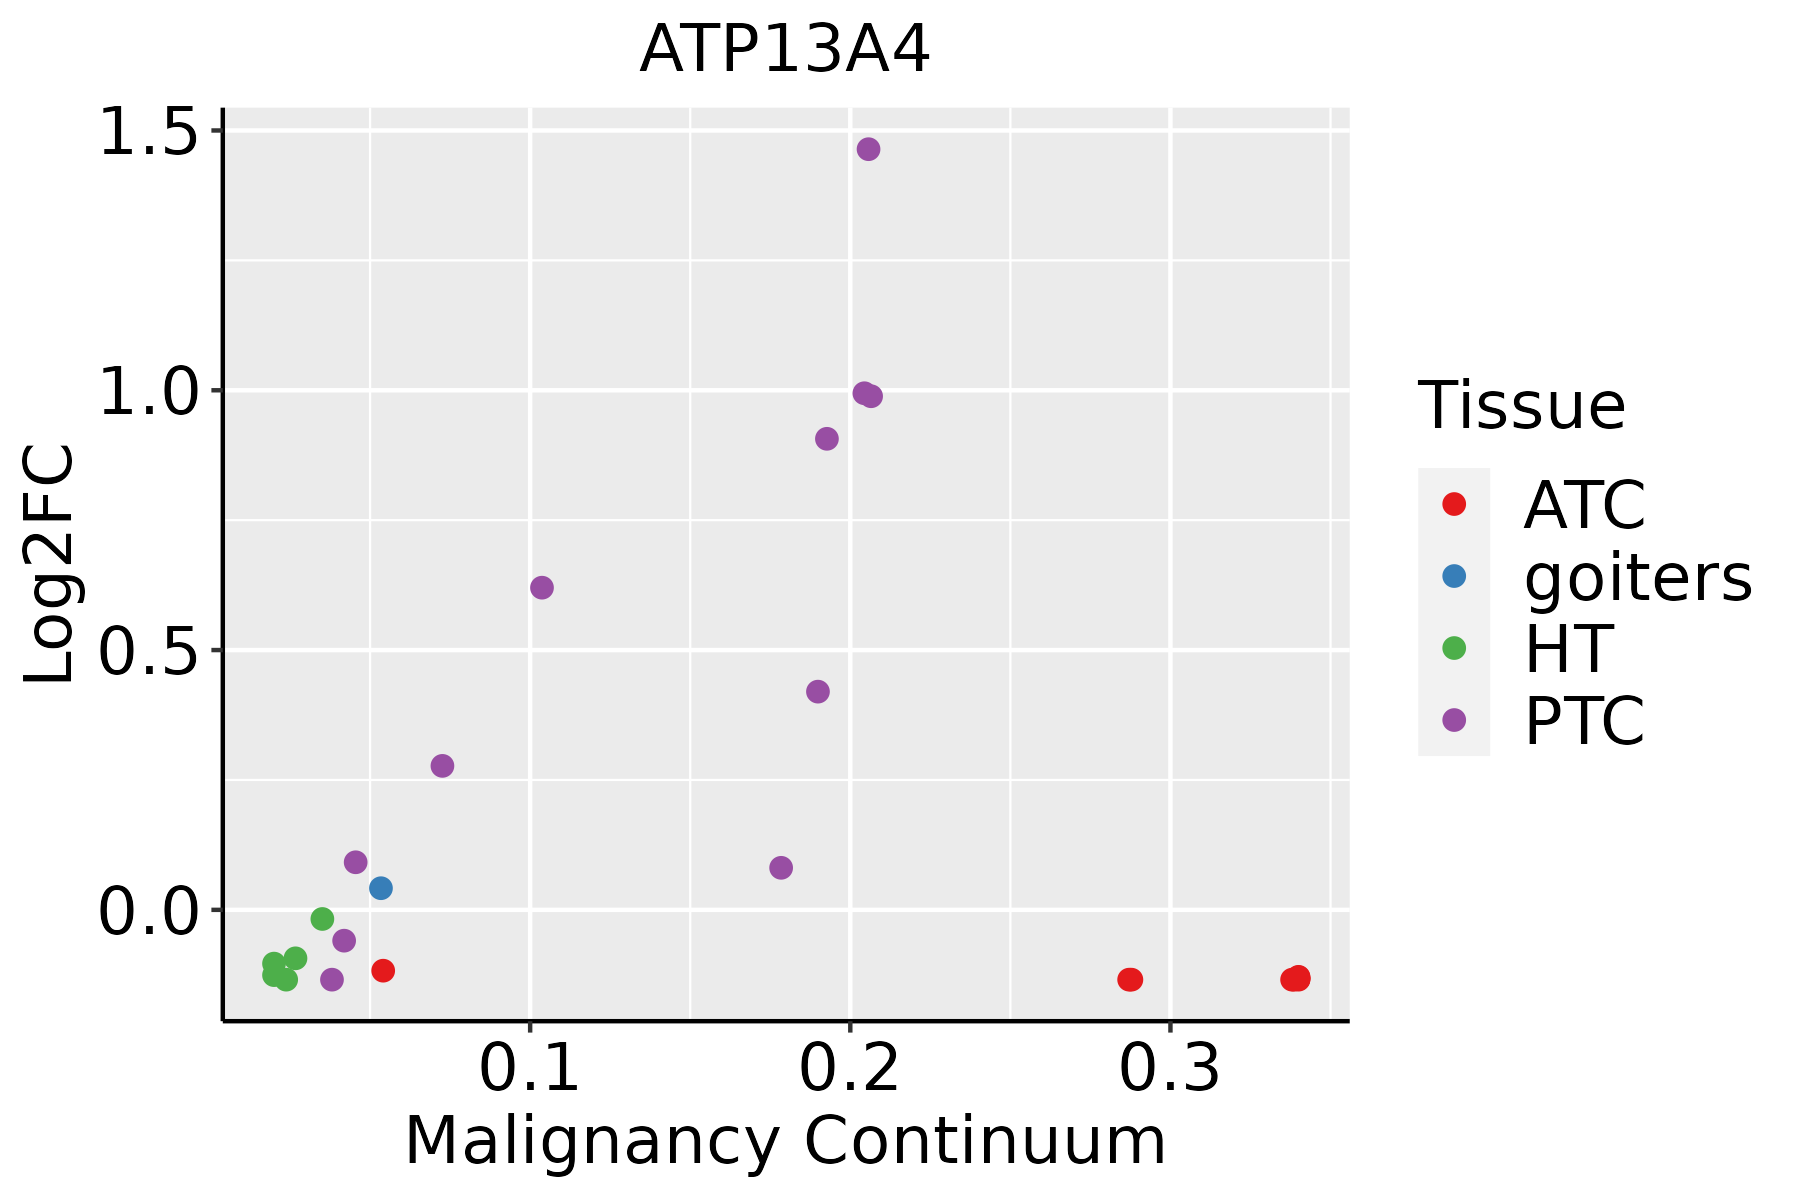 | ATC: Anaplastic thyroid cancer |
| HT: Hashimoto's thyroiditis | ||
| PTC: Papillary thyroid cancer |
| ∗log2FC in expression of this searched gene in stem-like cells from each diseased tissue sample relative to stem-like cells in normal samples in each tissue plotted against the malignancy continuum. Samples are colored based on if they are from different disease stage. |
Top |
Malignant transformation related pathway analysis |
| Find out the enriched GO biological processes and KEGG pathways involved in transition from healthy to precancer to cancer |
| Tissue | Disease Stage | Enriched GO biological Processes |
| Colorectum | AD |  |
| Colorectum | SER |  |
| Colorectum | MSS |  |
| Colorectum | MSI-H |  |
| Colorectum | FAP |  |
| ∗Top 15 enriched GO BP terms are showed in the bar plot of each disease state in each tissue. Each row represents a significant GO biological process which is colored according to the -log10(p.adjust). |
| Page: 1 2 3 4 5 6 7 8 9 |
| GO ID | Tissue | Disease Stage | Description | Gene Ratio | Bg Ratio | pvalue | p.adjust | Count |
| Page: 1 |
| Pathway ID | Tissue | Disease Stage | Description | Gene Ratio | Bg Ratio | pvalue | p.adjust | qvalue | Count |
| Page: 1 |
Top |
Cell-cell communication analysis |
| Identification of potential cell-cell interactions between two cell types and their ligand-receptor pairs for different disease states |
| Ligand | Receptor | LRpair | Pathway | Tissue | Disease Stage |
| Page: 1 |
Top |
Single-cell gene regulatory network inference analysis |
| Find out the significant the regulons (TFs) and the target genes of each regulon across cell types for different disease states |
| TF | Cell Type | Tissue | Disease Stage | Target Gene | RSS | Regulon Activity |
| ∗The dot plots of a searched regulon are shown for all cell subpopulations in each disease state of each tissue based on the regulon specific score inferred using pySCENIC and by calculating the average expression. |
| Page: 1 |
Top |
Somatic mutation of malignant transformation related genes |
| Annotation of somatic variants for genes involved in malignant transformation |
| Hugo Symbol | Variant Class | Variant Classification | dbSNP RS | HGVSc | HGVSp | HGVSp Short | SWISSPROT | BIOTYPE | SIFT | PolyPhen | Tumor Sample Barcode | Tissue | Histology | Sex | Age | Stage | Therapy Types | Drugs | Outcome |
| ATP13A4 | SNV | Missense_Mutation | novel | c.2849T>A | p.Leu950Gln | p.L950Q | Q4VNC1 | protein_coding | deleterious(0.01) | possibly_damaging(0.602) | TCGA-A7-A26I-01 | Breast | breast invasive carcinoma | Female | >=65 | I/II | Chemotherapy | cytoxan | SD |
| ATP13A4 | SNV | Missense_Mutation | rs746075290 | c.3382G>T | p.Ala1128Ser | p.A1128S | Q4VNC1 | protein_coding | tolerated(0.35) | benign(0.035) | TCGA-A8-A07W-01 | Breast | breast invasive carcinoma | Female | >=65 | III/IV | Hormone Therapy | exemestane | SD |
| ATP13A4 | SNV | Missense_Mutation | c.1114N>A | p.Gly372Arg | p.G372R | Q4VNC1 | protein_coding | deleterious(0) | probably_damaging(1) | TCGA-A8-A09N-01 | Breast | breast invasive carcinoma | Female | <65 | III/IV | Unknown | Unknown | SD | |
| ATP13A4 | SNV | Missense_Mutation | c.1766N>T | p.Pro589Leu | p.P589L | Q4VNC1 | protein_coding | deleterious(0) | possibly_damaging(0.582) | TCGA-AR-A24W-01 | Breast | breast invasive carcinoma | Female | <65 | I/II | Hormone Therapy | letrozole | SD | |
| ATP13A4 | SNV | Missense_Mutation | c.235G>T | p.Asp79Tyr | p.D79Y | Q4VNC1 | protein_coding | deleterious(0) | probably_damaging(1) | TCGA-AR-A24Z-01 | Breast | breast invasive carcinoma | Female | <65 | I/II | Chemotherapy | doxorubicin | SD | |
| ATP13A4 | SNV | Missense_Mutation | rs770184786 | c.1217N>C | p.Val406Ala | p.V406A | Q4VNC1 | protein_coding | tolerated(0.45) | benign(0.023) | TCGA-BH-A0HA-01 | Breast | breast invasive carcinoma | Female | <65 | I/II | Unknown | Unknown | SD |
| ATP13A4 | SNV | Missense_Mutation | rs745306193 | c.1379N>A | p.Arg460Lys | p.R460K | Q4VNC1 | protein_coding | deleterious(0) | probably_damaging(0.999) | TCGA-BH-A0HF-01 | Breast | breast invasive carcinoma | Female | >=65 | I/II | Hormone Therapy | arimidex | SD |
| ATP13A4 | SNV | Missense_Mutation | c.2258N>T | p.Ser753Leu | p.S753L | Q4VNC1 | protein_coding | tolerated(0.06) | benign(0.029) | TCGA-D8-A27G-01 | Breast | breast invasive carcinoma | Female | >=65 | I/II | Unknown | Unknown | SD | |
| ATP13A4 | SNV | Missense_Mutation | c.833N>C | p.Arg278Pro | p.R278P | Q4VNC1 | protein_coding | tolerated(0.11) | probably_damaging(0.964) | TCGA-E2-A14R-01 | Breast | breast invasive carcinoma | Female | <65 | I/II | Chemotherapy | doxorubicin | PD | |
| ATP13A4 | SNV | Missense_Mutation | c.2669T>G | p.Ile890Ser | p.I890S | Q4VNC1 | protein_coding | deleterious(0) | probably_damaging(0.98) | TCGA-E2-A1LH-01 | Breast | breast invasive carcinoma | Female | <65 | I/II | Chemotherapy | adriamycin | SD |
| Page: 1 2 3 4 5 6 7 8 9 10 11 12 13 14 |
Top |
Related drugs of malignant transformation related genes |
| Identification of chemicals and drugs interact with genes involved in malignant transfromation |
| (DGIdb 4.0) |
| Entrez ID | Symbol | Category | Interaction Types | Drug Claim Name | Drug Name | PMIDs |
| Page: 1 |

Copyright 2023-Present -The University of Texas Health Science Center at Houston |