Schematic overview of the cellular and molecular mechanisms involved in the cancer progression, including the proposed cellular and molecular mechanisms in cancer cells trajectory. AT1: alveolar type 1 cells; AT2: alveolar type 2 cells; AAH: atypical adenomatous hyperplasia; AIS: adenocarcinoma in situ; MIA: minimally invasive adenocarcinoma; IA: invasive adenocarcinoma; EMT: epithelial-mesenchymal transition

Home

Download

Statistics

Help

Contact

Center for Computational Systems Medicine
leaf

Gene summary

leaf

Malignant transformation analysis

leaf

Malignant transformation related pathway analysis

leaf

Cell-cell communication analysis

leaf

Single-cell gene regulatory network inference analysis

leaf

Somatic mutation of malignant transformation related genes

leaf

Related drugs of malignant transformation related genes

Gene: ATP13A2

Gene summary for ATP13A2

check button Gene summary.

Gene informationSpeciesHuman
Gene symbol

ATP13A2

Gene ID

23400

Gene nameATPase cation transporting 13A2
Gene AliasCLN12
Cytomap1p36.13
Gene Typeprotein-coding
GO ID

GO:0000296

UniProtAcc

Q8N4D4


Top

Malignant transformation analysis

check button Identification of the aberrant gene expression in precancerous and cancerous lesions by comparing the gene expression of stem-like cells in diseased tissues with normal stem cells
check button Malignant transformation involving gene list.
Entrez IDSymbolReplicatesSpeciesOrganTissueAdj P-valueLog2FCMalignancy
23400ATP13A2HTA11_2487_2000001011HumanColorectumSER3.64e-073.98e-01-0.1808
23400ATP13A2HTA11_1938_2000001011HumanColorectumAD4.23e-104.57e-01-0.0811
23400ATP13A2HTA11_347_2000001011HumanColorectumAD1.13e-021.87e-01-0.1954
23400ATP13A2HTA11_411_2000001011HumanColorectumSER9.55e-048.97e-01-0.2602
23400ATP13A2HTA11_2112_2000001011HumanColorectumSER1.81e-056.27e-01-0.2196
23400ATP13A2HTA11_696_2000001011HumanColorectumAD8.58e-063.09e-01-0.1464
23400ATP13A2HTA11_1391_2000001011HumanColorectumAD1.16e-022.36e-01-0.059
23400ATP13A2HTA11_99999971662_82457HumanColorectumMSS2.89e-043.11e-010.3859
23400ATP13A2A002-C-016HumanColorectumFAP3.61e-02-5.41e-020.0521
23400ATP13A2LZE7THumanEsophagusESCC9.50e-062.56e-010.0667
23400ATP13A2LZE22THumanEsophagusESCC1.87e-043.08e-010.068
23400ATP13A2LZE24THumanEsophagusESCC1.44e-072.38e-010.0596
23400ATP13A2LZE21THumanEsophagusESCC5.05e-033.16e-010.0655
23400ATP13A2P1T-EHumanEsophagusESCC5.02e-103.71e-010.0875
23400ATP13A2P2T-EHumanEsophagusESCC3.91e-131.83e-010.1177
23400ATP13A2P4T-EHumanEsophagusESCC1.09e-031.08e-010.1323
23400ATP13A2P5T-EHumanEsophagusESCC1.04e-056.23e-020.1327
23400ATP13A2P8T-EHumanEsophagusESCC2.57e-091.83e-010.0889
23400ATP13A2P9T-EHumanEsophagusESCC4.46e-031.61e-010.1131
23400ATP13A2P10T-EHumanEsophagusESCC4.23e-112.12e-010.116
Page: 1 2 3 4 5 

check button Transcriptomic changes along malignancy continuum.
TissueExpression DynamicsAbbreviation
Colorectum (GSE201348)The image shows the transcriptomic changes along malignancy continuum.log2FC in expression of this searched gene in stem-like cells from each diseased tissue sample relative to stem-like cells in normal samples in each tissue plotted against the malignancy continuum. Samples are colored based on if they are from different disease stage.
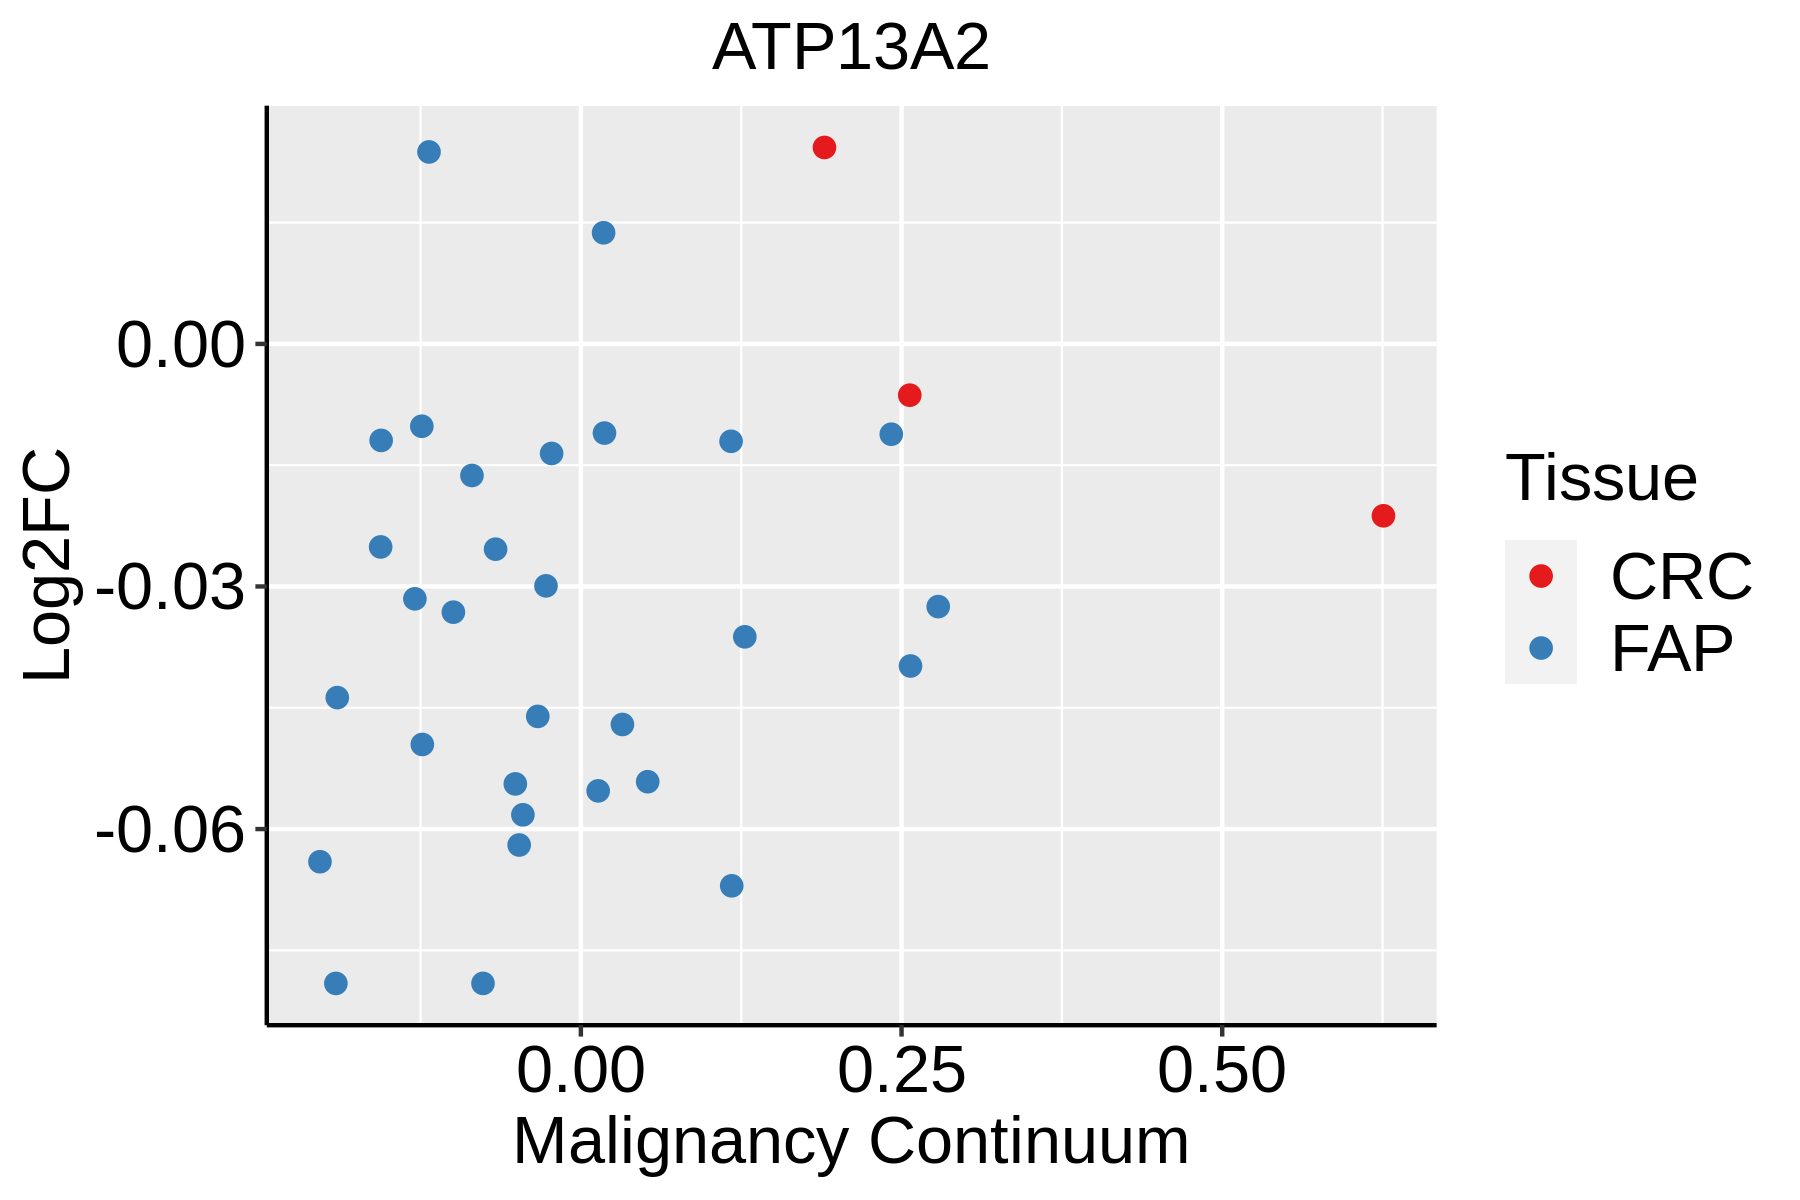
FAP: Familial adenomatous polyposis
CRC: Colorectal cancer
Colorectum (HTA11)The image shows the transcriptomic changes along malignancy continuum.log2FC in expression of this searched gene in stem-like cells from each diseased tissue sample relative to stem-like cells in normal samples in each tissue plotted against the malignancy continuum. Samples are colored based on if they are from different disease stage.AD: Adenomas
SER: Sessile serrated lesions
MSI-H: Microsatellite-high colorectal cancer
MSS: Microsatellite stable colorectal cancer
EsophagusThe image shows the transcriptomic changes along malignancy continuum.log2FC in expression of this searched gene in stem-like cells from each diseased tissue sample relative to stem-like cells in normal samples in each tissue plotted against the malignancy continuum. Samples are colored based on if they are from different disease stage.ESCC: Esophageal squamous cell carcinoma
HGIN: High-grade intraepithelial neoplasias
LGIN: Low-grade intraepithelial neoplasias
Oral CavityThe image shows the transcriptomic changes along malignancy continuum.log2FC in expression of this searched gene in stem-like cells from each diseased tissue sample relative to stem-like cells in normal samples in each tissue plotted against the malignancy continuum. Samples are colored based on if they are from different disease stage.EOLP: Erosive Oral lichen planus
LP: leukoplakia
NEOLP: Non-erosive oral lichen planus
OSCC: Oral squamous cell carcinoma
SkinThe image shows the transcriptomic changes along malignancy continuum.log2FC in expression of this searched gene in stem-like cells from each diseased tissue sample relative to stem-like cells in normal samples in each tissue plotted against the malignancy continuum. Samples are colored based on if they are from different disease stage.AK: Actinic keratosis
cSCC: Cutaneous squamous cell carcinoma
SCCIS:squamous cell carcinoma in situ
ThyroidThe image shows the transcriptomic changes along malignancy continuum.log2FC in expression of this searched gene in stem-like cells from each diseased tissue sample relative to stem-like cells in normal samples in each tissue plotted against the malignancy continuum. Samples are colored based on if they are from different disease stage.
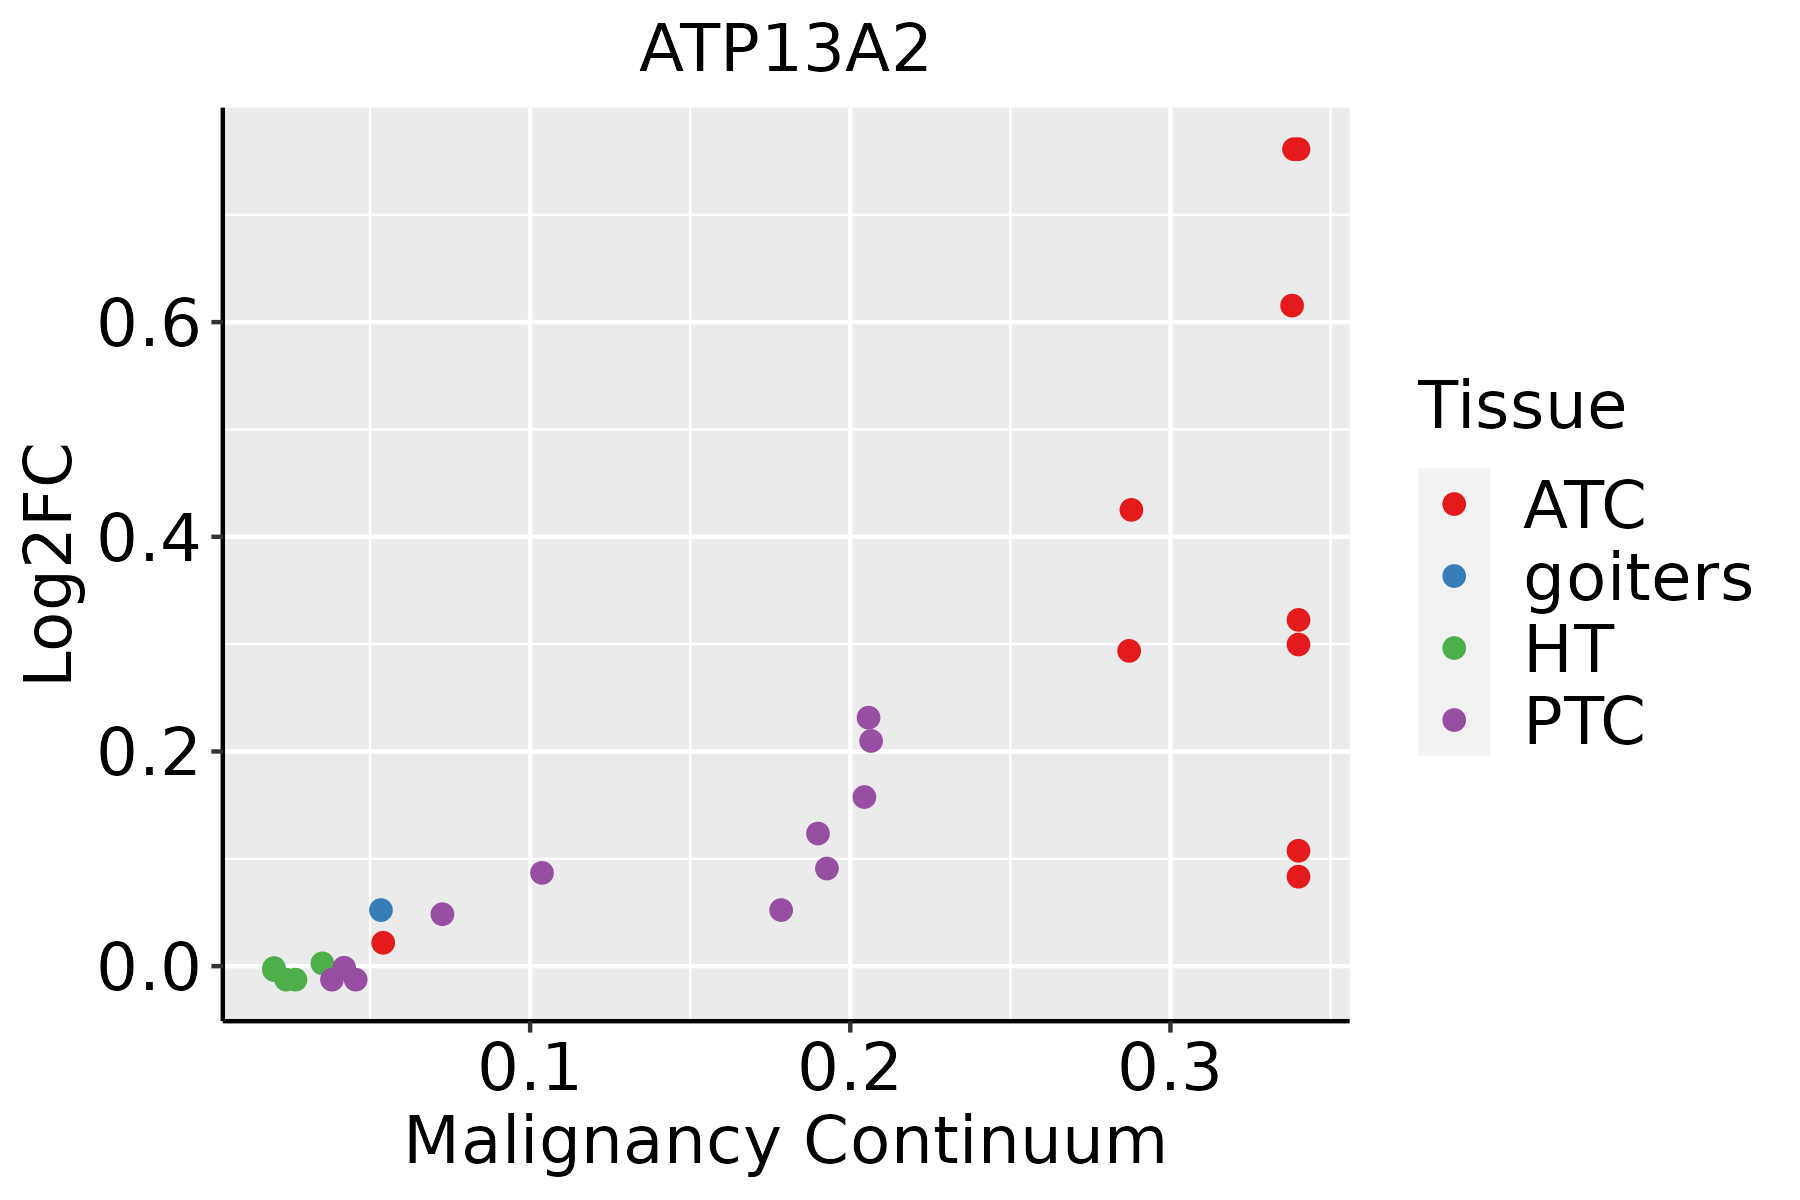
ATC: Anaplastic thyroid cancer
HT: Hashimoto's thyroiditis
PTC: Papillary thyroid cancer
∗log2FC in expression of this searched gene in stem-like cells from each diseased tissue sample relative to stem-like cells in normal samples in each tissue plotted against the malignancy continuum. Samples are colored based on if they are from different disease stage.

Top

Malignant transformation related pathway analysis

check buttonFind out the enriched GO biological processes and KEGG pathways involved in transition from healthy to precancer to cancer
check button Figure of enriched GO biological processes.
TissueDisease StageEnriched GO biological Processes
ColorectumADGO analysis - Figure of enriched GO biological processes: Top 15 enriched GO BP terms are showed in the bar plot of each disease state in each tissue. Each row represents a significant GO biological process which is colored according to the -log10(p.adjust).
ColorectumSERGO analysis - Figure of enriched GO biological processes: Top 15 enriched GO BP terms are showed in the bar plot of each disease state in each tissue. Each row represents a significant GO biological process which is colored according to the -log10(p.adjust).
ColorectumMSSGO analysis - Figure of enriched GO biological processes: Top 15 enriched GO BP terms are showed in the bar plot of each disease state in each tissue. Each row represents a significant GO biological process which is colored according to the -log10(p.adjust).
ColorectumMSI-HGO analysis - Figure of enriched GO biological processes: Top 15 enriched GO BP terms are showed in the bar plot of each disease state in each tissue. Each row represents a significant GO biological process which is colored according to the -log10(p.adjust).
ColorectumFAPGO analysis - Figure of enriched GO biological processes: Top 15 enriched GO BP terms are showed in the bar plot of each disease state in each tissue. Each row represents a significant GO biological process which is colored according to the -log10(p.adjust).
∗Top 15 enriched GO BP terms are showed in the bar plot of each disease state in each tissue. Each row represents a significant GO biological process which is colored according to the -log10(p.adjust).
Page: 1 2 3 4 5 6 7 8 9 

check button Enriched GO biological processes.
GO IDTissueDisease StageDescriptionGene RatioBg Ratiopvaluep.adjustCount
GO:0042176ColorectumADregulation of protein catabolic process160/3918391/187231.06e-197.34e-17160
GO:1903362ColorectumADregulation of cellular protein catabolic process109/3918255/187232.14e-156.08e-13109
GO:0009895ColorectumADnegative regulation of catabolic process124/3918320/187231.66e-133.35e-11124
GO:0032535ColorectumADregulation of cellular component size142/3918383/187231.74e-133.41e-11142
GO:0031330ColorectumADnegative regulation of cellular catabolic process104/3918262/187232.66e-123.96e-10104
GO:0022411ColorectumADcellular component disassembly147/3918443/187238.53e-106.76e-08147
GO:0042177ColorectumADnegative regulation of protein catabolic process55/3918121/187231.19e-098.85e-0855
GO:1904951ColorectumADpositive regulation of establishment of protein localization112/3918319/187232.55e-091.80e-07112
GO:1903363ColorectumADnegative regulation of cellular protein catabolic process39/391875/187232.69e-091.87e-0739
GO:0010506ColorectumADregulation of autophagy111/3918317/187233.57e-092.35e-07111
GO:0006979ColorectumADresponse to oxidative stress145/3918446/187235.16e-093.23e-07145
GO:0016236ColorectumADmacroautophagy103/3918291/187236.76e-094.15e-07103
GO:0051222ColorectumADpositive regulation of protein transport106/3918303/187238.45e-095.08e-07106
GO:1990182ColorectumADexosomal secretion16/391820/187232.67e-081.47e-0616
GO:0097734ColorectumADextracellular exosome biogenesis16/391821/187239.02e-084.52e-0616
GO:0016050ColorectumADvesicle organization101/3918300/187231.65e-077.17e-06101
GO:1900180ColorectumADregulation of protein localization to nucleus55/3918136/187231.70e-077.34e-0655
GO:0010821ColorectumADregulation of mitochondrion organization57/3918144/187232.43e-079.92e-0657
GO:0007034ColorectumADvacuolar transport60/3918157/187234.97e-071.85e-0560
GO:0032386ColorectumADregulation of intracellular transport109/3918337/187235.33e-071.95e-05109
Page: 1 2 3 4 5 6 7 8 9 10 11 12 13 14 15 16 17 18 19 20 21 22 23 24 25 26 27 28 29 

check button Enriched KEGG pathways.
Pathway IDTissueDisease StageDescriptionGene RatioBg Ratiopvaluep.adjustqvalueCount
Page: 1 

Top

Cell-cell communication analysis

check buttonIdentification of potential cell-cell interactions between two cell types and their ligand-receptor pairs for different disease states
LigandReceptorLRpairPathwayTissueDisease Stage
Page: 1 

Top

Single-cell gene regulatory network inference analysis

check buttonFind out the significant the regulons (TFs) and the target genes of each regulon across cell types for different disease states
TFCell TypeTissueDisease StageTarget GeneRSSRegulon Activity
∗The dot plots of a searched regulon are shown for all cell subpopulations in each disease state of each tissue based on the regulon specific score inferred using pySCENIC and by calculating the average expression.
Page: 1 

Top

Somatic mutation of malignant transformation related genes

check buttonAnnotation of somatic variants for genes involved in malignant transformation
Hugo SymbolVariant ClassVariant ClassificationdbSNP RSHGVScHGVSpHGVSp ShortSWISSPROTBIOTYPESIFTPolyPhenTumor Sample BarcodeTissueHistologySexAgeStageTherapy TypesDrugsOutcome
ATP13A2SNVMissense_Mutationnovelc.833N>Gp.Thr278Serp.T278SQ9NQ11protein_codingtolerated(0.08)probably_damaging(0.969)TCGA-A7-A6VX-01Breastbreast invasive carcinomaFemale>=65I/IIChemotherapydocetaxelCR
ATP13A2SNVMissense_Mutationrs754208001c.2368G>Ap.Glu790Lysp.E790KQ9NQ11protein_codingtolerated(0.94)benign(0.007)TCGA-D8-A27L-01Breastbreast invasive carcinomaFemale<65III/IVChemotherapyadriamycin+cuclophosphamideSD
ATP13A2insertionFrame_Shift_Insnovelc.2507_2508insGACTCCGTCTCAAAAAATAGTAATAGGCCAGGCGCGGTp.His836GlnfsTer64p.H836Qfs*64Q9NQ11protein_codingTCGA-A2-A0D1-01Breastbreast invasive carcinomaFemale>=65I/IIChemotherapytaxotereSD
ATP13A2deletionFrame_Shift_Delnovelc.1750delGp.Val584SerfsTer19p.V584Sfs*19Q9NQ11protein_codingTCGA-D8-A27V-01Breastbreast invasive carcinomaFemale<65I/IIHormone TherapytamoxiphenSD
ATP13A2SNVMissense_Mutationrs776601823c.515G>Ap.Arg172Hisp.R172HQ9NQ11protein_codingdeleterious(0)probably_damaging(0.972)TCGA-2W-A8YY-01Cervixcervical & endocervical cancerFemale<65I/IIChemotherapycisplatinCR
ATP13A2SNVMissense_Mutationrs144701072c.2629N>Ap.Gly877Argp.G877RQ9NQ11protein_codingdeleterious(0)probably_damaging(0.997)TCGA-EA-A410-01Cervixcervical & endocervical cancerFemale<65I/IIUnknownUnknownSD
ATP13A2SNVMissense_Mutationc.853N>Gp.Leu285Valp.L285VQ9NQ11protein_codingdeleterious(0)possibly_damaging(0.856)TCGA-IR-A3LH-01Cervixcervical & endocervical cancerFemale<65I/IIChemotherapycisplatinCR
ATP13A2SNVMissense_Mutationrs776601823c.515G>Ap.Arg172Hisp.R172HQ9NQ11protein_codingdeleterious(0)probably_damaging(0.972)TCGA-JW-AAVH-01Cervixcervical & endocervical cancerFemale<65I/IIUnknownUnknownSD
ATP13A2SNVMissense_Mutationc.278G>Ap.Arg93Lysp.R93KQ9NQ11protein_codingtolerated(0.39)benign(0.003)TCGA-MY-A5BD-01Cervixcervical & endocervical cancerFemale<65I/IIChemotherapycisplatinCR
ATP13A2SNVMissense_Mutationc.151C>Tp.His51Tyrp.H51YQ9NQ11protein_codingtolerated(0.27)benign(0.023)TCGA-MY-A5BD-01Cervixcervical & endocervical cancerFemale<65I/IIChemotherapycisplatinCR
Page: 1 2 3 4 5 6 7 8 9 10 

Top

Related drugs of malignant transformation related genes

check buttonIdentification of chemicals and drugs interact with genes involved in malignant transfromation
(DGIdb 4.0)
Entrez IDSymbolCategoryInteraction TypesDrug Claim NameDrug NamePMIDs
Page: 1