
|
|||||
|
 | |
| |
| |
| |
| |
| |
|
Gene: ATP13A1 |
Gene summary for ATP13A1 |
| Gene information | Species | Human | Gene symbol | ATP13A1 | Gene ID | 57130 |
| Gene name | ATPase 13A1 | |
| Gene Alias | ATP13A | |
| Cytomap | 19p13.11 | |
| Gene Type | protein-coding | GO ID | GO:0000041 | UniProtAcc | A0A024R7N2 |
Top |
Malignant transformation analysis |
| Identification of the aberrant gene expression in precancerous and cancerous lesions by comparing the gene expression of stem-like cells in diseased tissues with normal stem cells |
| Entrez ID | Symbol | Replicates | Species | Organ | Tissue | Adj P-value | Log2FC | Malignancy |
| 57130 | ATP13A1 | HTA11_3410_2000001011 | Human | Colorectum | AD | 1.08e-02 | 7.27e-02 | 0.0155 |
| 57130 | ATP13A1 | HTA11_2487_2000001011 | Human | Colorectum | SER | 9.84e-04 | 2.24e-01 | -0.1808 |
| 57130 | ATP13A1 | HTA11_347_2000001011 | Human | Colorectum | AD | 2.42e-03 | 1.15e-01 | -0.1954 |
| 57130 | ATP13A1 | HTA11_1391_2000001011 | Human | Colorectum | AD | 6.68e-03 | 1.98e-01 | -0.059 |
| 57130 | ATP13A1 | HTA11_7696_3000711011 | Human | Colorectum | AD | 4.51e-09 | 1.72e-01 | 0.0674 |
| 57130 | ATP13A1 | HTA11_99999970781_79442 | Human | Colorectum | MSS | 4.87e-02 | 1.25e-01 | 0.294 |
| 57130 | ATP13A1 | HTA11_99999971662_82457 | Human | Colorectum | MSS | 1.69e-04 | 2.35e-01 | 0.3859 |
| 57130 | ATP13A1 | LZE7T | Human | Esophagus | ESCC | 2.28e-11 | 3.97e-01 | 0.0667 |
| 57130 | ATP13A1 | LZE24T | Human | Esophagus | ESCC | 2.09e-16 | 3.64e-01 | 0.0596 |
| 57130 | ATP13A1 | P1T-E | Human | Esophagus | ESCC | 2.75e-10 | 2.97e-01 | 0.0875 |
| 57130 | ATP13A1 | P2T-E | Human | Esophagus | ESCC | 5.08e-10 | 1.61e-01 | 0.1177 |
| 57130 | ATP13A1 | P4T-E | Human | Esophagus | ESCC | 7.88e-12 | 2.58e-01 | 0.1323 |
| 57130 | ATP13A1 | P5T-E | Human | Esophagus | ESCC | 8.19e-12 | 1.38e-01 | 0.1327 |
| 57130 | ATP13A1 | P8T-E | Human | Esophagus | ESCC | 1.19e-16 | 3.67e-01 | 0.0889 |
| 57130 | ATP13A1 | P9T-E | Human | Esophagus | ESCC | 5.17e-16 | 3.05e-01 | 0.1131 |
| 57130 | ATP13A1 | P10T-E | Human | Esophagus | ESCC | 2.35e-18 | 3.60e-01 | 0.116 |
| 57130 | ATP13A1 | P11T-E | Human | Esophagus | ESCC | 1.82e-18 | 5.97e-01 | 0.1426 |
| 57130 | ATP13A1 | P12T-E | Human | Esophagus | ESCC | 7.28e-26 | 3.43e-01 | 0.1122 |
| 57130 | ATP13A1 | P15T-E | Human | Esophagus | ESCC | 1.48e-15 | 3.13e-01 | 0.1149 |
| 57130 | ATP13A1 | P16T-E | Human | Esophagus | ESCC | 2.74e-23 | 4.11e-01 | 0.1153 |
| Page: 1 2 3 4 5 6 |
| Tissue | Expression Dynamics | Abbreviation |
| Colorectum (GSE201348) |  | FAP: Familial adenomatous polyposis |
| CRC: Colorectal cancer | ||
| Colorectum (HTA11) |  | AD: Adenomas |
| SER: Sessile serrated lesions | ||
| MSI-H: Microsatellite-high colorectal cancer | ||
| MSS: Microsatellite stable colorectal cancer | ||
| Esophagus | 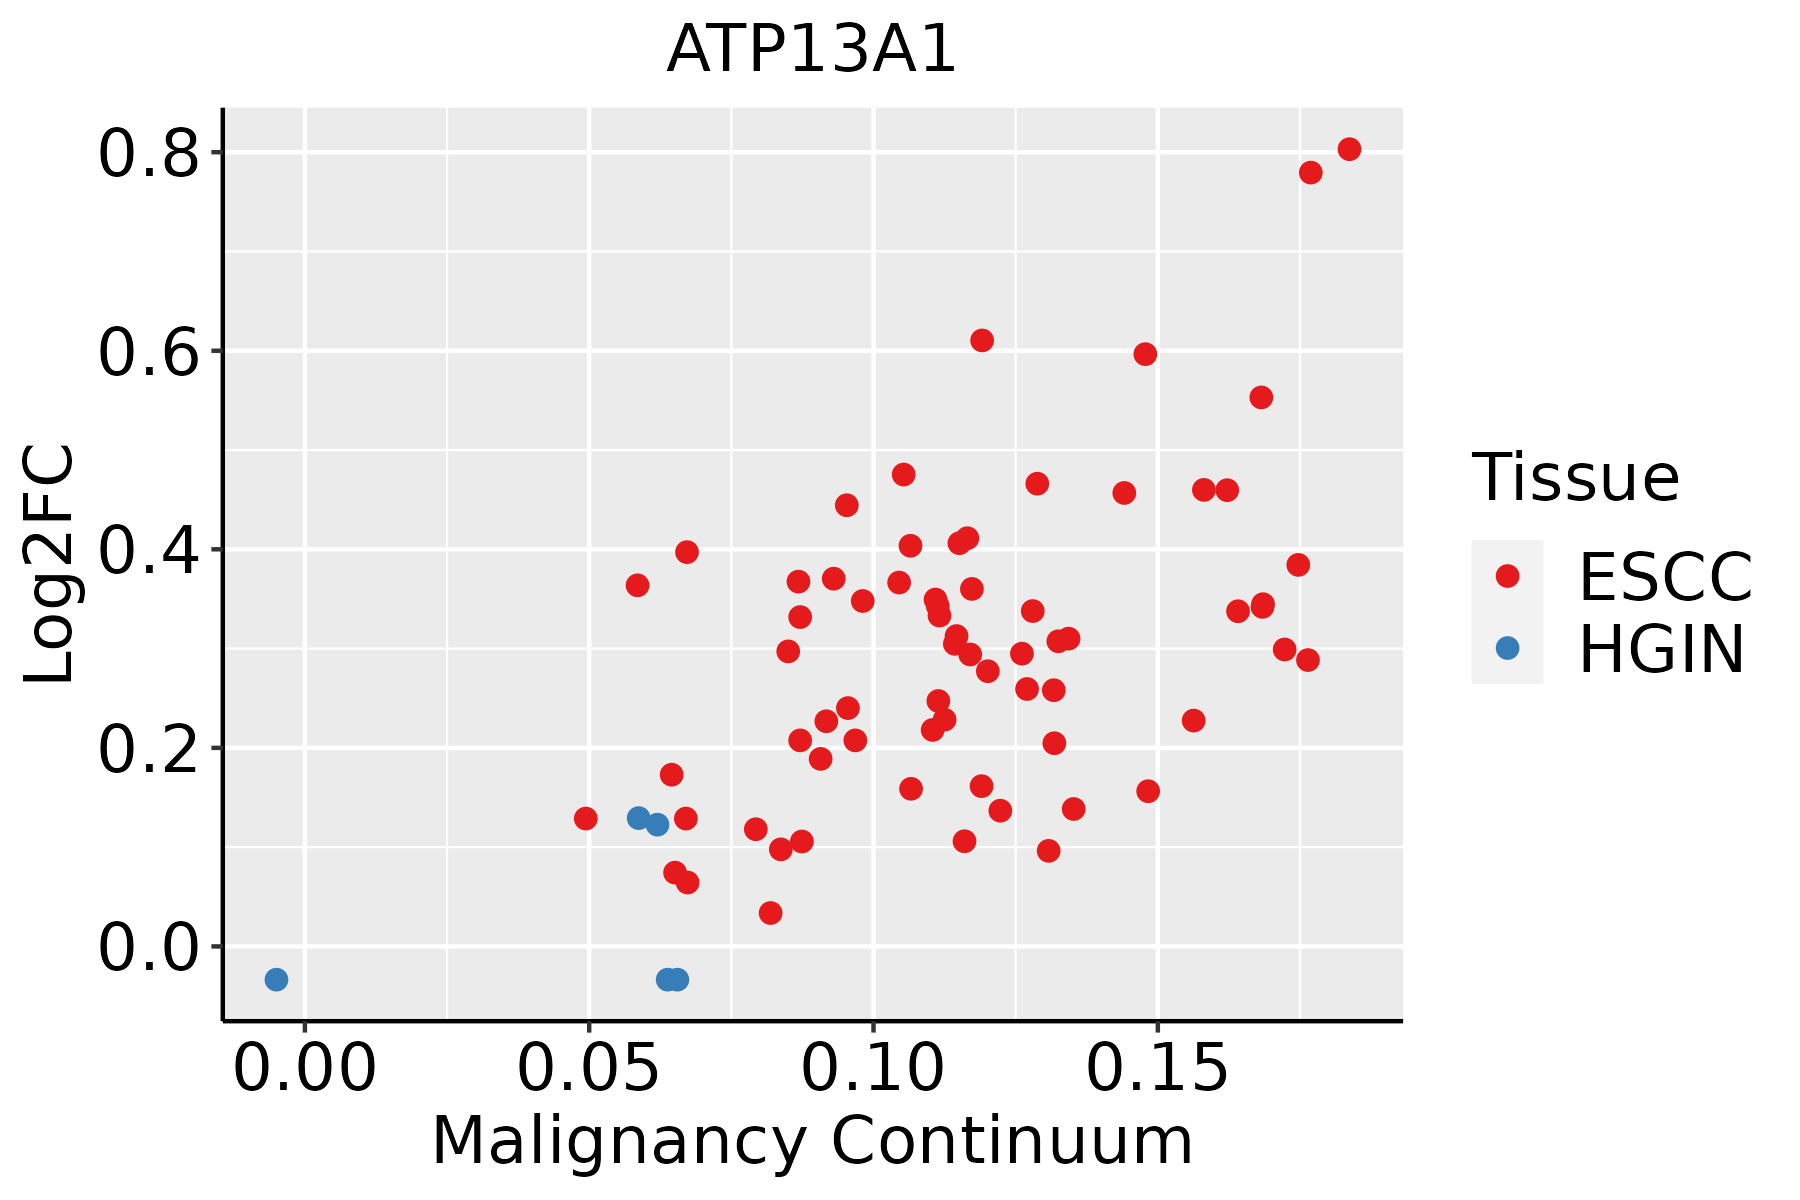 | ESCC: Esophageal squamous cell carcinoma |
| HGIN: High-grade intraepithelial neoplasias | ||
| LGIN: Low-grade intraepithelial neoplasias | ||
| Liver | 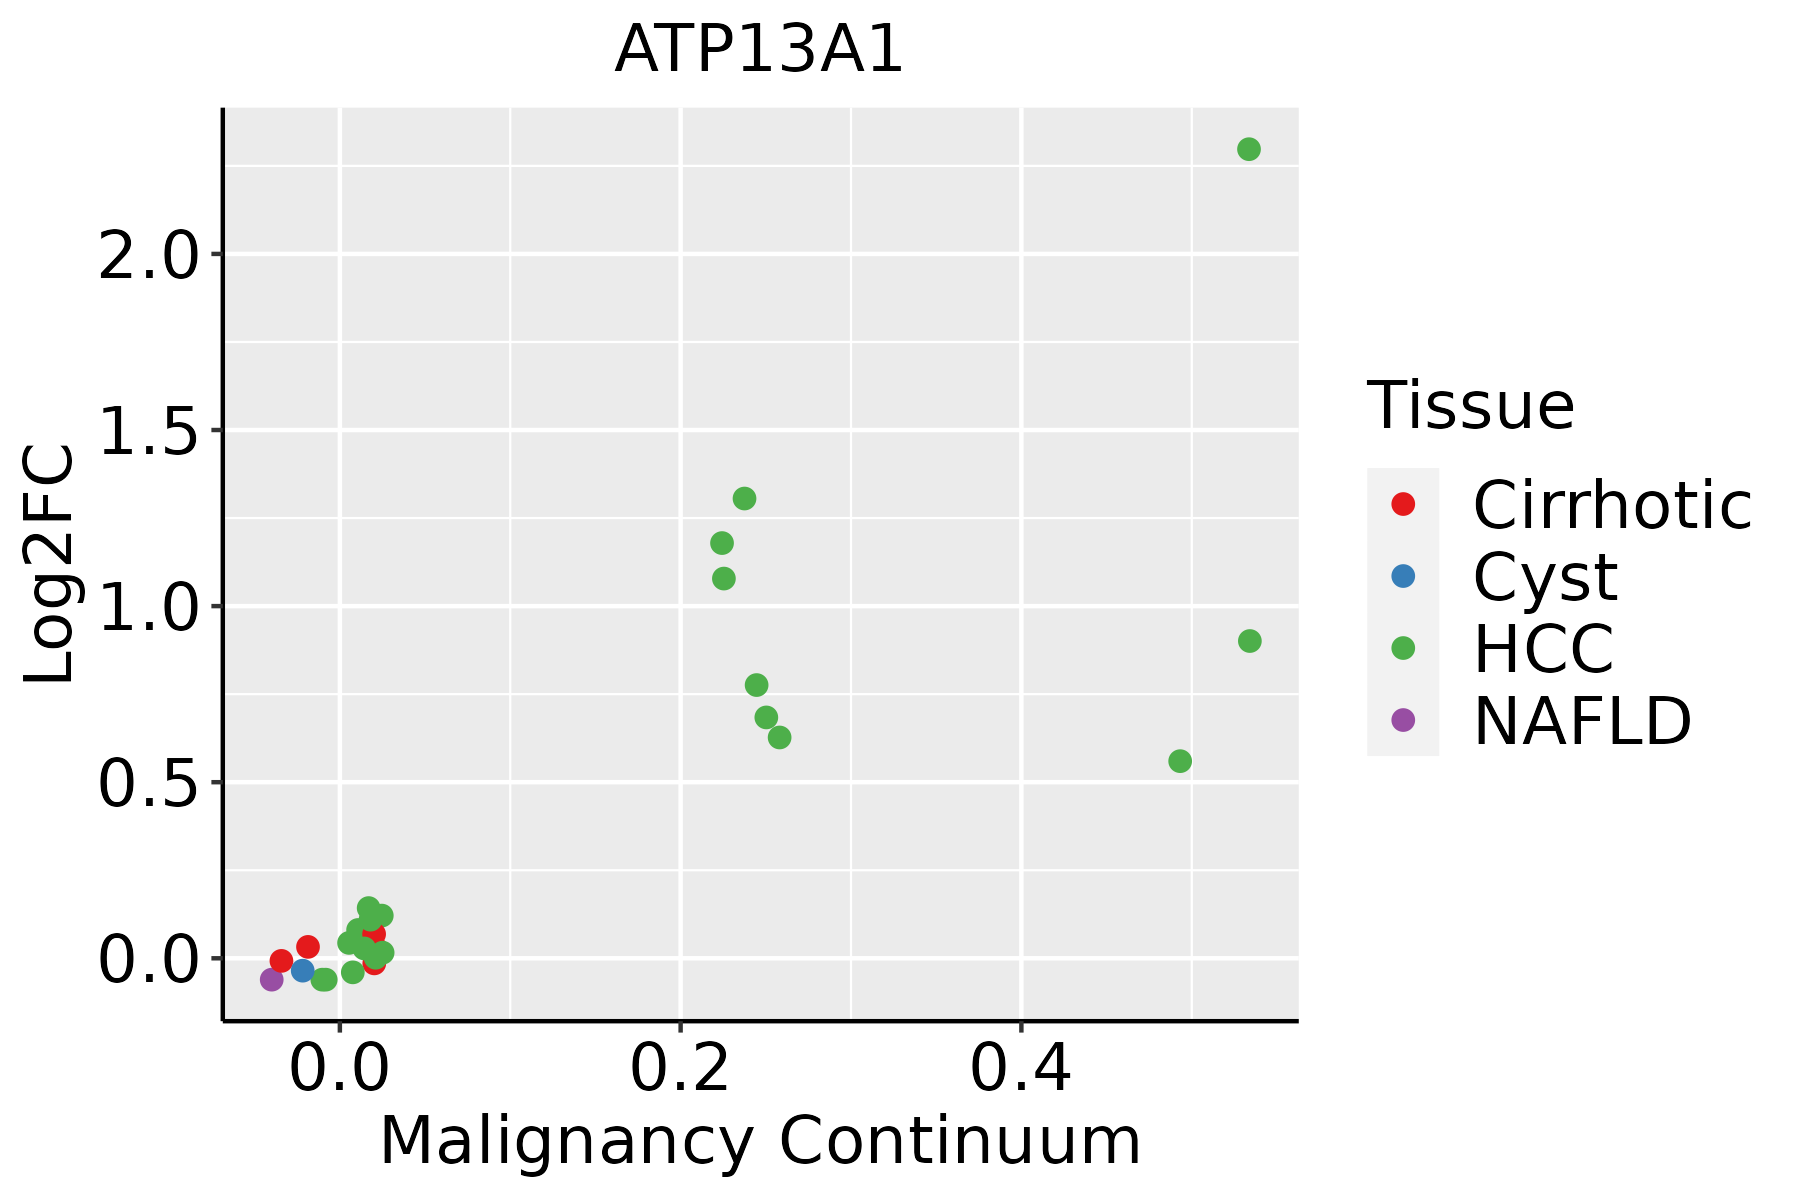 | HCC: Hepatocellular carcinoma |
| NAFLD: Non-alcoholic fatty liver disease | ||
| Oral Cavity | 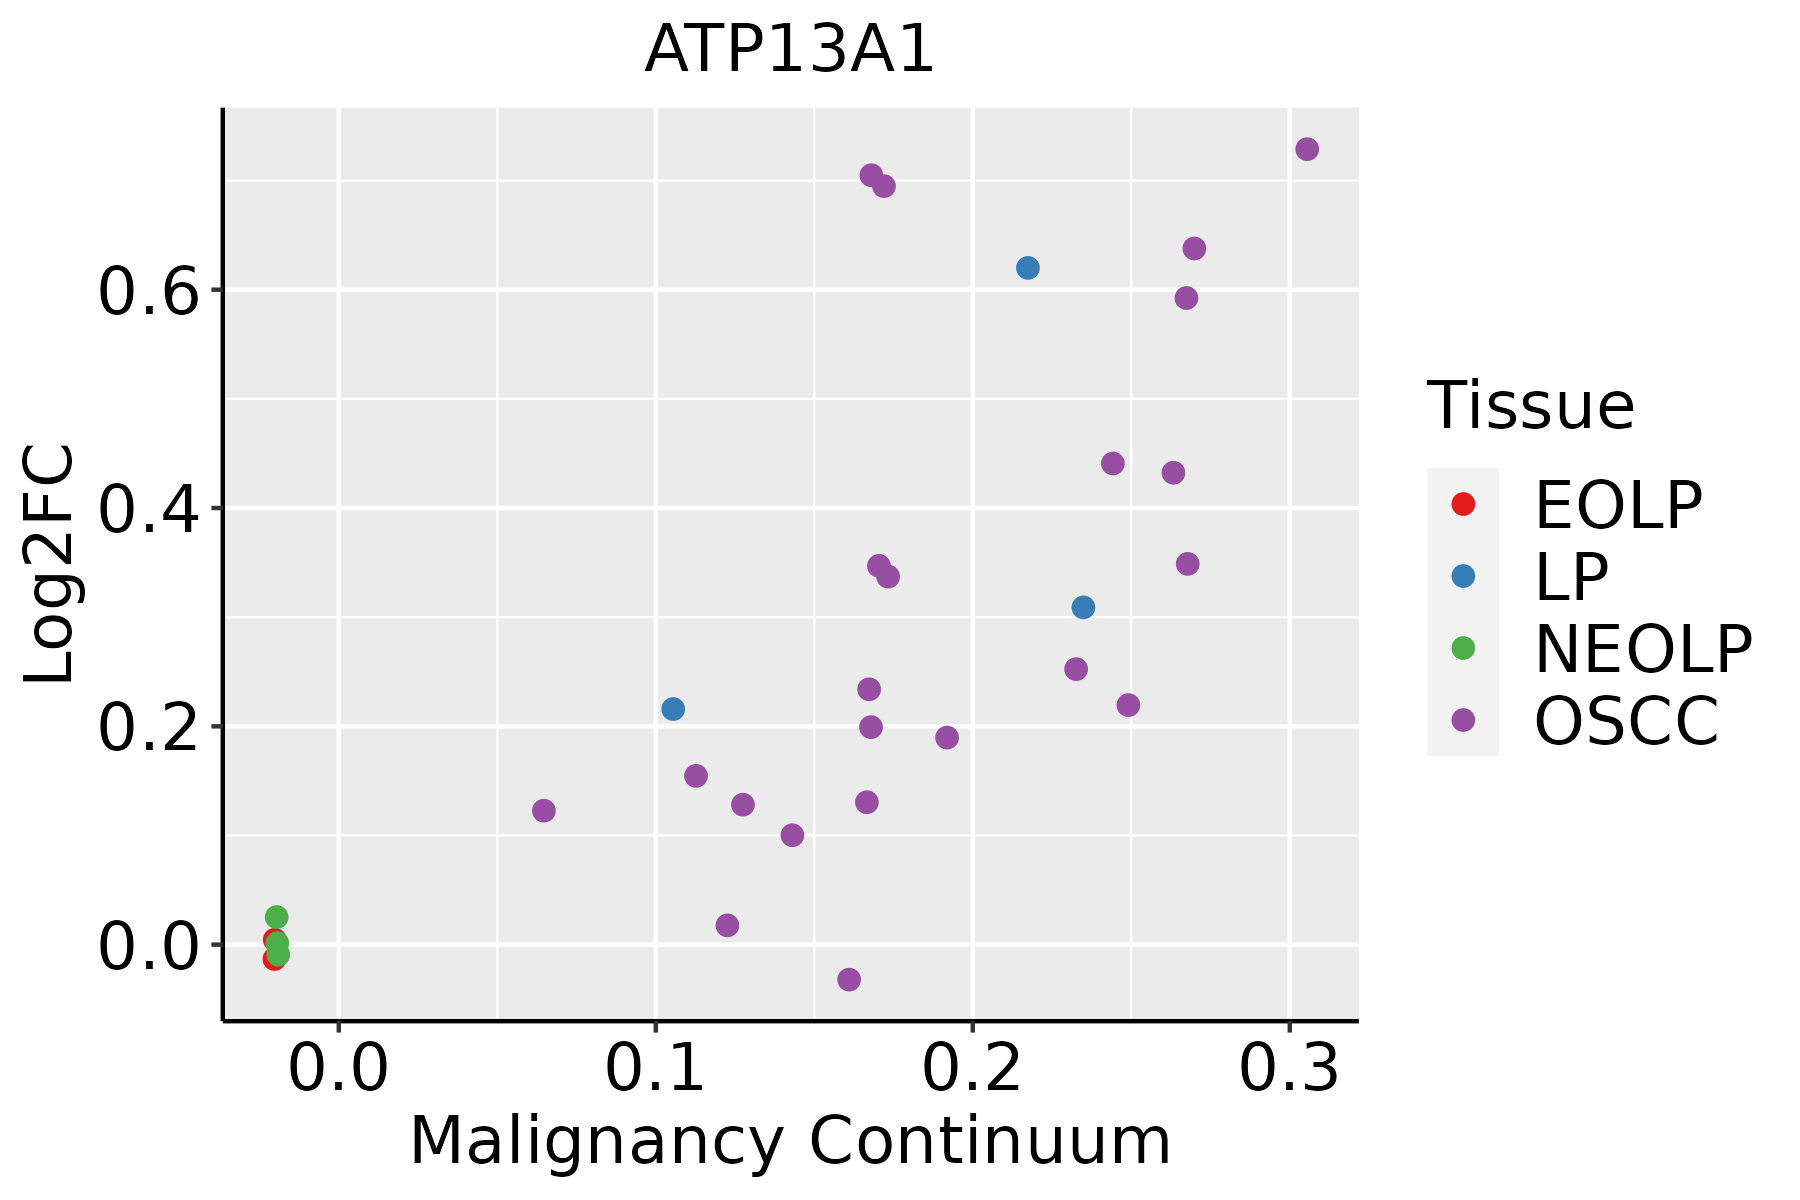 | EOLP: Erosive Oral lichen planus |
| LP: leukoplakia | ||
| NEOLP: Non-erosive oral lichen planus | ||
| OSCC: Oral squamous cell carcinoma | ||
| Thyroid | 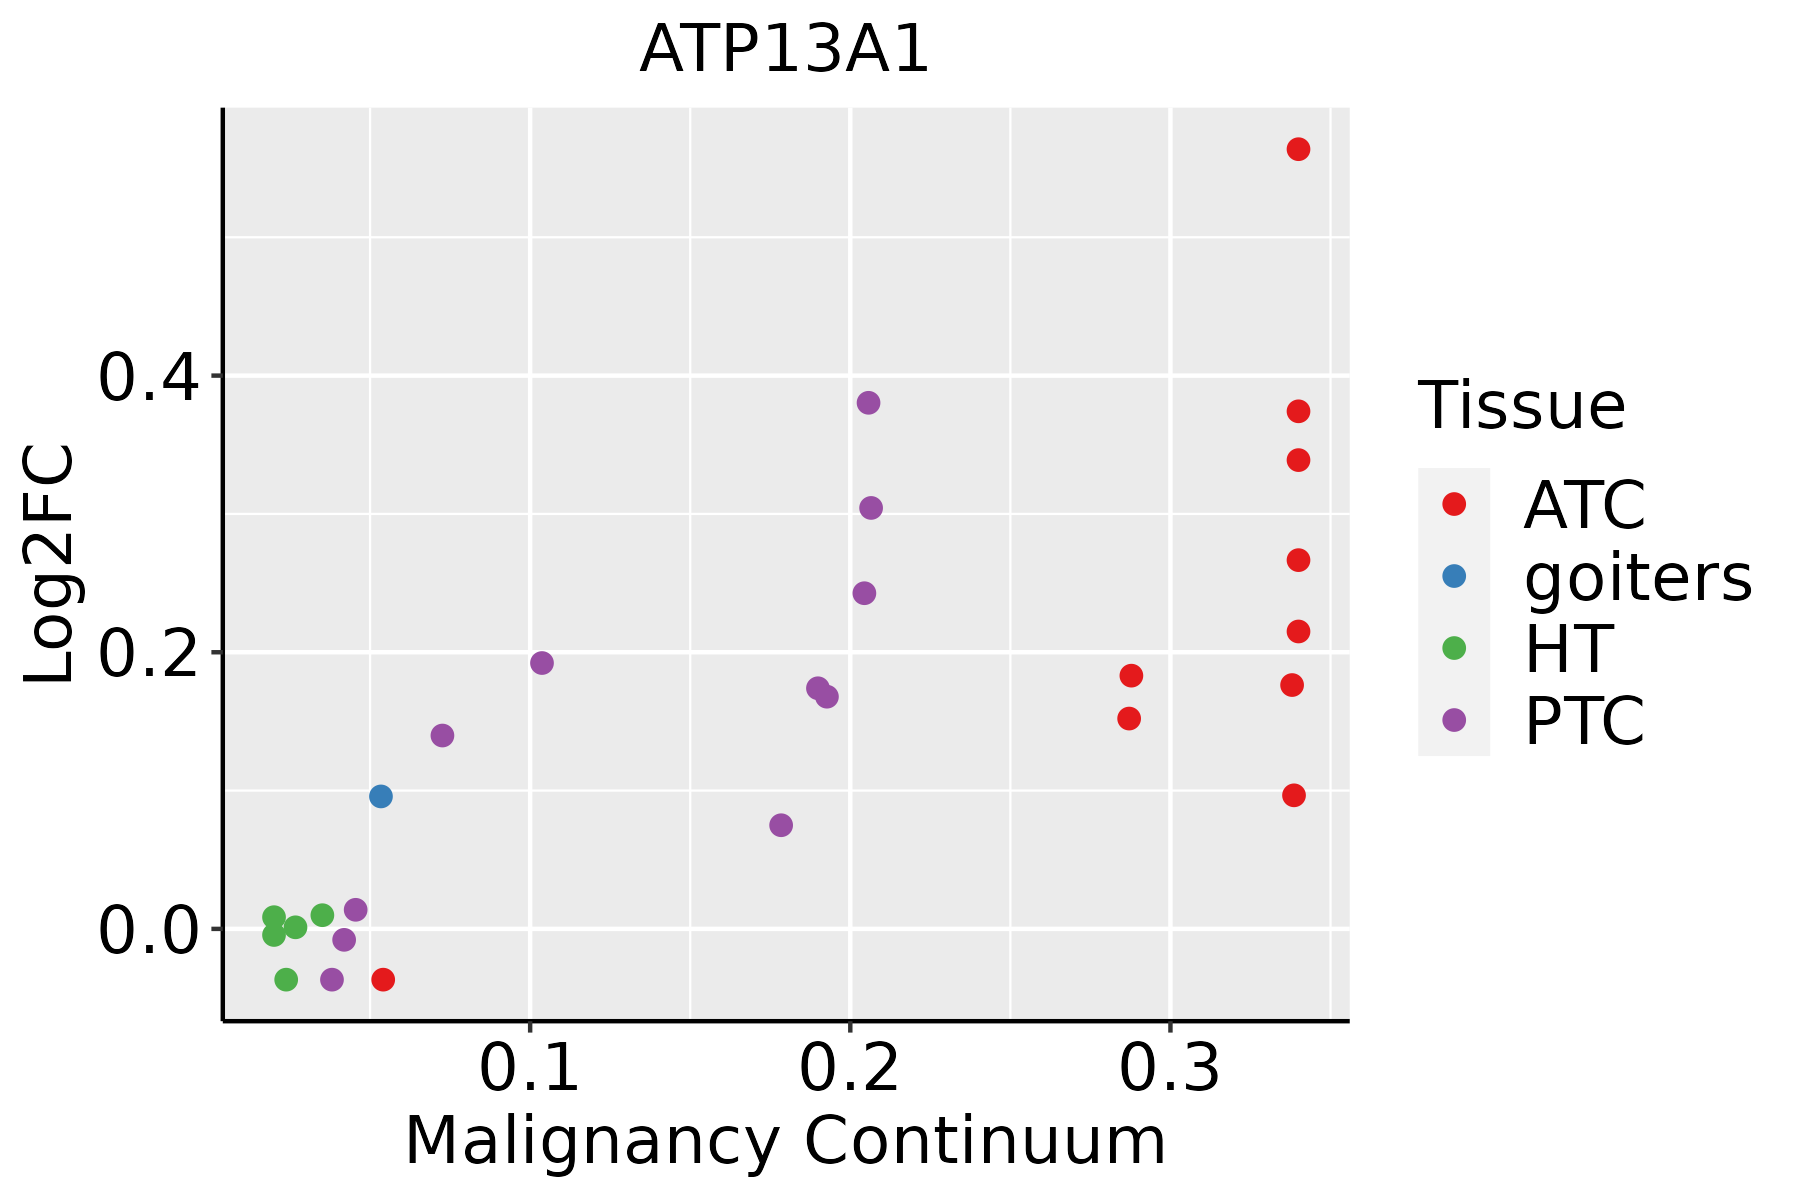 | ATC: Anaplastic thyroid cancer |
| HT: Hashimoto's thyroiditis | ||
| PTC: Papillary thyroid cancer |
| ∗log2FC in expression of this searched gene in stem-like cells from each diseased tissue sample relative to stem-like cells in normal samples in each tissue plotted against the malignancy continuum. Samples are colored based on if they are from different disease stage. |
Top |
Malignant transformation related pathway analysis |
| Find out the enriched GO biological processes and KEGG pathways involved in transition from healthy to precancer to cancer |
| Tissue | Disease Stage | Enriched GO biological Processes |
| Colorectum | AD |  |
| Colorectum | SER |  |
| Colorectum | MSS |  |
| Colorectum | MSI-H |  |
| Colorectum | FAP |  |
| ∗Top 15 enriched GO BP terms are showed in the bar plot of each disease state in each tissue. Each row represents a significant GO biological process which is colored according to the -log10(p.adjust). |
| Page: 1 2 3 4 5 6 7 8 9 |
| GO ID | Tissue | Disease Stage | Description | Gene Ratio | Bg Ratio | pvalue | p.adjust | Count |
| GO:0090150 | Colorectum | AD | establishment of protein localization to membrane | 100/3918 | 260/18723 | 6.01e-11 | 6.33e-09 | 100 |
| GO:0071421 | Colorectum | AD | manganese ion transmembrane transport | 6/3918 | 10/18723 | 8.03e-03 | 4.73e-02 | 6 |
| GO:00901501 | Colorectum | SER | establishment of protein localization to membrane | 68/2897 | 260/18723 | 5.55e-06 | 2.01e-04 | 68 |
| GO:00901502 | Colorectum | MSS | establishment of protein localization to membrane | 90/3467 | 260/18723 | 4.11e-10 | 3.49e-08 | 90 |
| GO:0090150110 | Esophagus | ESCC | establishment of protein localization to membrane | 182/8552 | 260/18723 | 1.27e-15 | 8.19e-14 | 182 |
| GO:00901507 | Liver | Cirrhotic | establishment of protein localization to membrane | 123/4634 | 260/18723 | 1.85e-15 | 2.15e-13 | 123 |
| GO:009015012 | Liver | HCC | establishment of protein localization to membrane | 168/7958 | 260/18723 | 4.07e-13 | 2.13e-11 | 168 |
| GO:00000411 | Liver | HCC | transition metal ion transport | 59/7958 | 105/18723 | 3.18e-03 | 1.47e-02 | 59 |
| GO:009015018 | Oral cavity | OSCC | establishment of protein localization to membrane | 163/7305 | 260/18723 | 7.13e-15 | 4.47e-13 | 163 |
| GO:009015019 | Oral cavity | LP | establishment of protein localization to membrane | 128/4623 | 260/18723 | 7.19e-18 | 1.19e-15 | 128 |
| GO:0090150112 | Thyroid | PTC | establishment of protein localization to membrane | 149/5968 | 260/18723 | 1.64e-17 | 1.59e-15 | 149 |
| GO:009015031 | Thyroid | ATC | establishment of protein localization to membrane | 150/6293 | 260/18723 | 1.05e-15 | 7.96e-14 | 150 |
| Page: 1 |
| Pathway ID | Tissue | Disease Stage | Description | Gene Ratio | Bg Ratio | pvalue | p.adjust | qvalue | Count |
| Page: 1 |
Top |
Cell-cell communication analysis |
| Identification of potential cell-cell interactions between two cell types and their ligand-receptor pairs for different disease states |
| Ligand | Receptor | LRpair | Pathway | Tissue | Disease Stage |
| Page: 1 |
Top |
Single-cell gene regulatory network inference analysis |
| Find out the significant the regulons (TFs) and the target genes of each regulon across cell types for different disease states |
| TF | Cell Type | Tissue | Disease Stage | Target Gene | RSS | Regulon Activity |
| ∗The dot plots of a searched regulon are shown for all cell subpopulations in each disease state of each tissue based on the regulon specific score inferred using pySCENIC and by calculating the average expression. |
| Page: 1 |
Top |
Somatic mutation of malignant transformation related genes |
| Annotation of somatic variants for genes involved in malignant transformation |
| Hugo Symbol | Variant Class | Variant Classification | dbSNP RS | HGVSc | HGVSp | HGVSp Short | SWISSPROT | BIOTYPE | SIFT | PolyPhen | Tumor Sample Barcode | Tissue | Histology | Sex | Age | Stage | Therapy Types | Drugs | Outcome |
| ATP13A1 | SNV | Missense_Mutation | c.1025G>A | p.Arg342Gln | p.R342Q | Q9HD20 | protein_coding | deleterious(0.01) | benign(0.19) | TCGA-D8-A1J8-01 | Breast | breast invasive carcinoma | Female | >=65 | I/II | Hormone Therapy | nolvadex | SD | |
| ATP13A1 | SNV | Missense_Mutation | rs371113170 | c.1030C>G | p.Arg344Gly | p.R344G | Q9HD20 | protein_coding | tolerated(0.06) | benign(0.018) | TCGA-D8-A1XV-01 | Breast | breast invasive carcinoma | Female | >=65 | I/II | Unknown | Unknown | SD |
| ATP13A1 | SNV | Missense_Mutation | c.1180A>G | p.Ile394Val | p.I394V | Q9HD20 | protein_coding | deleterious(0.03) | benign(0.003) | TCGA-D8-A1Y3-01 | Breast | breast invasive carcinoma | Female | <65 | III/IV | Chemotherapy | doxorubicine+cyclophosphamide | SD | |
| ATP13A1 | SNV | Missense_Mutation | rs776378379 | c.824N>T | p.Ala275Val | p.A275V | Q9HD20 | protein_coding | tolerated(0.87) | benign(0.058) | TCGA-LL-A8F5-01 | Breast | breast invasive carcinoma | Female | <65 | I/II | Chemotherapy | cyclophosphamide | SD |
| ATP13A1 | insertion | Frame_Shift_Ins | novel | c.2227-1_2227insTGCTGGGGTCCGAGTGGAGGGA | p.Val743CysfsTer30 | p.V743Cfs*30 | Q9HD20 | protein_coding | TCGA-B6-A0IE-01 | Breast | breast invasive carcinoma | Female | <65 | III/IV | Unknown | Unknown | PD | ||
| ATP13A1 | SNV | Missense_Mutation | novel | c.3515N>C | p.Val1172Ala | p.V1172A | Q9HD20 | protein_coding | tolerated(0.63) | benign(0.012) | TCGA-2W-A8YY-01 | Cervix | cervical & endocervical cancer | Female | <65 | I/II | Chemotherapy | cisplatin | CR |
| ATP13A1 | SNV | Missense_Mutation | novel | c.2611N>A | p.Ala871Thr | p.A871T | Q9HD20 | protein_coding | deleterious(0) | probably_damaging(1) | TCGA-2W-A8YY-01 | Cervix | cervical & endocervical cancer | Female | <65 | I/II | Chemotherapy | cisplatin | CR |
| ATP13A1 | SNV | Missense_Mutation | novel | c.1163N>T | p.Thr388Ile | p.T388I | Q9HD20 | protein_coding | deleterious(0) | probably_damaging(1) | TCGA-2W-A8YY-01 | Cervix | cervical & endocervical cancer | Female | <65 | I/II | Chemotherapy | cisplatin | CR |
| ATP13A1 | SNV | Missense_Mutation | c.3022N>A | p.Glu1008Lys | p.E1008K | Q9HD20 | protein_coding | tolerated(0.1) | benign(0.011) | TCGA-DR-A0ZM-01 | Cervix | cervical & endocervical cancer | Female | <65 | III/IV | Unspecific | Cisplatin | SD | |
| ATP13A1 | SNV | Missense_Mutation | rs769521754 | c.3221G>A | p.Arg1074His | p.R1074H | Q9HD20 | protein_coding | tolerated(0.21) | benign(0.001) | TCGA-EA-A410-01 | Cervix | cervical & endocervical cancer | Female | <65 | I/II | Unknown | Unknown | SD |
| Page: 1 2 3 4 5 6 7 8 9 10 11 |
Top |
Related drugs of malignant transformation related genes |
| Identification of chemicals and drugs interact with genes involved in malignant transfromation |
| (DGIdb 4.0) |
| Entrez ID | Symbol | Category | Interaction Types | Drug Claim Name | Drug Name | PMIDs |
| Page: 1 |

Copyright 2023-Present -The University of Texas Health Science Center at Houston |