
|
|||||
|
 | |
| |
| |
| |
| |
| |
|
Gene: ATP11C |
Gene summary for ATP11C |
| Gene information | Species | Human | Gene symbol | ATP11C | Gene ID | 286410 |
| Gene name | ATPase phospholipid transporting 11C | |
| Gene Alias | ATPIG | |
| Cytomap | Xq27.1 | |
| Gene Type | protein-coding | GO ID | GO:0006810 | UniProtAcc | Q8NB49 |
Top |
Malignant transformation analysis |
| Identification of the aberrant gene expression in precancerous and cancerous lesions by comparing the gene expression of stem-like cells in diseased tissues with normal stem cells |
| Entrez ID | Symbol | Replicates | Species | Organ | Tissue | Adj P-value | Log2FC | Malignancy |
| 286410 | ATP11C | GSM6177620_NYU_UCEC1_lib2_lib2 | Human | Endometrium | EEC | 1.12e-04 | -1.02e-02 | -0.1875 |
| 286410 | ATP11C | GSM6177620_NYU_UCEC1_lib3_lib3 | Human | Endometrium | EEC | 1.90e-02 | -3.00e-02 | -0.1883 |
| 286410 | ATP11C | GSM6177622_NYU_UCEC3_lib2_lib2 | Human | Endometrium | EEC | 1.20e-04 | -4.19e-02 | -0.1916 |
| 286410 | ATP11C | GSM5252137_BPH556PrGA2_Fcol | Human | Prostate | BPH | 2.04e-03 | 3.59e-01 | -0.23 |
| 286410 | ATP11C | 047563_1562-all-cells | Human | Prostate | BPH | 1.01e-02 | 1.56e-01 | 0.0791 |
| 286410 | ATP11C | 048752_1579-all-cells | Human | Prostate | BPH | 2.40e-14 | 4.61e-01 | 0.1008 |
| 286410 | ATP11C | 052095_1628-all-cells | Human | Prostate | BPH | 1.41e-25 | 6.66e-01 | 0.1032 |
| 286410 | ATP11C | 052097_1595-all-cells | Human | Prostate | BPH | 2.77e-08 | 3.00e-01 | 0.0972 |
| 286410 | ATP11C | 052099_1652-all-cells | Human | Prostate | BPH | 1.82e-17 | 4.97e-01 | 0.1038 |
| 286410 | ATP11C | Dong_P5 | Human | Prostate | Tumor | 1.01e-05 | -3.06e-02 | 0.053 |
| 286410 | ATP11C | GSM5353236_PA_PR5251_T1_S7_L001 | Human | Prostate | Tumor | 1.19e-04 | 6.12e-01 | 0.1608 |
| 286410 | ATP11C | GSM5353237_PA_PR5251_T2_S8_L001 | Human | Prostate | Tumor | 3.32e-03 | 6.51e-01 | 0.1622 |
| 286410 | ATP11C | PTC05 | Human | Thyroid | PTC | 2.10e-03 | 1.04e-01 | 0.2065 |
| 286410 | ATP11C | PTC06 | Human | Thyroid | PTC | 1.51e-05 | 1.05e-01 | 0.2057 |
| 286410 | ATP11C | PTC07 | Human | Thyroid | PTC | 3.59e-04 | 6.24e-02 | 0.2044 |
| 286410 | ATP11C | ATC09 | Human | Thyroid | ATC | 1.94e-03 | 2.20e-01 | 0.2871 |
| 286410 | ATP11C | ATC11 | Human | Thyroid | ATC | 4.30e-08 | 5.83e-01 | 0.3386 |
| 286410 | ATP11C | ATC12 | Human | Thyroid | ATC | 1.25e-08 | 3.03e-01 | 0.34 |
| 286410 | ATP11C | ATC13 | Human | Thyroid | ATC | 4.26e-10 | 2.39e-01 | 0.34 |
| 286410 | ATP11C | ATC1 | Human | Thyroid | ATC | 3.04e-04 | 2.63e-01 | 0.2878 |
| Page: 1 2 |
| Tissue | Expression Dynamics | Abbreviation |
| Endometrium |  | AEH: Atypical endometrial hyperplasia |
| EEC: Endometrioid Cancer | ||
| Prostate | 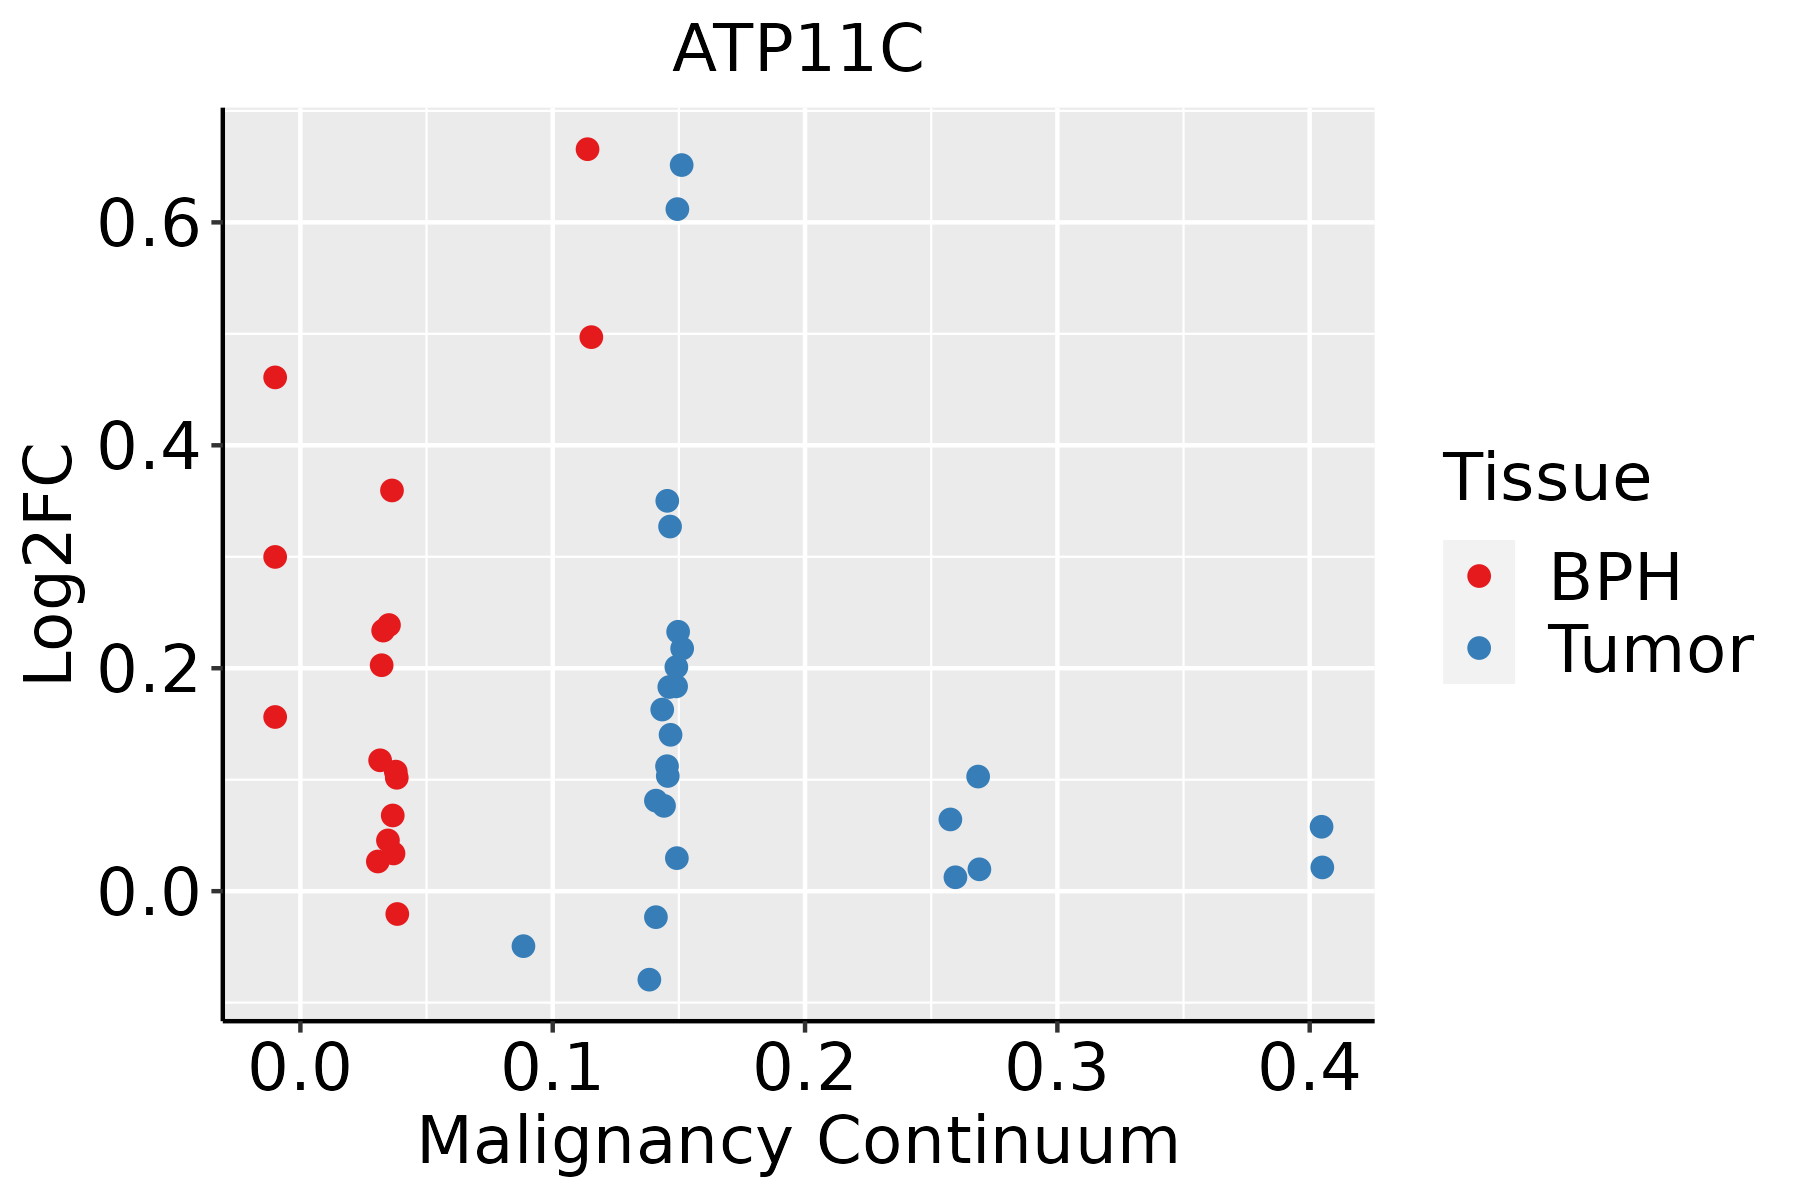 | BPH: Benign Prostatic Hyperplasia |
| Thyroid | 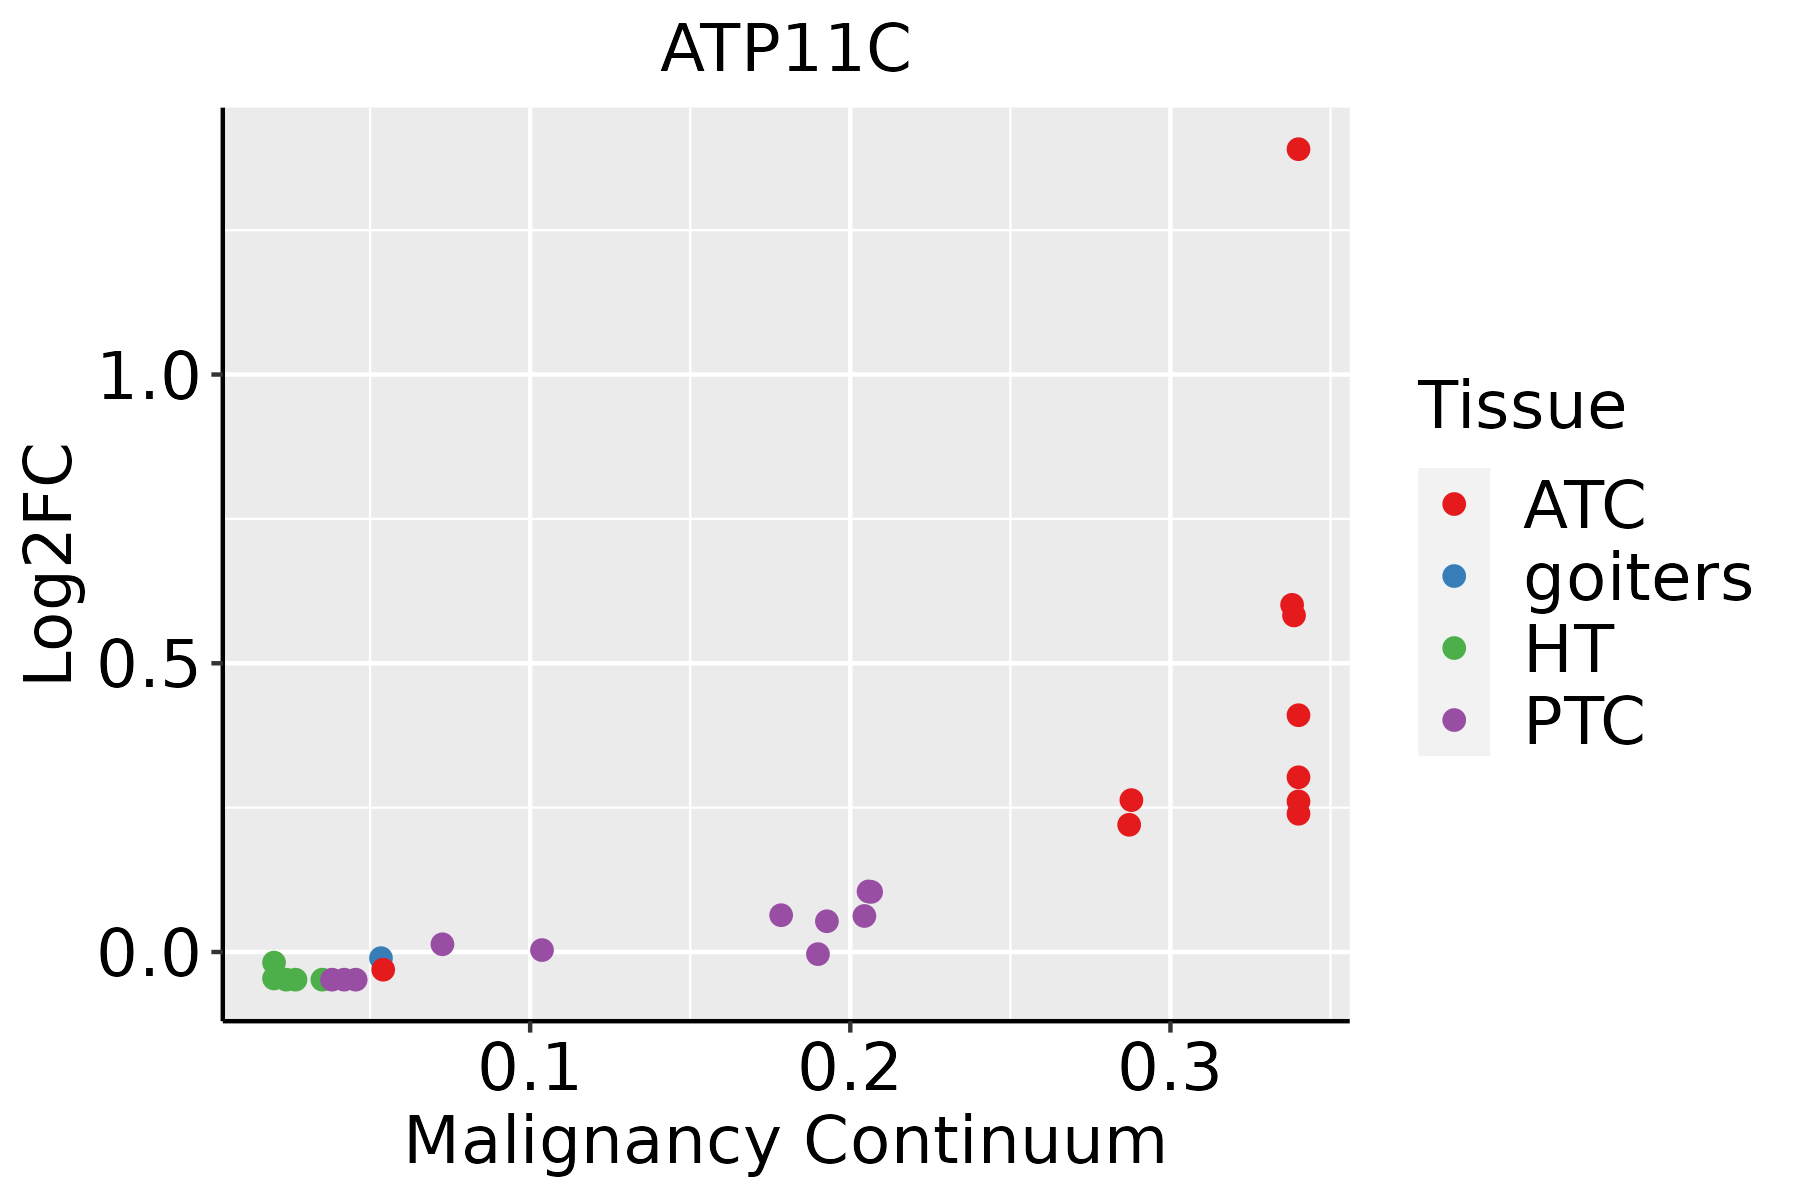 | ATC: Anaplastic thyroid cancer |
| HT: Hashimoto's thyroiditis | ||
| PTC: Papillary thyroid cancer |
| ∗log2FC in expression of this searched gene in stem-like cells from each diseased tissue sample relative to stem-like cells in normal samples in each tissue plotted against the malignancy continuum. Samples are colored based on if they are from different disease stage. |
Top |
Malignant transformation related pathway analysis |
| Find out the enriched GO biological processes and KEGG pathways involved in transition from healthy to precancer to cancer |
| Tissue | Disease Stage | Enriched GO biological Processes |
| Colorectum | AD |  |
| Colorectum | SER |  |
| Colorectum | MSS |  |
| Colorectum | MSI-H |  |
| Colorectum | FAP |  |
| ∗Top 15 enriched GO BP terms are showed in the bar plot of each disease state in each tissue. Each row represents a significant GO biological process which is colored according to the -log10(p.adjust). |
| Page: 1 2 3 4 5 6 7 8 9 |
| GO ID | Tissue | Disease Stage | Description | Gene Ratio | Bg Ratio | pvalue | p.adjust | Count |
| Page: 1 |
| Pathway ID | Tissue | Disease Stage | Description | Gene Ratio | Bg Ratio | pvalue | p.adjust | qvalue | Count |
| Page: 1 |
Top |
Cell-cell communication analysis |
| Identification of potential cell-cell interactions between two cell types and their ligand-receptor pairs for different disease states |
| Ligand | Receptor | LRpair | Pathway | Tissue | Disease Stage |
| Page: 1 |
Top |
Single-cell gene regulatory network inference analysis |
| Find out the significant the regulons (TFs) and the target genes of each regulon across cell types for different disease states |
| TF | Cell Type | Tissue | Disease Stage | Target Gene | RSS | Regulon Activity |
| ∗The dot plots of a searched regulon are shown for all cell subpopulations in each disease state of each tissue based on the regulon specific score inferred using pySCENIC and by calculating the average expression. |
| Page: 1 |
Top |
Somatic mutation of malignant transformation related genes |
| Annotation of somatic variants for genes involved in malignant transformation |
| Hugo Symbol | Variant Class | Variant Classification | dbSNP RS | HGVSc | HGVSp | HGVSp Short | SWISSPROT | BIOTYPE | SIFT | PolyPhen | Tumor Sample Barcode | Tissue | Histology | Sex | Age | Stage | Therapy Types | Drugs | Outcome |
| ATP11C | SNV | Missense_Mutation | c.1571N>C | p.Arg524Thr | p.R524T | Q8NB49 | protein_coding | tolerated(0.11) | benign(0.232) | TCGA-A8-A081-01 | Breast | breast invasive carcinoma | Female | >=65 | I/II | Unknown | Unknown | SD | |
| ATP11C | SNV | Missense_Mutation | c.2599C>G | p.His867Asp | p.H867D | Q8NB49 | protein_coding | deleterious(0) | probably_damaging(0.998) | TCGA-A8-A09C-01 | Breast | breast invasive carcinoma | Female | >=65 | I/II | Unknown | Unknown | SD | |
| ATP11C | SNV | Missense_Mutation | novel | c.1868T>C | p.Met623Thr | p.M623T | Q8NB49 | protein_coding | tolerated(1) | benign(0.099) | TCGA-AC-A2FM-01 | Breast | breast invasive carcinoma | Female | >=65 | I/II | Unknown | Unknown | PD |
| ATP11C | SNV | Missense_Mutation | novel | c.2620G>T | p.Ala874Ser | p.A874S | Q8NB49 | protein_coding | tolerated(0.59) | benign(0.145) | TCGA-AN-A046-01 | Breast | breast invasive carcinoma | Female | >=65 | I/II | Unknown | Unknown | SD |
| ATP11C | SNV | Missense_Mutation | c.2408N>T | p.Arg803Ile | p.R803I | Q8NB49 | protein_coding | deleterious(0) | possibly_damaging(0.908) | TCGA-B6-A0X5-01 | Breast | breast invasive carcinoma | Female | <65 | I/II | Unknown | Unknown | PD | |
| ATP11C | SNV | Missense_Mutation | c.475N>T | p.Pro159Ser | p.P159S | Q8NB49 | protein_coding | deleterious(0) | probably_damaging(1) | TCGA-BH-A0BP-01 | Breast | breast invasive carcinoma | Female | >=65 | I/II | Unknown | Unknown | SD | |
| ATP11C | SNV | Missense_Mutation | c.1215N>T | p.Gln405His | p.Q405H | Q8NB49 | protein_coding | deleterious(0) | probably_damaging(0.998) | TCGA-C8-A274-01 | Breast | breast invasive carcinoma | Female | <65 | I/II | Hormone Therapy | tamoxiphen | SD | |
| ATP11C | SNV | Missense_Mutation | c.3028N>A | p.Val1010Ile | p.V1010I | Q8NB49 | protein_coding | deleterious(0.01) | possibly_damaging(0.78) | TCGA-EW-A1OZ-01 | Breast | breast invasive carcinoma | Female | <65 | I/II | Targeted Molecular therapy | trastuzumab | SD | |
| ATP11C | insertion | Frame_Shift_Ins | novel | c.279_280insTGTTTAGATTTTAAGGGAAATGGAT | p.Ser94CysfsTer9 | p.S94Cfs*9 | Q8NB49 | protein_coding | TCGA-AO-A0J5-01 | Breast | breast invasive carcinoma | Female | <65 | III/IV | Other, specify in notesBisphosphonate | zoledronic | PD | ||
| ATP11C | SNV | Missense_Mutation | c.11G>A | p.Arg4Gln | p.R4Q | protein_coding | tolerated_low_confidence(0.28) | benign(0.015) | TCGA-EK-A2RN-01 | Cervix | cervical & endocervical cancer | Female | <65 | I/II | Unknown | Unknown | SD |
| Page: 1 2 3 4 5 6 7 8 9 10 11 12 13 14 15 16 17 18 |
Top |
Related drugs of malignant transformation related genes |
| Identification of chemicals and drugs interact with genes involved in malignant transfromation |
| (DGIdb 4.0) |
| Entrez ID | Symbol | Category | Interaction Types | Drug Claim Name | Drug Name | PMIDs |
| Page: 1 |

Copyright 2023-Present -The University of Texas Health Science Center at Houston |