
|
|||||
|
 | |
| |
| |
| |
| |
| |
|
Gene: ATP11B |
Gene summary for ATP11B |
| Gene information | Species | Human | Gene symbol | ATP11B | Gene ID | 23200 |
| Gene name | ATPase phospholipid transporting 11B (putative) | |
| Gene Alias | ATPIF | |
| Cytomap | 3q26.33 | |
| Gene Type | protein-coding | GO ID | GO:0006810 | UniProtAcc | B4DKX1 |
Top |
Malignant transformation analysis |
| Identification of the aberrant gene expression in precancerous and cancerous lesions by comparing the gene expression of stem-like cells in diseased tissues with normal stem cells |
| Entrez ID | Symbol | Replicates | Species | Organ | Tissue | Adj P-value | Log2FC | Malignancy |
| 23200 | ATP11B | CCI_1 | Human | Cervix | CC | 7.29e-13 | 1.18e+00 | 0.528 |
| 23200 | ATP11B | CCI_2 | Human | Cervix | CC | 5.08e-11 | 1.60e+00 | 0.5249 |
| 23200 | ATP11B | CCI_3 | Human | Cervix | CC | 1.31e-19 | 1.44e+00 | 0.516 |
| 23200 | ATP11B | sample3 | Human | Cervix | CC | 6.68e-16 | 3.84e-01 | 0.1387 |
| 23200 | ATP11B | T3 | Human | Cervix | CC | 1.08e-08 | 3.52e-01 | 0.1389 |
| 23200 | ATP11B | HTA11_3410_2000001011 | Human | Colorectum | AD | 6.20e-09 | 5.25e-01 | 0.0155 |
| 23200 | ATP11B | HTA11_2487_2000001011 | Human | Colorectum | SER | 2.63e-15 | 1.04e+00 | -0.1808 |
| 23200 | ATP11B | HTA11_1938_2000001011 | Human | Colorectum | AD | 1.26e-24 | 1.48e+00 | -0.0811 |
| 23200 | ATP11B | HTA11_78_2000001011 | Human | Colorectum | AD | 5.87e-16 | 1.33e+00 | -0.1088 |
| 23200 | ATP11B | HTA11_347_2000001011 | Human | Colorectum | AD | 4.62e-43 | 1.31e+00 | -0.1954 |
| 23200 | ATP11B | HTA11_411_2000001011 | Human | Colorectum | SER | 4.11e-03 | 7.29e-01 | -0.2602 |
| 23200 | ATP11B | HTA11_2112_2000001011 | Human | Colorectum | SER | 3.51e-03 | 7.01e-01 | -0.2196 |
| 23200 | ATP11B | HTA11_3361_2000001011 | Human | Colorectum | AD | 2.12e-07 | 6.72e-01 | -0.1207 |
| 23200 | ATP11B | HTA11_696_2000001011 | Human | Colorectum | AD | 1.24e-08 | 6.40e-01 | -0.1464 |
| 23200 | ATP11B | HTA11_1391_2000001011 | Human | Colorectum | AD | 1.85e-04 | 4.57e-01 | -0.059 |
| 23200 | ATP11B | HTA11_546_2000001011 | Human | Colorectum | AD | 3.97e-02 | 4.75e-01 | -0.0842 |
| 23200 | ATP11B | HTA11_4255_2000001011 | Human | Colorectum | SER | 1.94e-04 | 7.22e-01 | 0.0446 |
| 23200 | ATP11B | HTA11_10711_2000001011 | Human | Colorectum | AD | 1.39e-03 | -4.22e-01 | 0.0338 |
| 23200 | ATP11B | HTA11_7696_3000711011 | Human | Colorectum | AD | 2.04e-03 | -2.98e-01 | 0.0674 |
| 23200 | ATP11B | HTA11_6818_2000001021 | Human | Colorectum | AD | 2.86e-03 | -3.44e-01 | 0.0588 |
| Page: 1 2 3 4 5 6 7 8 9 10 |
| Tissue | Expression Dynamics | Abbreviation |
| Cervix |  | CC: Cervix cancer |
| HSIL_HPV: HPV-infected high-grade squamous intraepithelial lesions | ||
| N_HPV: HPV-infected normal cervix | ||
| Colorectum (GSE201348) |  | FAP: Familial adenomatous polyposis |
| CRC: Colorectal cancer | ||
| Colorectum (HTA11) |  | AD: Adenomas |
| SER: Sessile serrated lesions | ||
| MSI-H: Microsatellite-high colorectal cancer | ||
| MSS: Microsatellite stable colorectal cancer | ||
| Esophagus |  | ESCC: Esophageal squamous cell carcinoma |
| HGIN: High-grade intraepithelial neoplasias | ||
| LGIN: Low-grade intraepithelial neoplasias | ||
| Lung | 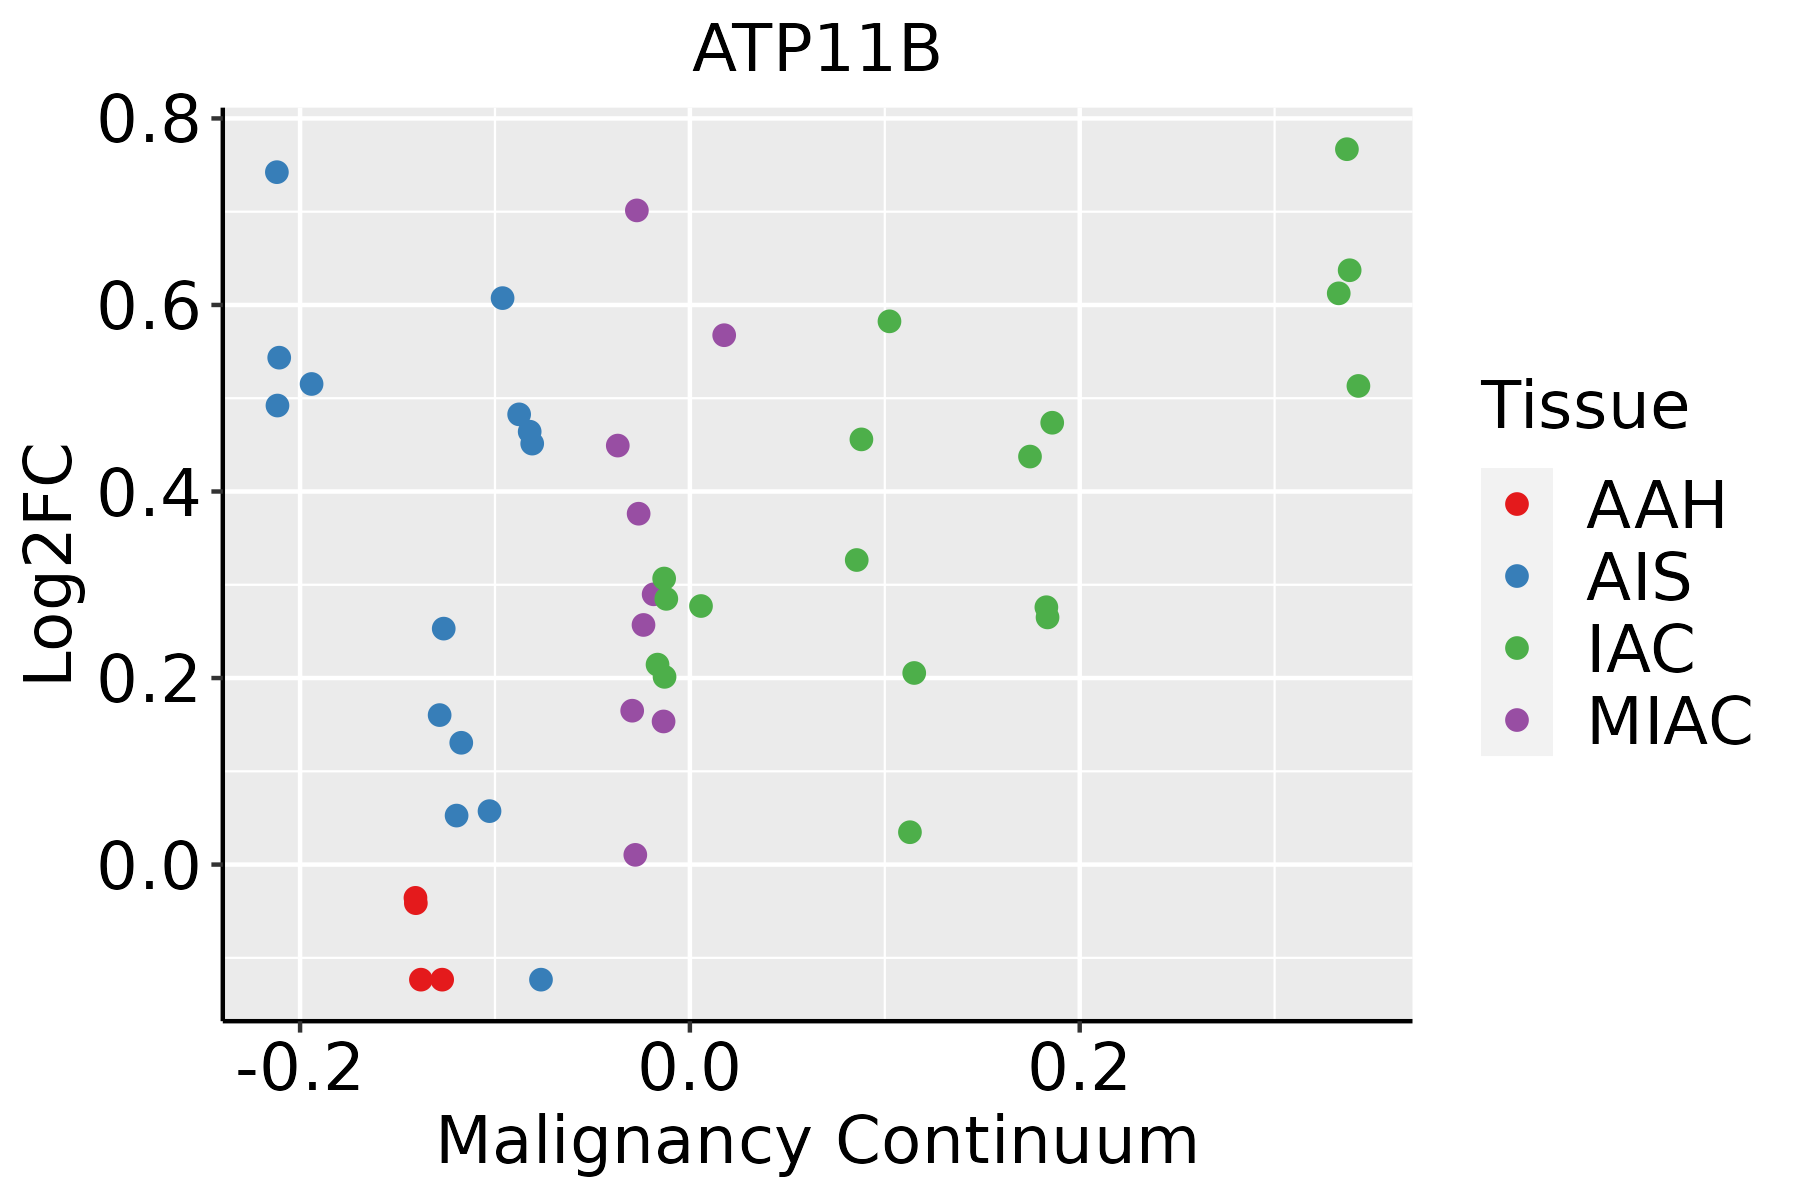 | AAH: Atypical adenomatous hyperplasia |
| AIS: Adenocarcinoma in situ | ||
| IAC: Invasive lung adenocarcinoma | ||
| MIA: Minimally invasive adenocarcinoma | ||
| Oral Cavity |  | EOLP: Erosive Oral lichen planus |
| LP: leukoplakia | ||
| NEOLP: Non-erosive oral lichen planus | ||
| OSCC: Oral squamous cell carcinoma | ||
| Prostate | 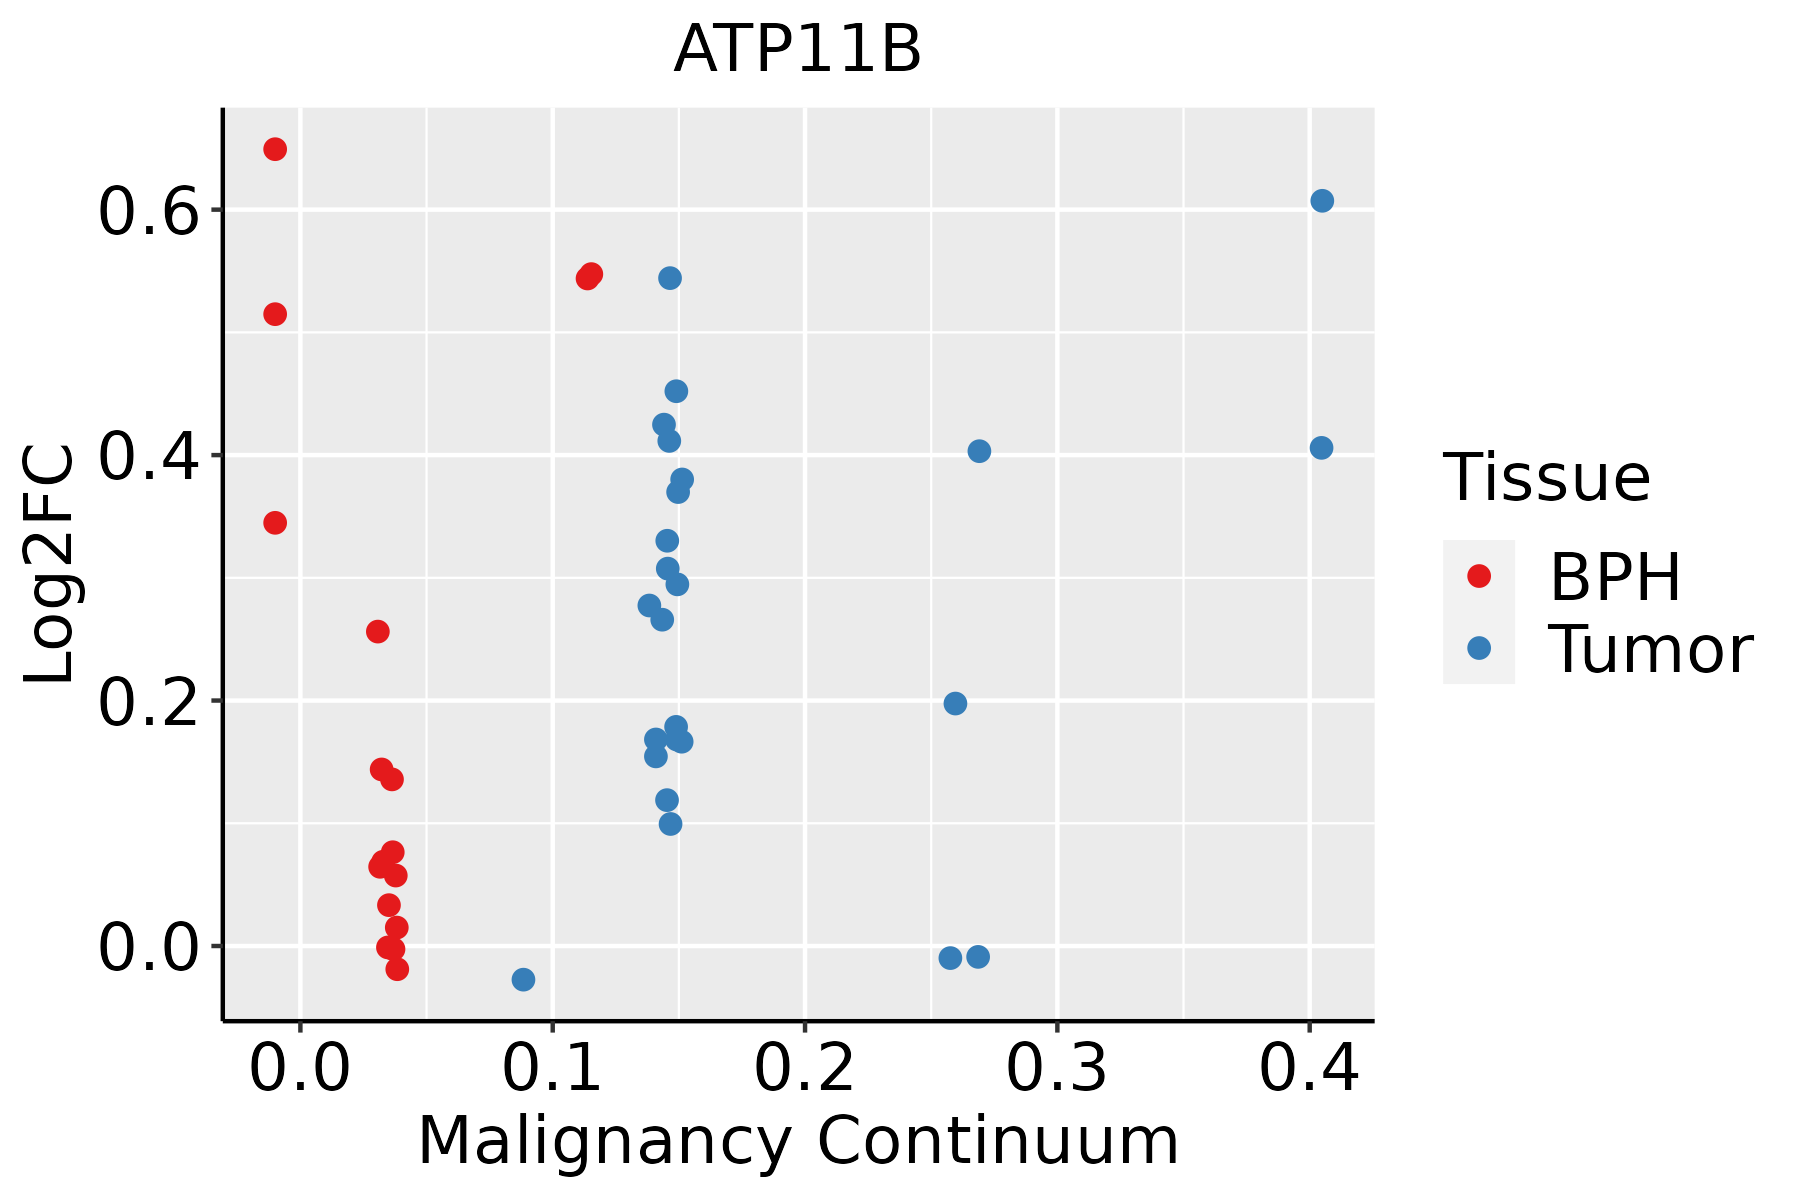 | BPH: Benign Prostatic Hyperplasia |
| Skin | 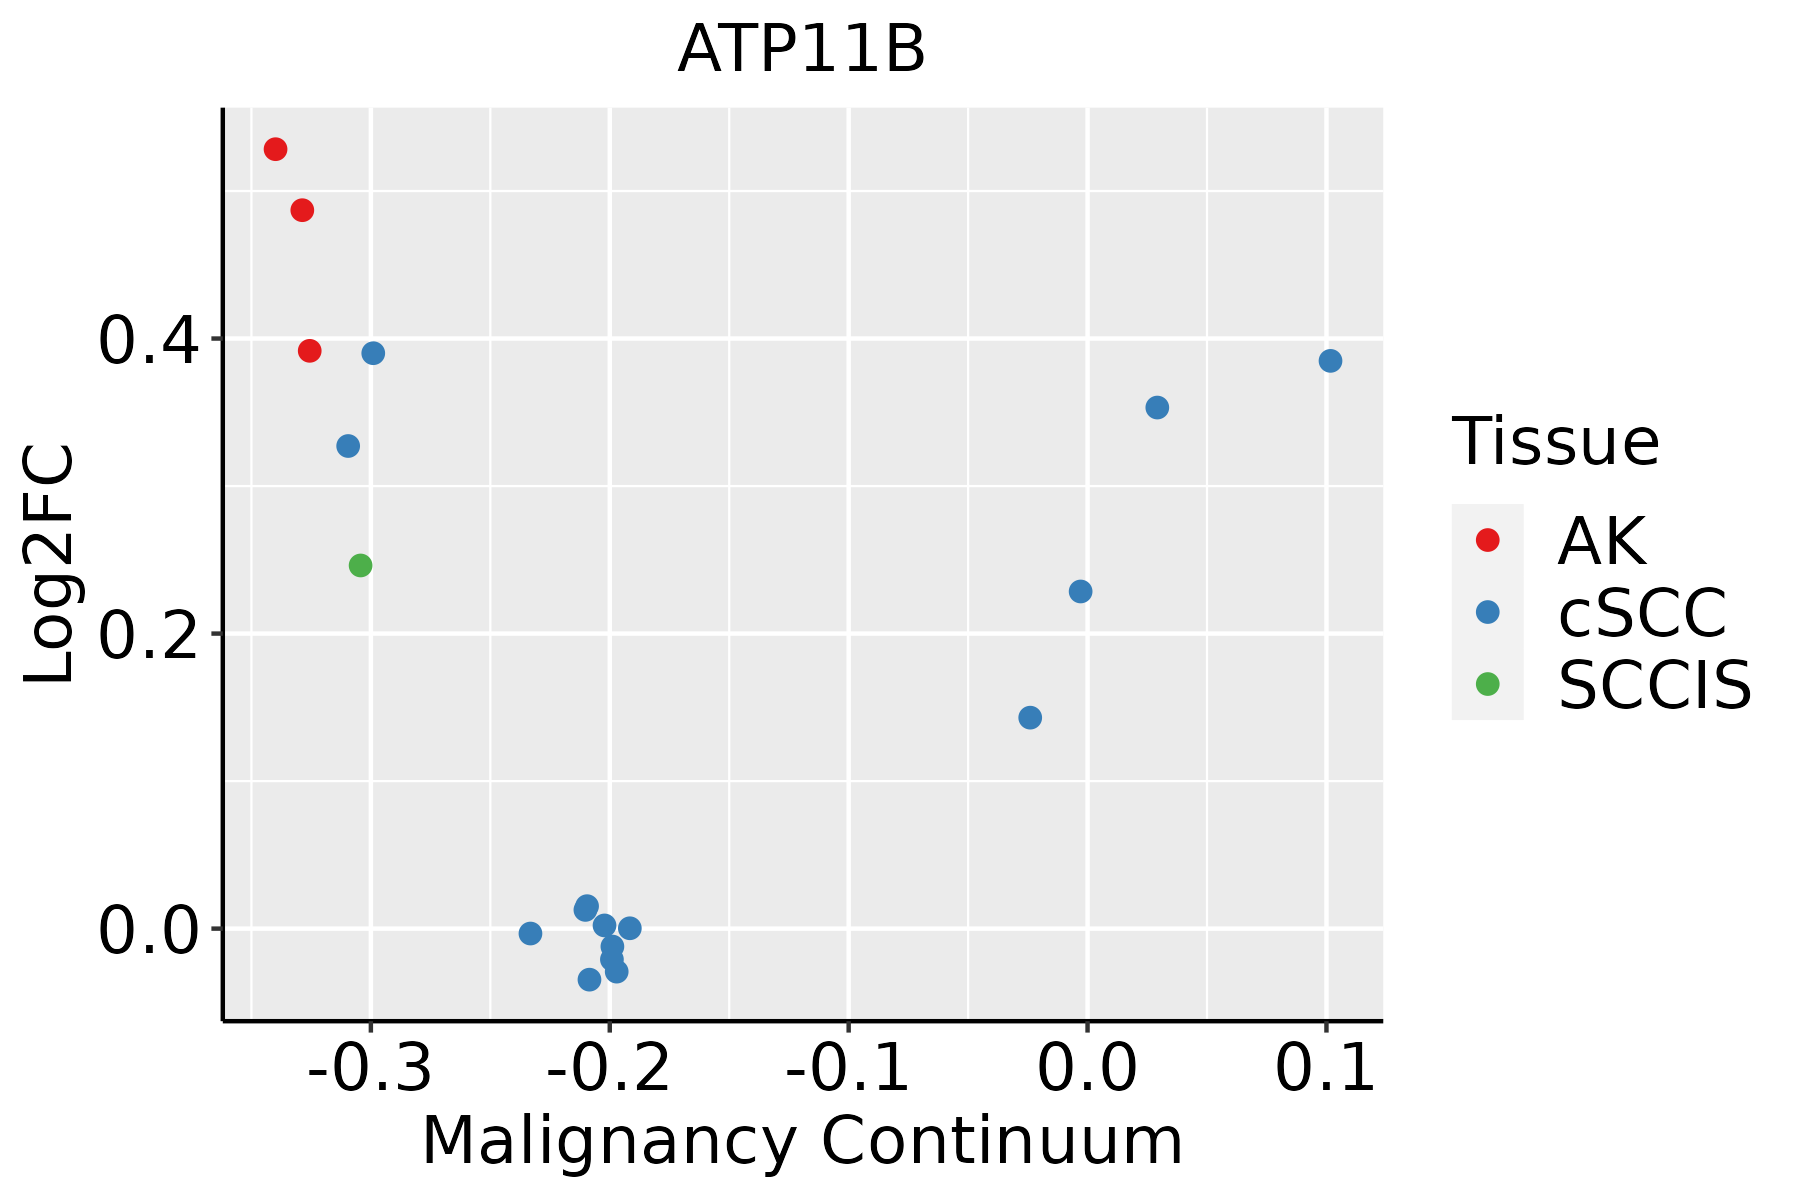 | AK: Actinic keratosis |
| cSCC: Cutaneous squamous cell carcinoma | ||
| SCCIS:squamous cell carcinoma in situ | ||
| Thyroid | 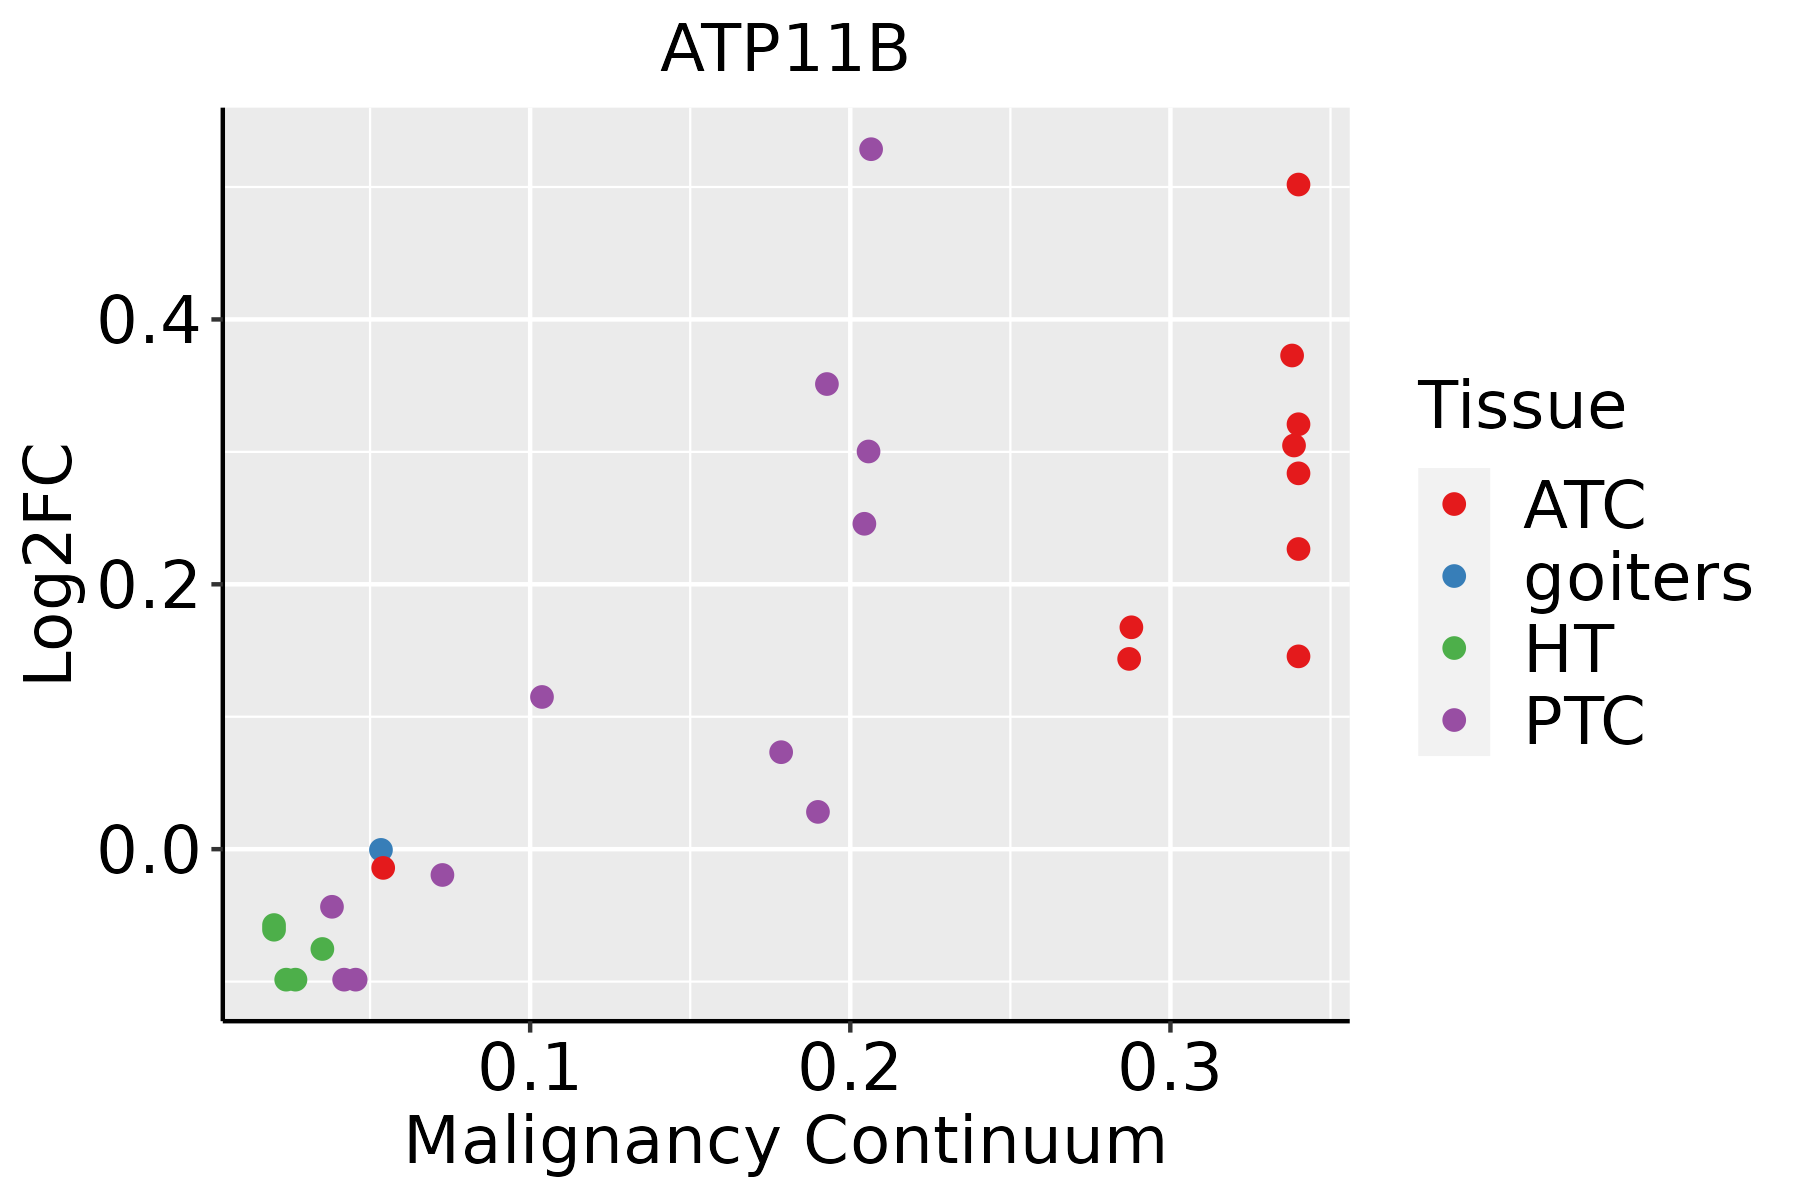 | ATC: Anaplastic thyroid cancer |
| HT: Hashimoto's thyroiditis | ||
| PTC: Papillary thyroid cancer |
| ∗log2FC in expression of this searched gene in stem-like cells from each diseased tissue sample relative to stem-like cells in normal samples in each tissue plotted against the malignancy continuum. Samples are colored based on if they are from different disease stage. |
Top |
Malignant transformation related pathway analysis |
| Find out the enriched GO biological processes and KEGG pathways involved in transition from healthy to precancer to cancer |
| Tissue | Disease Stage | Enriched GO biological Processes |
| Colorectum | AD |  |
| Colorectum | SER |  |
| Colorectum | MSS |  |
| Colorectum | MSI-H |  |
| Colorectum | FAP |  |
| ∗Top 15 enriched GO BP terms are showed in the bar plot of each disease state in each tissue. Each row represents a significant GO biological process which is colored according to the -log10(p.adjust). |
| Page: 1 2 3 4 5 6 7 8 9 |
| GO ID | Tissue | Disease Stage | Description | Gene Ratio | Bg Ratio | pvalue | p.adjust | Count |
| GO:0010876 | Colorectum | AD | lipid localization | 120/3918 | 448/18723 | 1.59e-03 | 1.33e-02 | 120 |
| GO:0006869 | Colorectum | AD | lipid transport | 108/3918 | 398/18723 | 1.67e-03 | 1.39e-02 | 108 |
| GO:0015748 | Colorectum | AD | organophosphate ester transport | 42/3918 | 140/18723 | 7.04e-03 | 4.31e-02 | 42 |
| GO:00108761 | Colorectum | MSS | lipid localization | 104/3467 | 448/18723 | 6.76e-03 | 4.38e-02 | 104 |
| GO:00068691 | Colorectum | FAP | lipid transport | 81/2622 | 398/18723 | 2.84e-04 | 3.76e-03 | 81 |
| GO:00108762 | Colorectum | FAP | lipid localization | 85/2622 | 448/18723 | 1.92e-03 | 1.63e-02 | 85 |
| GO:0015914 | Colorectum | FAP | phospholipid transport | 23/2622 | 96/18723 | 6.09e-03 | 3.82e-02 | 23 |
| GO:00068692 | Colorectum | CRC | lipid transport | 63/2078 | 398/18723 | 2.36e-03 | 2.26e-02 | 63 |
| GO:00108763 | Colorectum | CRC | lipid localization | 68/2078 | 448/18723 | 4.60e-03 | 3.58e-02 | 68 |
| GO:00159142 | Lung | IAC | phospholipid transport | 20/2061 | 96/18723 | 3.58e-03 | 3.00e-02 | 20 |
| GO:00157482 | Lung | IAC | organophosphate ester transport | 26/2061 | 140/18723 | 5.22e-03 | 3.97e-02 | 26 |
| GO:001591411 | Lung | AIS | phospholipid transport | 18/1849 | 96/18723 | 5.64e-03 | 4.76e-02 | 18 |
| GO:00157483 | Oral cavity | EOLP | organophosphate ester transport | 28/2218 | 140/18723 | 3.66e-03 | 2.05e-02 | 28 |
| GO:001574811 | Oral cavity | NEOLP | organophosphate ester transport | 25/2005 | 140/18723 | 7.16e-03 | 3.63e-02 | 25 |
| Page: 1 |
| Pathway ID | Tissue | Disease Stage | Description | Gene Ratio | Bg Ratio | pvalue | p.adjust | qvalue | Count |
| Page: 1 |
Top |
Cell-cell communication analysis |
| Identification of potential cell-cell interactions between two cell types and their ligand-receptor pairs for different disease states |
| Ligand | Receptor | LRpair | Pathway | Tissue | Disease Stage |
| Page: 1 |
Top |
Single-cell gene regulatory network inference analysis |
| Find out the significant the regulons (TFs) and the target genes of each regulon across cell types for different disease states |
| TF | Cell Type | Tissue | Disease Stage | Target Gene | RSS | Regulon Activity |
| ∗The dot plots of a searched regulon are shown for all cell subpopulations in each disease state of each tissue based on the regulon specific score inferred using pySCENIC and by calculating the average expression. |
| Page: 1 |
Top |
Somatic mutation of malignant transformation related genes |
| Annotation of somatic variants for genes involved in malignant transformation |
| Hugo Symbol | Variant Class | Variant Classification | dbSNP RS | HGVSc | HGVSp | HGVSp Short | SWISSPROT | BIOTYPE | SIFT | PolyPhen | Tumor Sample Barcode | Tissue | Histology | Sex | Age | Stage | Therapy Types | Drugs | Outcome |
| ATP11B | SNV | Missense_Mutation | novel | c.3148N>A | p.Leu1050Ile | p.L1050I | Q9Y2G3 | protein_coding | tolerated(1) | benign(0) | TCGA-AN-A046-01 | Breast | breast invasive carcinoma | Female | >=65 | I/II | Unknown | Unknown | SD |
| ATP11B | SNV | Missense_Mutation | c.538N>A | p.Glu180Lys | p.E180K | Q9Y2G3 | protein_coding | deleterious(0) | probably_damaging(1) | TCGA-AR-A1AO-01 | Breast | breast invasive carcinoma | Female | <65 | I/II | Chemotherapy | doxorubicin | SD | |
| ATP11B | SNV | Missense_Mutation | rs200531169 | c.2801A>T | p.His934Leu | p.H934L | Q9Y2G3 | protein_coding | tolerated(0.11) | benign(0.009) | TCGA-C8-A26Y-01 | Breast | breast invasive carcinoma | Female | >=65 | I/II | Unknown | Unknown | SD |
| ATP11B | SNV | Missense_Mutation | c.232N>G | p.Gln78Glu | p.Q78E | Q9Y2G3 | protein_coding | deleterious(0.04) | probably_damaging(0.926) | TCGA-D8-A27G-01 | Breast | breast invasive carcinoma | Female | >=65 | I/II | Unknown | Unknown | SD | |
| ATP11B | SNV | Missense_Mutation | c.847N>C | p.Glu283Gln | p.E283Q | Q9Y2G3 | protein_coding | deleterious(0.01) | probably_damaging(0.999) | TCGA-E9-A228-01 | Breast | breast invasive carcinoma | Female | <65 | I/II | Chemotherapy | doxorubicin | SD | |
| ATP11B | insertion | Frame_Shift_Ins | novel | c.1833_1834insGAGACTGACATTG | p.Lys612GlufsTer12 | p.K612Efs*12 | Q9Y2G3 | protein_coding | TCGA-AR-A0U0-01 | Breast | breast invasive carcinoma | Female | >=65 | I/II | Unknown | Unknown | SD | ||
| ATP11B | SNV | Missense_Mutation | novel | c.1792N>A | p.Glu598Lys | p.E598K | Q9Y2G3 | protein_coding | deleterious(0) | probably_damaging(0.96) | TCGA-C5-A2LZ-01 | Cervix | cervical & endocervical cancer | Female | >=65 | III/IV | Unknown | Unknown | PD |
| ATP11B | SNV | Missense_Mutation | rs760169325 | c.2702N>C | p.Leu901Ser | p.L901S | Q9Y2G3 | protein_coding | tolerated(0.22) | benign(0.071) | TCGA-C5-A8ZZ-01 | Cervix | cervical & endocervical cancer | Female | <65 | I/II | Unspecific | Cisplatin | SD |
| ATP11B | SNV | Missense_Mutation | c.1343N>A | p.Gly448Glu | p.G448E | Q9Y2G3 | protein_coding | deleterious(0.05) | possibly_damaging(0.812) | TCGA-DR-A0ZM-01 | Cervix | cervical & endocervical cancer | Female | <65 | III/IV | Unspecific | Cisplatin | SD | |
| ATP11B | SNV | Missense_Mutation | novel | c.917N>A | p.Ile306Asn | p.I306N | Q9Y2G3 | protein_coding | deleterious(0.01) | possibly_damaging(0.908) | TCGA-EA-A3HU-01 | Cervix | cervical & endocervical cancer | Female | <65 | I/II | Unknown | Unknown | SD |
| Page: 1 2 3 4 5 6 7 8 9 10 11 12 |
Top |
Related drugs of malignant transformation related genes |
| Identification of chemicals and drugs interact with genes involved in malignant transfromation |
| (DGIdb 4.0) |
| Entrez ID | Symbol | Category | Interaction Types | Drug Claim Name | Drug Name | PMIDs |
| Page: 1 |

Copyright 2023-Present -The University of Texas Health Science Center at Houston |