Schematic overview of the cellular and molecular mechanisms involved in the cancer progression, including the proposed cellular and molecular mechanisms in cancer cells trajectory. AT1: alveolar type 1 cells; AT2: alveolar type 2 cells; AAH: atypical adenomatous hyperplasia; AIS: adenocarcinoma in situ; MIA: minimally invasive adenocarcinoma; IA: invasive adenocarcinoma; EMT: epithelial-mesenchymal transition

Home

Download

Statistics

Help

Contact

Center for Computational Systems Medicine
leaf

Gene summary

leaf

Malignant transformation analysis

leaf

Malignant transformation related pathway analysis

leaf

Cell-cell communication analysis

leaf

Single-cell gene regulatory network inference analysis

leaf

Somatic mutation of malignant transformation related genes

leaf

Related drugs of malignant transformation related genes

Gene: ATP11A

Gene summary for ATP11A

check button Gene summary.

Gene informationSpeciesHuman
Gene symbol

ATP11A

Gene ID

23250

Gene nameATPase phospholipid transporting 11A
Gene AliasATPIH
Cytomap13q34
Gene Typeprotein-coding
GO ID

GO:0001701

UniProtAcc

P98196


Top

Malignant transformation analysis

check button Identification of the aberrant gene expression in precancerous and cancerous lesions by comparing the gene expression of stem-like cells in diseased tissues with normal stem cells
check button Malignant transformation involving gene list.
Entrez IDSymbolReplicatesSpeciesOrganTissueAdj P-valueLog2FCMalignancy
23250ATP11AHTA11_1391_2000001011HumanColorectumAD2.67e-022.75e-01-0.059
23250ATP11AHTA11_99999970781_79442HumanColorectumMSS7.34e-043.37e-010.294
23250ATP11AHTA11_99999965104_69814HumanColorectumMSS2.49e-241.07e+000.281
23250ATP11AHTA11_99999971662_82457HumanColorectumMSS1.09e-471.47e+000.3859
23250ATP11AHTA11_99999973899_84307HumanColorectumMSS1.92e-076.27e-010.2585
23250ATP11AA015-C-203HumanColorectumFAP6.61e-07-1.82e-01-0.1294
23250ATP11AA001-C-108HumanColorectumFAP3.41e-029.52e-02-0.0272
23250ATP11AA002-C-205HumanColorectumFAP8.81e-03-1.11e-01-0.1236
23250ATP11AA015-C-104HumanColorectumFAP4.47e-07-1.34e-01-0.1899
23250ATP11AA002-C-016HumanColorectumFAP2.38e-02-8.45e-020.0521
23250ATP11AA001-C-007HumanColorectumCRC4.73e-065.87e-010.1899
23250ATP11AA002-C-116HumanColorectumFAP2.43e-06-1.42e-01-0.0452
23250ATP11AA018-E-020HumanColorectumFAP5.12e-03-2.24e-01-0.2034
23250ATP11AF034HumanColorectumFAP7.01e-03-1.88e-02-0.0665
23250ATP11ACRC-1-8810HumanColorectumCRC2.83e-053.41e-010.6257
23250ATP11ACRC-3-11773HumanColorectumCRC1.50e-033.40e-010.2564
23250ATP11AAEH-subject1HumanEndometriumAEH5.46e-185.58e-01-0.3059
23250ATP11AAEH-subject2HumanEndometriumAEH8.87e-043.74e-01-0.2525
23250ATP11AAEH-subject3HumanEndometriumAEH4.24e-083.64e-01-0.2576
23250ATP11AAEH-subject4HumanEndometriumAEH5.96e-064.56e-01-0.2657
Page: 1 2 3 4 5 

check button Transcriptomic changes along malignancy continuum.
TissueExpression DynamicsAbbreviation
Colorectum (GSE201348)The image shows the transcriptomic changes along malignancy continuum.log2FC in expression of this searched gene in stem-like cells from each diseased tissue sample relative to stem-like cells in normal samples in each tissue plotted against the malignancy continuum. Samples are colored based on if they are from different disease stage.
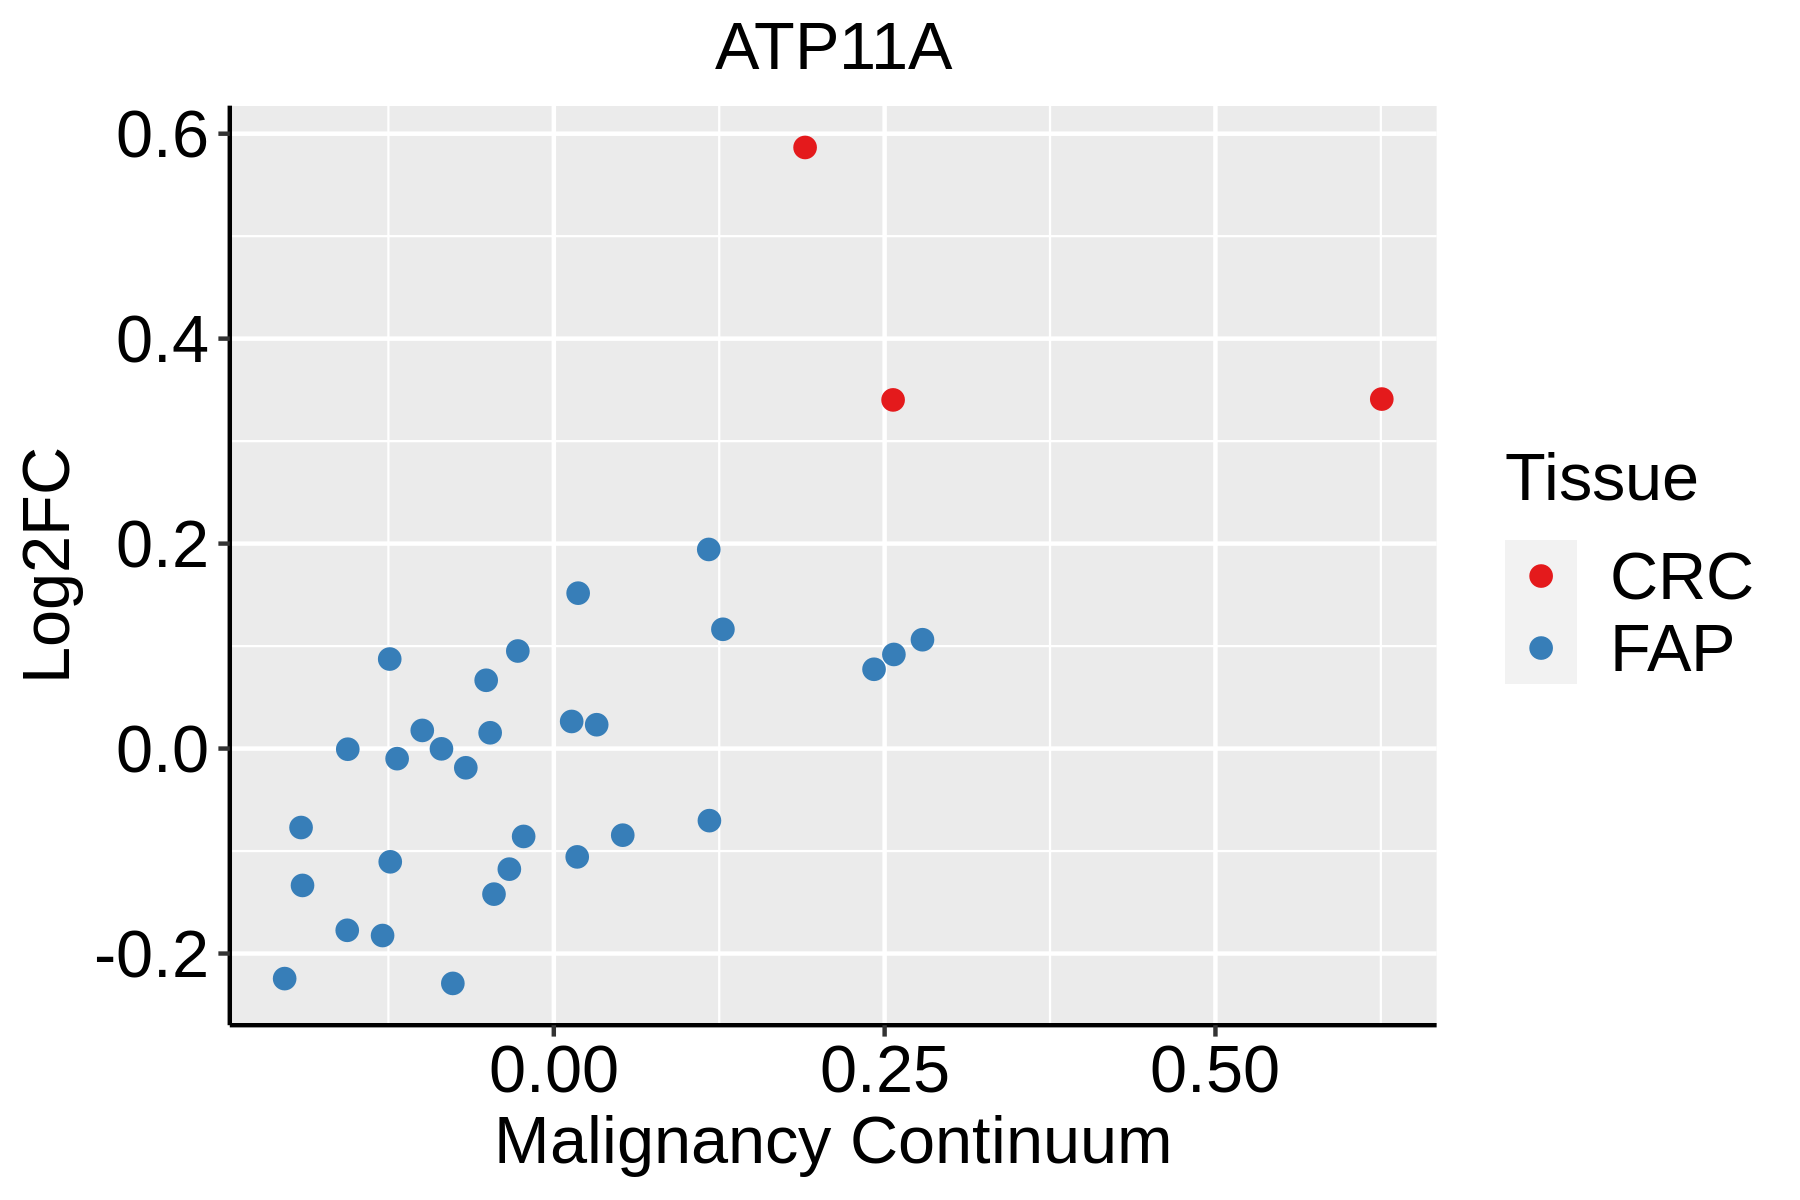
FAP: Familial adenomatous polyposis
CRC: Colorectal cancer
Colorectum (HTA11)The image shows the transcriptomic changes along malignancy continuum.log2FC in expression of this searched gene in stem-like cells from each diseased tissue sample relative to stem-like cells in normal samples in each tissue plotted against the malignancy continuum. Samples are colored based on if they are from different disease stage.AD: Adenomas
SER: Sessile serrated lesions
MSI-H: Microsatellite-high colorectal cancer
MSS: Microsatellite stable colorectal cancer
EndometriumThe image shows the transcriptomic changes along malignancy continuum.log2FC in expression of this searched gene in stem-like cells from each diseased tissue sample relative to stem-like cells in normal samples in each tissue plotted against the malignancy continuum. Samples are colored based on if they are from different disease stage.AEH: Atypical endometrial hyperplasia
EEC: Endometrioid Cancer
LiverThe image shows the transcriptomic changes along malignancy continuum.log2FC in expression of this searched gene in stem-like cells from each diseased tissue sample relative to stem-like cells in normal samples in each tissue plotted against the malignancy continuum. Samples are colored based on if they are from different disease stage.
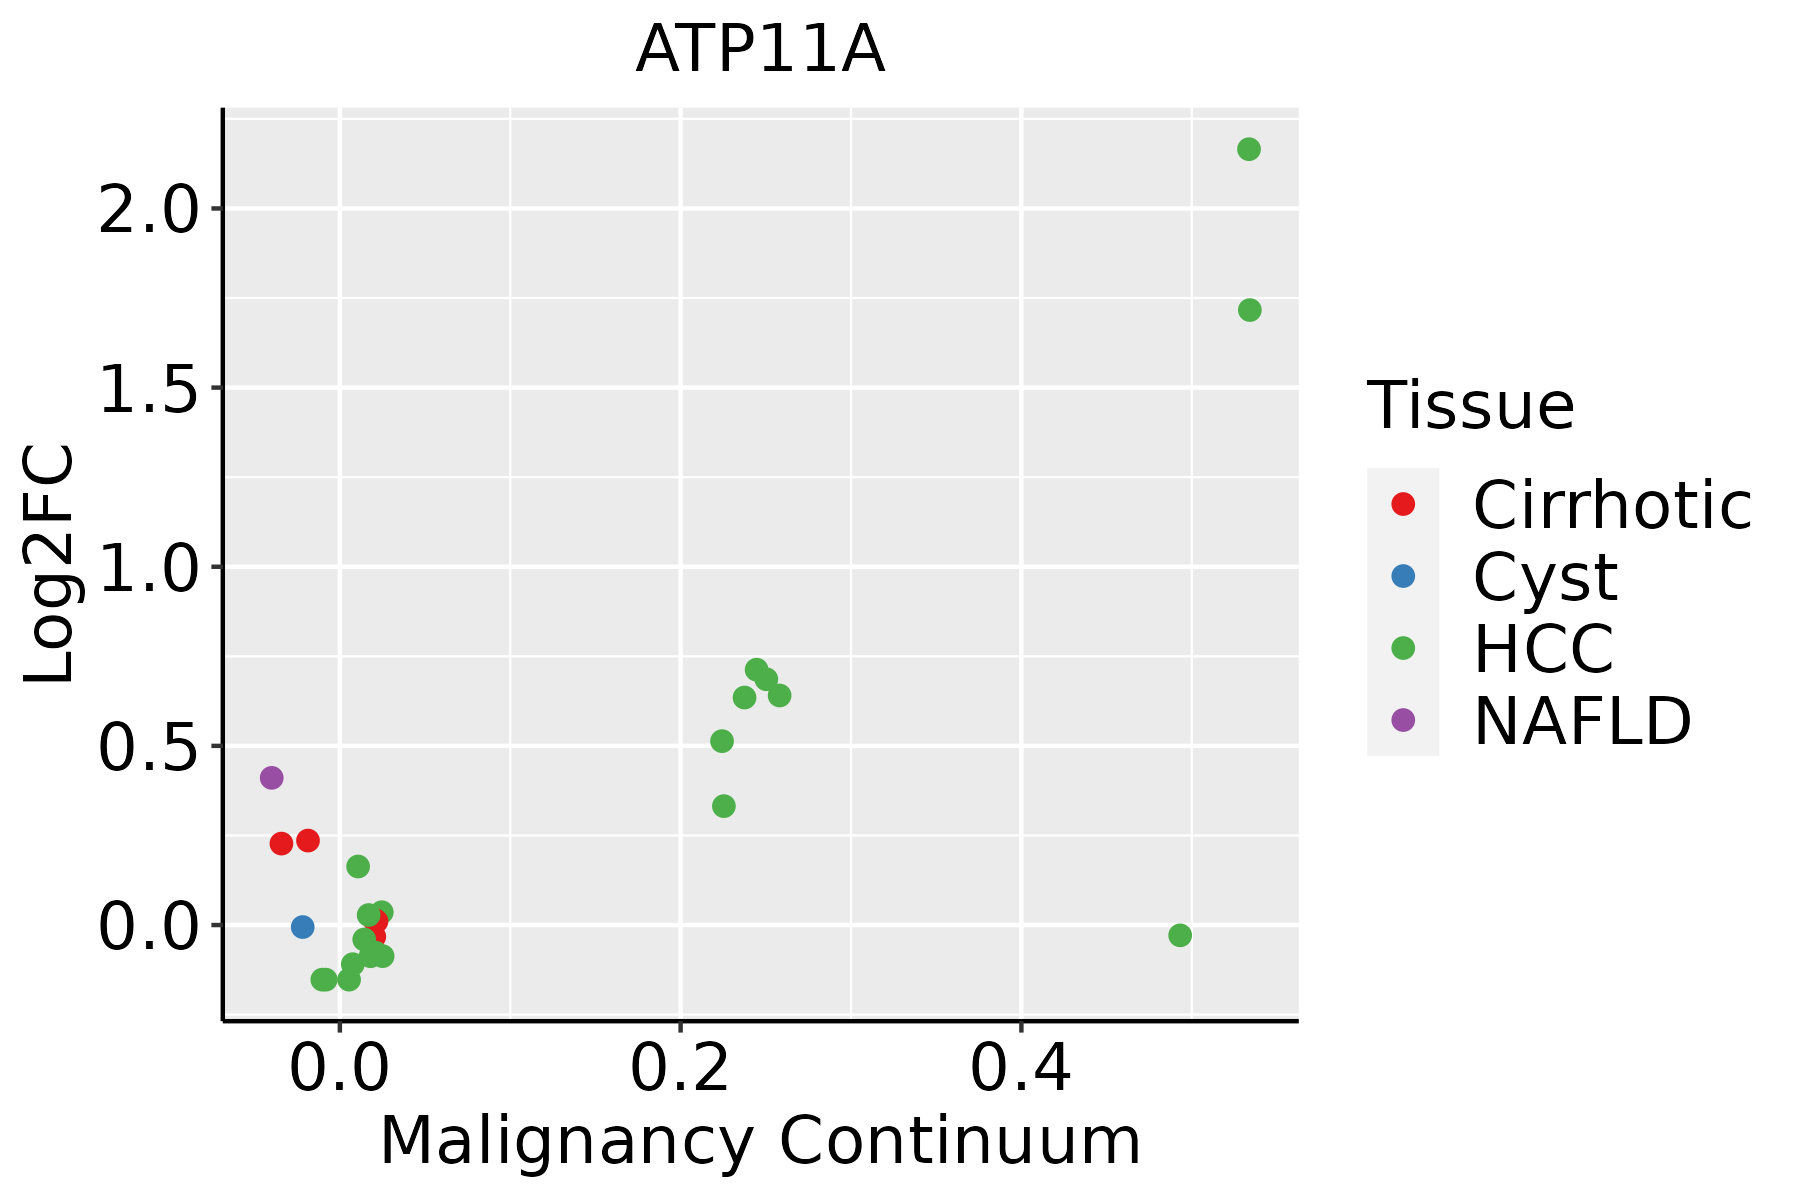
HCC: Hepatocellular carcinoma
NAFLD: Non-alcoholic fatty liver disease
LungThe image shows the transcriptomic changes along malignancy continuum.log2FC in expression of this searched gene in stem-like cells from each diseased tissue sample relative to stem-like cells in normal samples in each tissue plotted against the malignancy continuum. Samples are colored based on if they are from different disease stage.
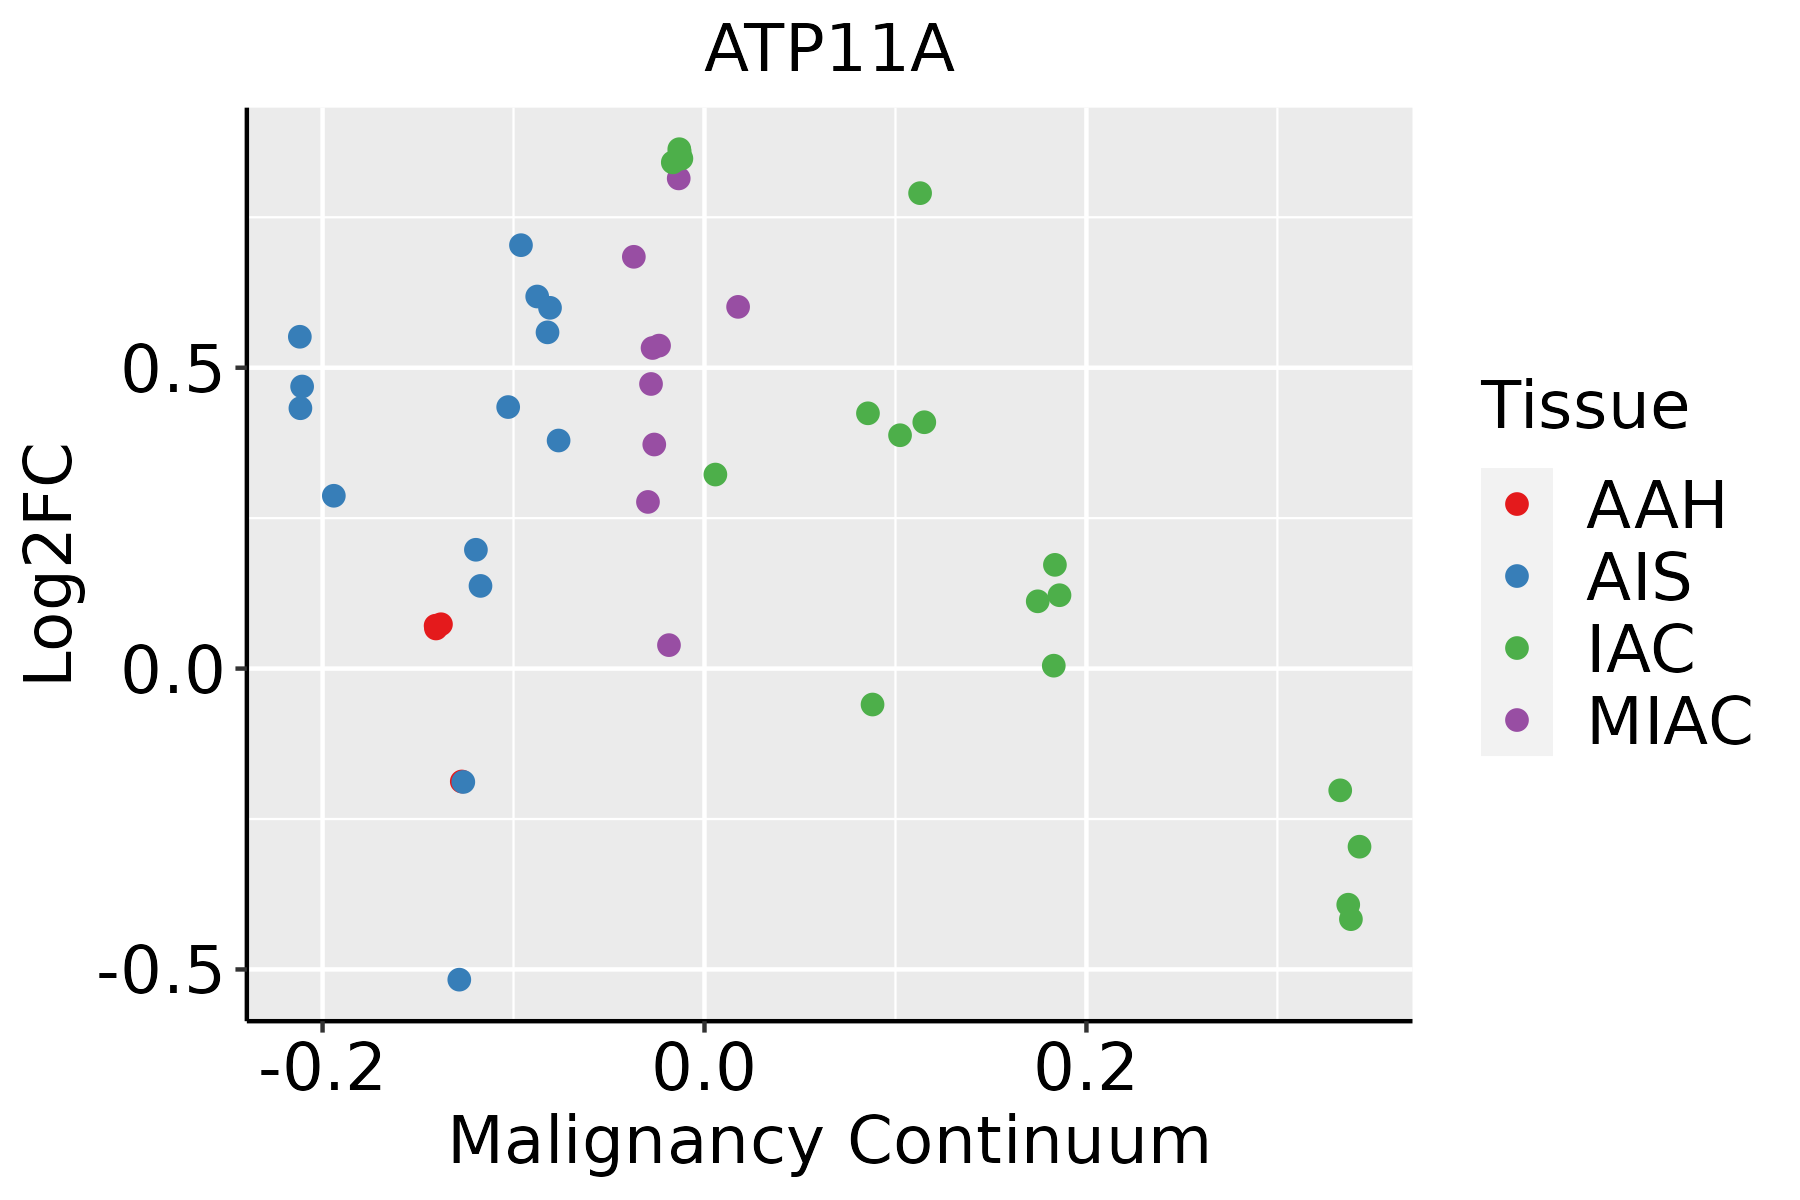
AAH: Atypical adenomatous hyperplasia
AIS: Adenocarcinoma in situ
IAC: Invasive lung adenocarcinoma
MIA: Minimally invasive adenocarcinoma
Oral CavityThe image shows the transcriptomic changes along malignancy continuum.log2FC in expression of this searched gene in stem-like cells from each diseased tissue sample relative to stem-like cells in normal samples in each tissue plotted against the malignancy continuum. Samples are colored based on if they are from different disease stage.
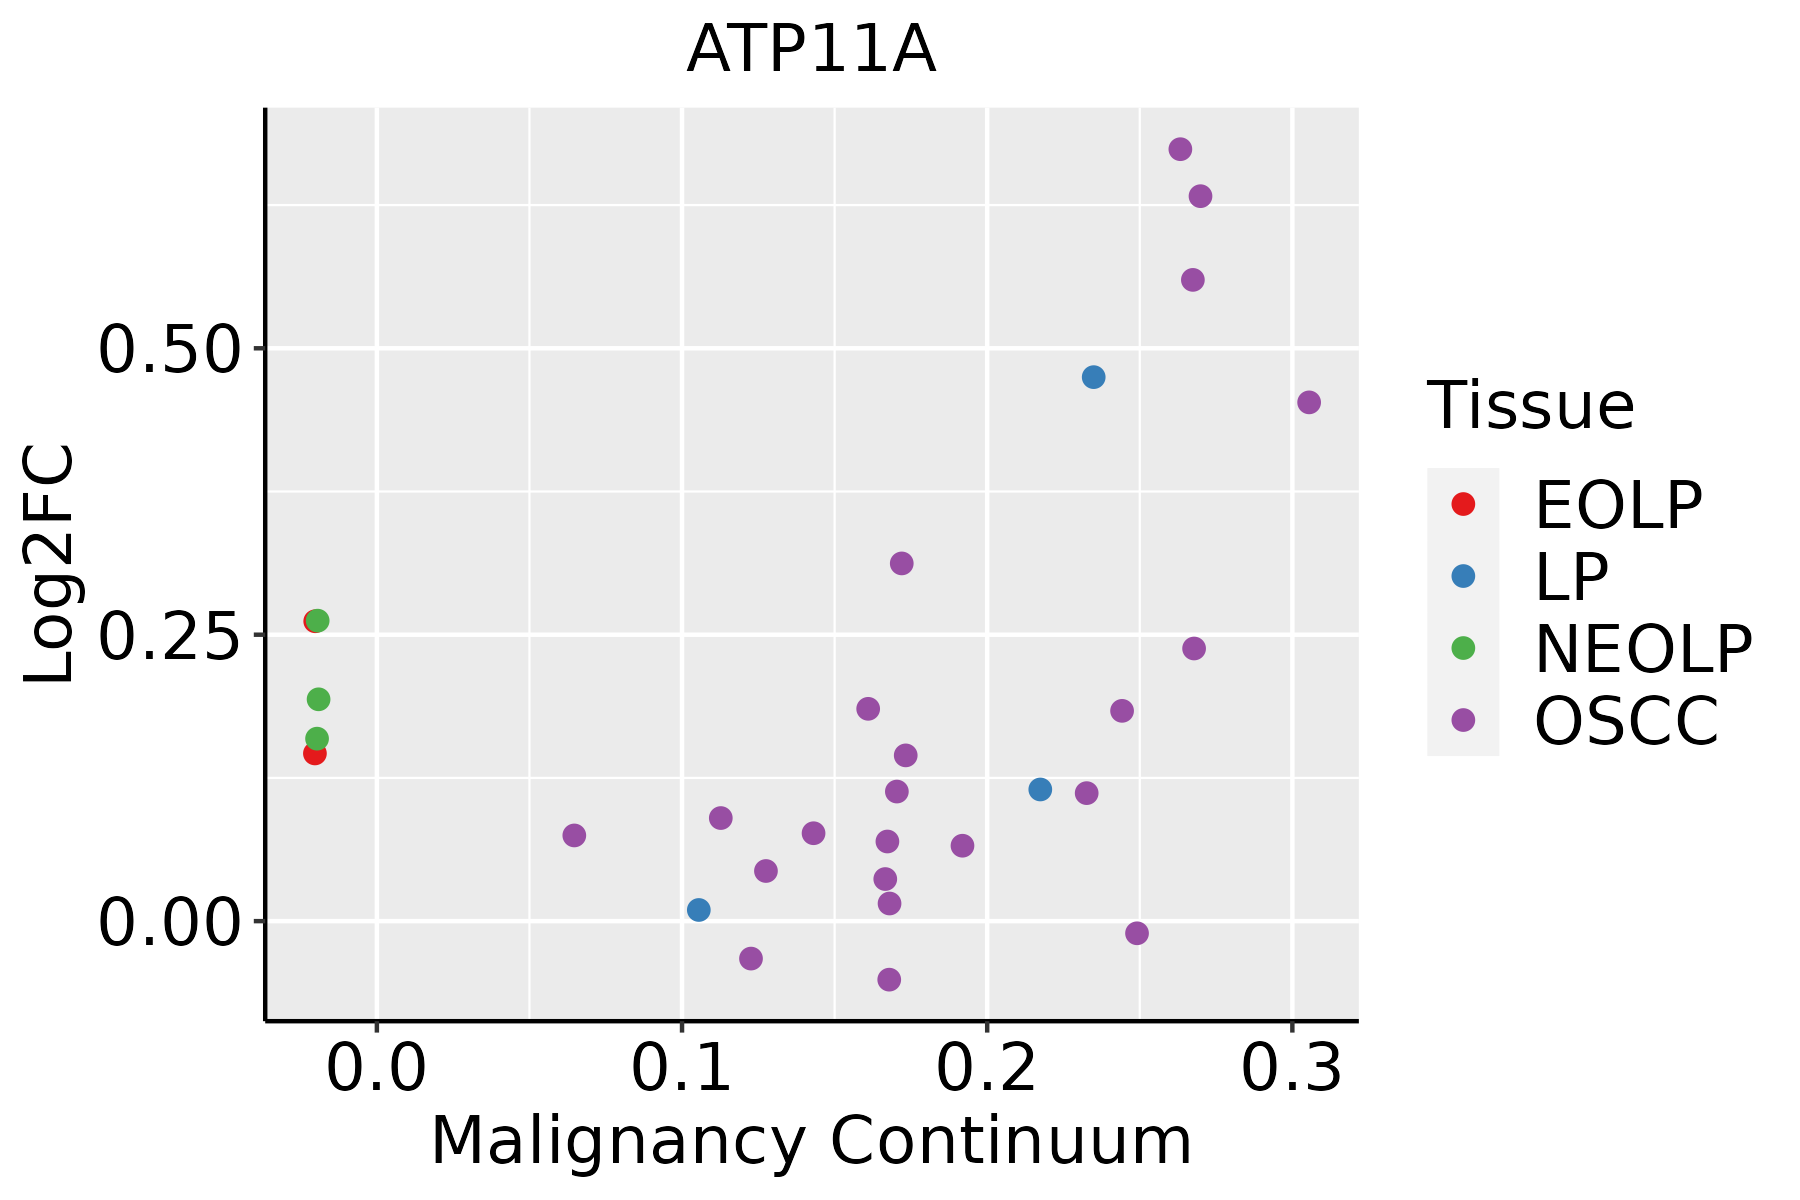
EOLP: Erosive Oral lichen planus
LP: leukoplakia
NEOLP: Non-erosive oral lichen planus
OSCC: Oral squamous cell carcinoma
ThyroidThe image shows the transcriptomic changes along malignancy continuum.log2FC in expression of this searched gene in stem-like cells from each diseased tissue sample relative to stem-like cells in normal samples in each tissue plotted against the malignancy continuum. Samples are colored based on if they are from different disease stage.
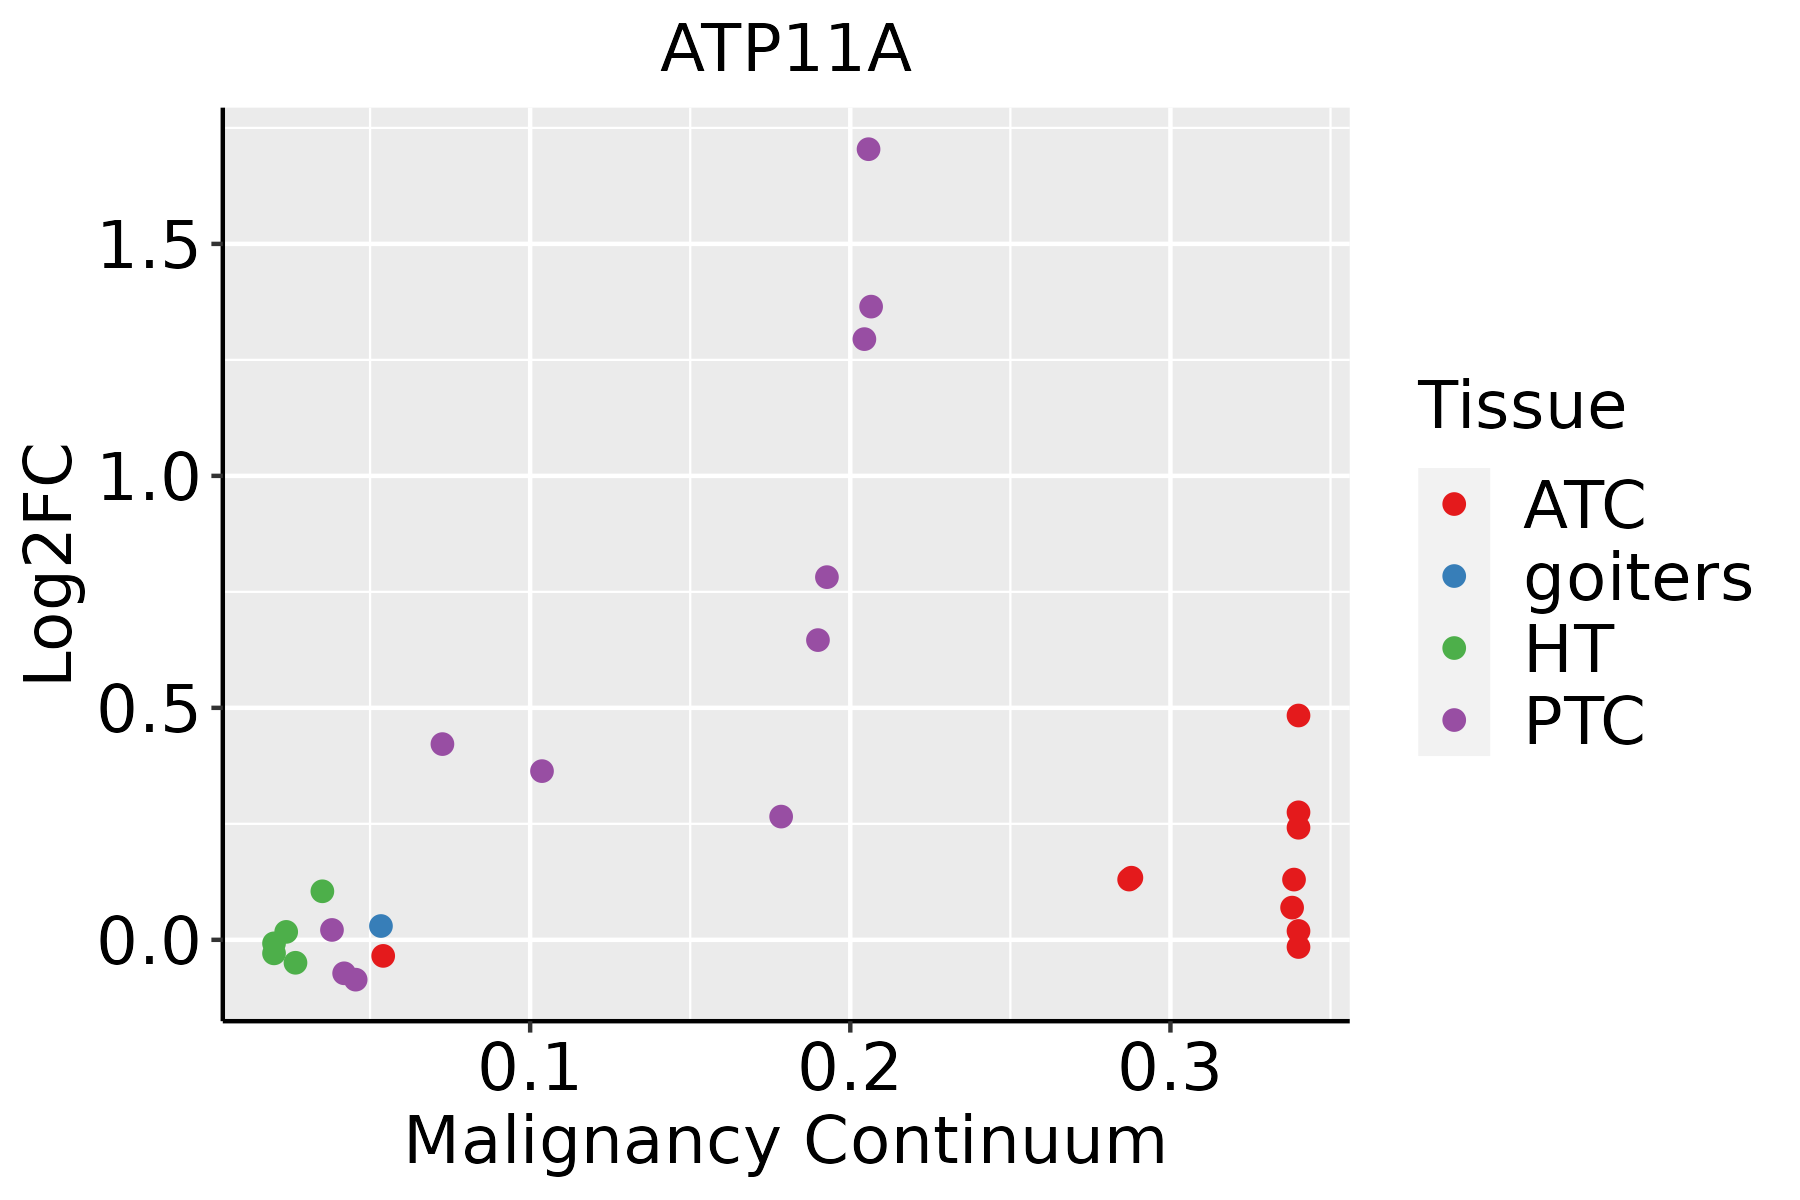
ATC: Anaplastic thyroid cancer
HT: Hashimoto's thyroiditis
PTC: Papillary thyroid cancer
∗log2FC in expression of this searched gene in stem-like cells from each diseased tissue sample relative to stem-like cells in normal samples in each tissue plotted against the malignancy continuum. Samples are colored based on if they are from different disease stage.

Top

Malignant transformation related pathway analysis

check buttonFind out the enriched GO biological processes and KEGG pathways involved in transition from healthy to precancer to cancer
check button Figure of enriched GO biological processes.
TissueDisease StageEnriched GO biological Processes
ColorectumADGO analysis - Figure of enriched GO biological processes: Top 15 enriched GO BP terms are showed in the bar plot of each disease state in each tissue. Each row represents a significant GO biological process which is colored according to the -log10(p.adjust).
ColorectumSERGO analysis - Figure of enriched GO biological processes: Top 15 enriched GO BP terms are showed in the bar plot of each disease state in each tissue. Each row represents a significant GO biological process which is colored according to the -log10(p.adjust).
ColorectumMSSGO analysis - Figure of enriched GO biological processes: Top 15 enriched GO BP terms are showed in the bar plot of each disease state in each tissue. Each row represents a significant GO biological process which is colored according to the -log10(p.adjust).
ColorectumMSI-HGO analysis - Figure of enriched GO biological processes: Top 15 enriched GO BP terms are showed in the bar plot of each disease state in each tissue. Each row represents a significant GO biological process which is colored according to the -log10(p.adjust).
ColorectumFAPGO analysis - Figure of enriched GO biological processes: Top 15 enriched GO BP terms are showed in the bar plot of each disease state in each tissue. Each row represents a significant GO biological process which is colored according to the -log10(p.adjust).
∗Top 15 enriched GO BP terms are showed in the bar plot of each disease state in each tissue. Each row represents a significant GO biological process which is colored according to the -log10(p.adjust).
Page: 1 2 3 4 5 6 7 8 9 

check button Enriched GO biological processes.
GO IDTissueDisease StageDescriptionGene RatioBg Ratiopvaluep.adjustCount
GO:0001701ColorectumADin utero embryonic development110/3918367/187232.36e-054.62e-04110
GO:0010876ColorectumADlipid localization120/3918448/187231.59e-031.33e-02120
GO:0006869ColorectumADlipid transport108/3918398/187231.67e-031.39e-02108
GO:0015748ColorectumADorganophosphate ester transport42/3918140/187237.04e-034.31e-0242
GO:00017012ColorectumMSSin utero embryonic development99/3467367/187233.71e-057.10e-0499
GO:00108761ColorectumMSSlipid localization104/3467448/187236.76e-034.38e-02104
GO:00017013ColorectumFAPin utero embryonic development81/2622367/187231.58e-054.10e-0481
GO:00068691ColorectumFAPlipid transport81/2622398/187232.84e-043.76e-0381
GO:00108762ColorectumFAPlipid localization85/2622448/187231.92e-031.63e-0285
GO:0015914ColorectumFAPphospholipid transport23/262296/187236.09e-033.82e-0223
GO:00068692ColorectumCRClipid transport63/2078398/187232.36e-032.26e-0263
GO:00108763ColorectumCRClipid localization68/2078448/187234.60e-033.58e-0268
GO:00017014ColorectumCRCin utero embryonic development57/2078367/187235.54e-034.19e-0257
GO:00017019EndometriumAEHin utero embryonic development73/2100367/187237.18e-072.63e-0573
GO:00426925EndometriumAEHmuscle cell differentiation68/2100384/187238.88e-051.30e-0368
GO:00511465EndometriumAEHstriated muscle cell differentiation51/2100283/187234.20e-044.46e-0351
GO:000170114EndometriumEECin utero embryonic development75/2168367/187235.86e-072.16e-0575
GO:004269212EndometriumEECmuscle cell differentiation67/2168384/187233.87e-044.12e-0367
GO:005114613EndometriumEECstriated muscle cell differentiation51/2168283/187238.71e-047.97e-0351
GO:00108765LiverNAFLDlipid localization79/1882448/187234.75e-072.92e-0579
Page: 1 2 3 

check button Enriched KEGG pathways.
Pathway IDTissueDisease StageDescriptionGene RatioBg Ratiopvaluep.adjustqvalueCount
Page: 1 

Top

Cell-cell communication analysis

check buttonIdentification of potential cell-cell interactions between two cell types and their ligand-receptor pairs for different disease states
LigandReceptorLRpairPathwayTissueDisease Stage
Page: 1 

Top

Single-cell gene regulatory network inference analysis

check buttonFind out the significant the regulons (TFs) and the target genes of each regulon across cell types for different disease states
TFCell TypeTissueDisease StageTarget GeneRSSRegulon Activity
∗The dot plots of a searched regulon are shown for all cell subpopulations in each disease state of each tissue based on the regulon specific score inferred using pySCENIC and by calculating the average expression.
Page: 1 

Top

Somatic mutation of malignant transformation related genes

check buttonAnnotation of somatic variants for genes involved in malignant transformation
Hugo SymbolVariant ClassVariant ClassificationdbSNP RSHGVScHGVSpHGVSp ShortSWISSPROTBIOTYPESIFTPolyPhenTumor Sample BarcodeTissueHistologySexAgeStageTherapy TypesDrugsOutcome
ATP11ASNVMissense_Mutationc.327N>Gp.Ile109Metp.I109MP98196protein_codingdeleterious(0)benign(0.349)TCGA-AC-A23H-01Breastbreast invasive carcinomaFemale>=65I/IIUnknownUnknownPD
ATP11ASNVMissense_Mutationc.2552N>Ap.Ala851Aspp.A851DP98196protein_codingdeleterious(0)possibly_damaging(0.883)TCGA-BH-A0BW-01Breastbreast invasive carcinomaFemale>=65I/IIChemotherapyadriamycinCR
ATP11ASNVMissense_Mutationnovelc.1930N>Cp.Glu644Glnp.E644QP98196protein_codingtolerated(0.25)benign(0.127)TCGA-BH-A209-01Breastbreast invasive carcinomaFemale>=65I/IIUnknownUnknownSD
ATP11ASNVMissense_Mutationnovelc.61N>Ap.Val21Metp.V21MP98196protein_codingdeleterious(0)possibly_damaging(0.784)TCGA-D8-A27R-01Breastbreast invasive carcinomaFemale<65III/IVChemotherapyadriamycin+cyclophosphamideSD
ATP11ASNVMissense_Mutationrs779974601c.2507N>Tp.Ala836Valp.A836VP98196protein_codingdeleterious(0.01)probably_damaging(0.992)TCGA-E9-A248-01Breastbreast invasive carcinomaFemale<65I/IIChemotherapycyclophosphamideSD
ATP11ASNVMissense_Mutationnovelc.2155N>Cp.Glu719Glnp.E719QP98196protein_codingtolerated(0.07)possibly_damaging(0.593)TCGA-PL-A8LV-01Breastbreast invasive carcinomaFemale<65III/IVUnknownUnknownSD
ATP11AinsertionIn_Frame_Insnovelc.2201_2202insGTCACACAGGCCTGGCATGTGGCAAGCp.Val734_Leu735insSerHisArgProGlyMetTrpGlnAlap.V734_L735insSHRPGMWQAP98196protein_codingTCGA-A7-A0CJ-01Breastbreast invasive carcinomaFemale<65I/IIChemotherapycytoxanSD
ATP11AinsertionFrame_Shift_Insnovelc.1138_1139insATGGCCACACCCCTCCTTCCTGCTCTTTp.Thr380AsnfsTer17p.T380Nfs*17P98196protein_codingTCGA-A8-A07Z-01Breastbreast invasive carcinomaFemale>=65I/IIUnspecificExemestaneSD
ATP11AinsertionFrame_Shift_Insnovelc.1690_1691insGCACCAGCTGCACCCACTCCACAGCACCCTGGGCp.Val564GlyfsTer40p.V564Gfs*40P98196protein_codingTCGA-B6-A0IC-01Breastbreast invasive carcinomaFemale>=65I/IIUnknownUnknownSD
ATP11AinsertionFrame_Shift_Insnovelc.75_76insCCCGCCTTCTp.Ile26ProfsTer45p.I26Pfs*45P98196protein_codingTCGA-BH-A0HX-01Breastbreast invasive carcinomaFemale<65I/IIChemotherapyadrimycinSD
Page: 1 2 3 4 5 6 7 8 9 10 11 12 13 14 

Top

Related drugs of malignant transformation related genes

check buttonIdentification of chemicals and drugs interact with genes involved in malignant transfromation
(DGIdb 4.0)
Entrez IDSymbolCategoryInteraction TypesDrug Claim NameDrug NamePMIDs
Page: 1