
|
|||||
|
 | |
| |
| |
| |
| |
| |
|
Gene: ATOH8 |
Gene summary for ATOH8 |
| Gene information | Species | Human | Gene symbol | ATOH8 | Gene ID | 84913 |
| Gene name | atonal bHLH transcription factor 8 | |
| Gene Alias | HATH6 | |
| Cytomap | 2p11.2 | |
| Gene Type | protein-coding | GO ID | GO:0001667 | UniProtAcc | Q96SQ7 |
Top |
Malignant transformation analysis |
| Identification of the aberrant gene expression in precancerous and cancerous lesions by comparing the gene expression of stem-like cells in diseased tissues with normal stem cells |
| Entrez ID | Symbol | Replicates | Species | Organ | Tissue | Adj P-value | Log2FC | Malignancy |
| 84913 | ATOH8 | HCC2 | Human | Liver | HCC | 9.26e-07 | 9.45e-01 | 0.5341 |
| 84913 | ATOH8 | HCC5 | Human | Liver | HCC | 4.22e-02 | 1.11e-01 | 0.4932 |
| 84913 | ATOH8 | S014 | Human | Liver | HCC | 1.59e-18 | 5.85e-01 | 0.2254 |
| 84913 | ATOH8 | S015 | Human | Liver | HCC | 1.81e-16 | 7.61e-01 | 0.2375 |
| 84913 | ATOH8 | S016 | Human | Liver | HCC | 2.00e-16 | 5.11e-01 | 0.2243 |
| 84913 | ATOH8 | male-WTA | Human | Thyroid | PTC | 3.35e-23 | 1.81e-01 | 0.1037 |
| 84913 | ATOH8 | PTC01 | Human | Thyroid | PTC | 6.06e-10 | 1.37e-01 | 0.1899 |
| 84913 | ATOH8 | PTC04 | Human | Thyroid | PTC | 2.76e-11 | 3.23e-01 | 0.1927 |
| 84913 | ATOH8 | PTC05 | Human | Thyroid | PTC | 1.85e-07 | 2.87e-01 | 0.2065 |
| 84913 | ATOH8 | PTC06 | Human | Thyroid | PTC | 3.13e-08 | 4.16e-01 | 0.2057 |
| 84913 | ATOH8 | PTC07 | Human | Thyroid | PTC | 1.12e-25 | 5.89e-01 | 0.2044 |
| Page: 1 |
| Tissue | Expression Dynamics | Abbreviation |
| Liver |  | HCC: Hepatocellular carcinoma |
| NAFLD: Non-alcoholic fatty liver disease | ||
| Thyroid | 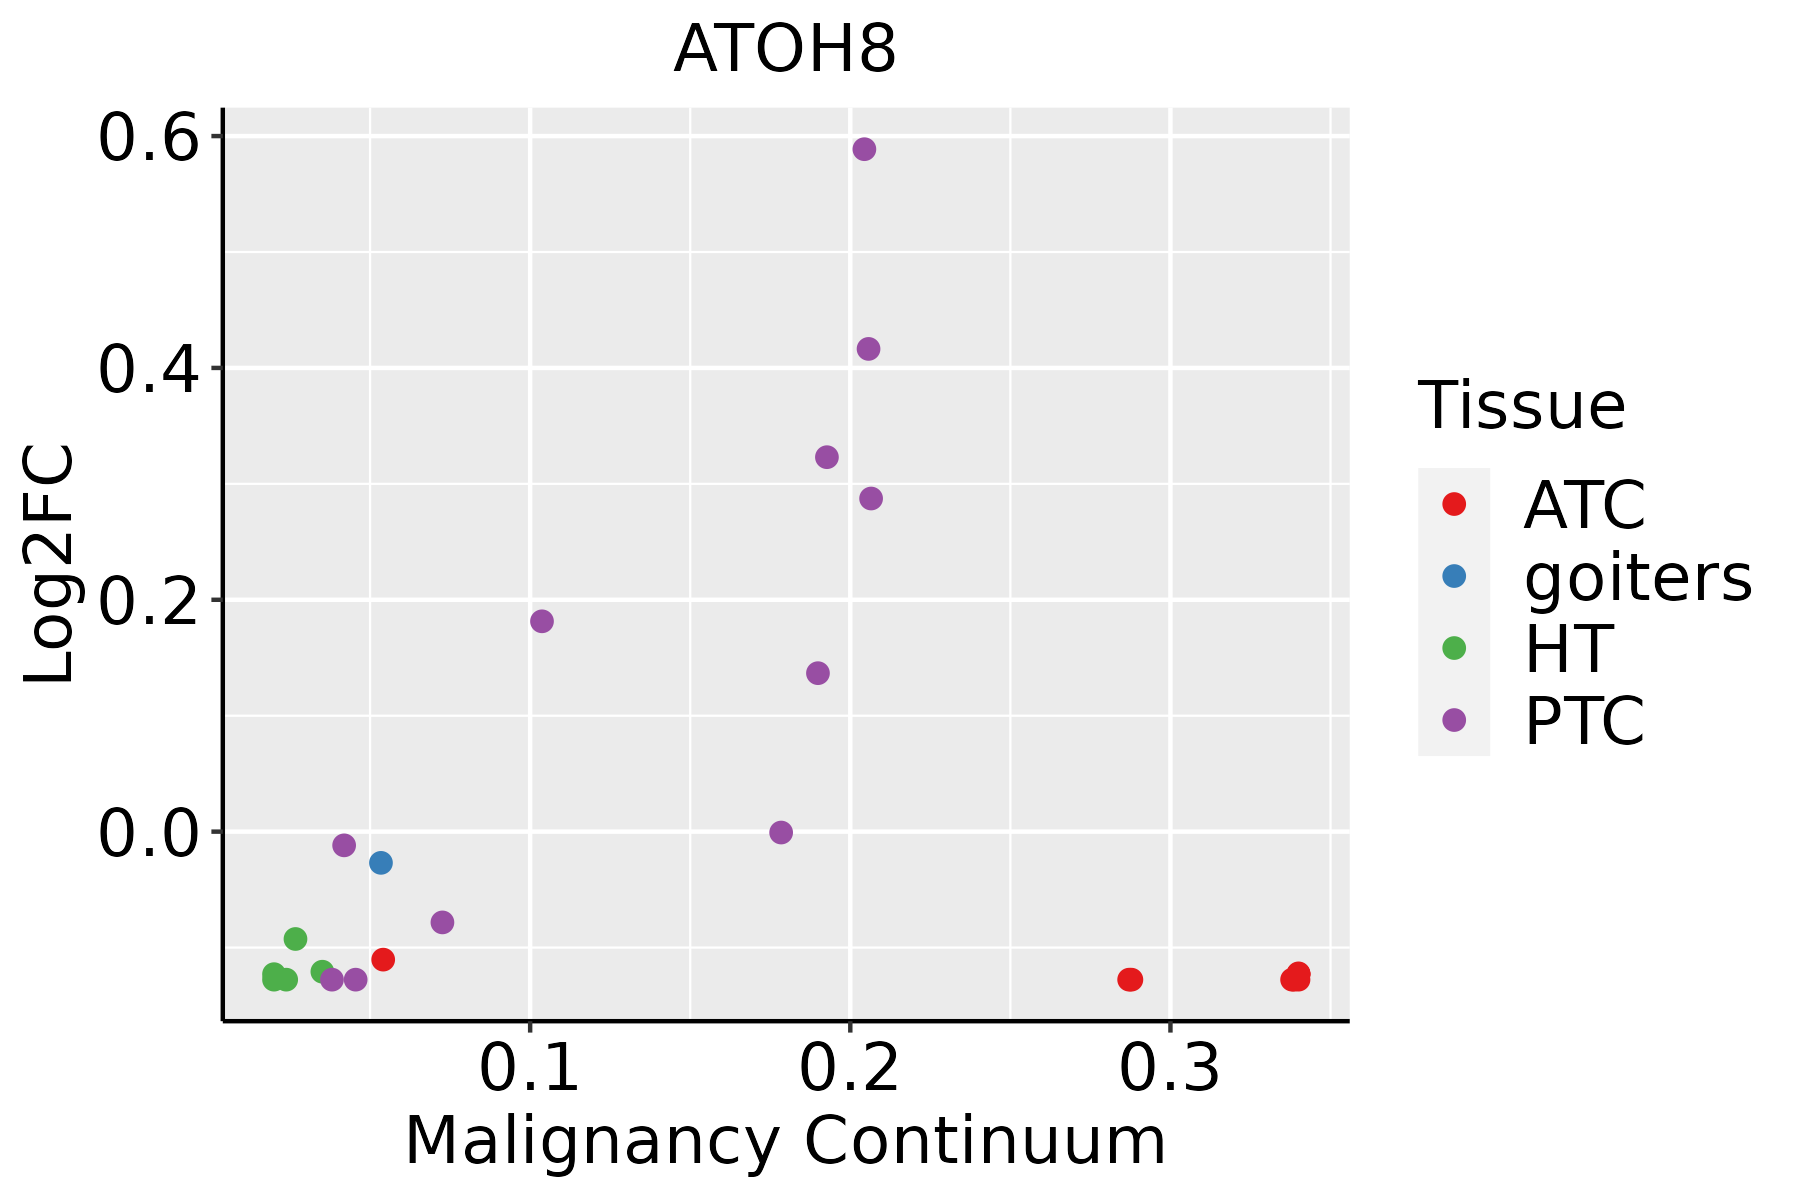 | ATC: Anaplastic thyroid cancer |
| HT: Hashimoto's thyroiditis | ||
| PTC: Papillary thyroid cancer |
| ∗log2FC in expression of this searched gene in stem-like cells from each diseased tissue sample relative to stem-like cells in normal samples in each tissue plotted against the malignancy continuum. Samples are colored based on if they are from different disease stage. |
Top |
Malignant transformation related pathway analysis |
| Find out the enriched GO biological processes and KEGG pathways involved in transition from healthy to precancer to cancer |
| Tissue | Disease Stage | Enriched GO biological Processes |
| Colorectum | AD |  |
| Colorectum | SER |  |
| Colorectum | MSS |  |
| Colorectum | MSI-H |  |
| Colorectum | FAP |  |
| ∗Top 15 enriched GO BP terms are showed in the bar plot of each disease state in each tissue. Each row represents a significant GO biological process which is colored according to the -log10(p.adjust). |
| Page: 1 2 3 4 5 6 7 8 9 |
| GO ID | Tissue | Disease Stage | Description | Gene Ratio | Bg Ratio | pvalue | p.adjust | Count |
| GO:006161422 | Liver | HCC | pri-miRNA transcription by RNA polymerase II | 35/7958 | 55/18723 | 1.26e-03 | 6.92e-03 | 35 |
| GO:190289312 | Liver | HCC | regulation of pri-miRNA transcription by RNA polymerase II | 34/7958 | 54/18723 | 1.92e-03 | 9.78e-03 | 34 |
| GO:00351484 | Liver | HCC | tube formation | 77/7958 | 148/18723 | 1.20e-02 | 4.39e-02 | 77 |
| GO:000166721 | Liver | HCC | ameboidal-type cell migration | 226/7958 | 475/18723 | 1.35e-02 | 4.81e-02 | 226 |
| GO:000717819 | Thyroid | PTC | transmembrane receptor protein serine/threonine kinase signaling pathway | 156/5968 | 355/18723 | 1.02e-06 | 1.51e-05 | 156 |
| GO:0001667112 | Thyroid | PTC | ameboidal-type cell migration | 198/5968 | 475/18723 | 3.36e-06 | 4.34e-05 | 198 |
| GO:0010634111 | Thyroid | PTC | positive regulation of epithelial cell migration | 85/5968 | 176/18723 | 3.83e-06 | 4.80e-05 | 85 |
| GO:003514819 | Thyroid | PTC | tube formation | 73/5968 | 148/18723 | 7.04e-06 | 8.31e-05 | 73 |
| GO:0010631111 | Thyroid | PTC | epithelial cell migration | 149/5968 | 357/18723 | 4.83e-05 | 4.33e-04 | 149 |
| GO:000736910 | Thyroid | PTC | gastrulation | 84/5968 | 185/18723 | 7.58e-05 | 6.52e-04 | 84 |
| GO:0090132111 | Thyroid | PTC | epithelium migration | 149/5968 | 360/18723 | 7.89e-05 | 6.74e-04 | 149 |
| GO:0090130111 | Thyroid | PTC | tissue migration | 150/5968 | 365/18723 | 1.13e-04 | 9.01e-04 | 150 |
| GO:0010632111 | Thyroid | PTC | regulation of epithelial cell migration | 123/5968 | 292/18723 | 1.33e-04 | 1.05e-03 | 123 |
| GO:00017046 | Thyroid | PTC | formation of primary germ layer | 57/5968 | 121/18723 | 3.23e-04 | 2.23e-03 | 57 |
| GO:001059516 | Thyroid | PTC | positive regulation of endothelial cell migration | 61/5968 | 133/18723 | 4.95e-04 | 3.25e-03 | 61 |
| GO:0003158111 | Thyroid | PTC | endothelium development | 62/5968 | 136/18723 | 5.45e-04 | 3.48e-03 | 62 |
| GO:004544619 | Thyroid | PTC | endothelial cell differentiation | 55/5968 | 118/18723 | 5.64e-04 | 3.59e-03 | 55 |
| GO:004354219 | Thyroid | PTC | endothelial cell migration | 112/5968 | 279/18723 | 2.03e-03 | 1.09e-02 | 112 |
| GO:0061614111 | Thyroid | PTC | pri-miRNA transcription by RNA polymerase II | 28/5968 | 55/18723 | 2.55e-03 | 1.31e-02 | 28 |
| GO:1902893110 | Thyroid | PTC | regulation of pri-miRNA transcription by RNA polymerase II | 27/5968 | 54/18723 | 4.18e-03 | 1.99e-02 | 27 |
| Page: 1 2 |
| Pathway ID | Tissue | Disease Stage | Description | Gene Ratio | Bg Ratio | pvalue | p.adjust | qvalue | Count |
| Page: 1 |
Top |
Cell-cell communication analysis |
| Identification of potential cell-cell interactions between two cell types and their ligand-receptor pairs for different disease states |
| Ligand | Receptor | LRpair | Pathway | Tissue | Disease Stage |
| Page: 1 |
Top |
Single-cell gene regulatory network inference analysis |
| Find out the significant the regulons (TFs) and the target genes of each regulon across cell types for different disease states |
| TF | Cell Type | Tissue | Disease Stage | Target Gene | RSS | Regulon Activity |
| ATOH8 | BAS | Breast | Healthy | FADS3,C2orf40,LGALS1, etc. | 2.13e-01 |  |
| ATOH8 | SURF | Endometrium | Healthy | CLU,DUSP23,SCGB2A1, etc. | 4.16e-01 |  |
| ATOH8 | CLUB | Lung | Healthy | FDFT1,BMPR1A,BCAP31, etc. | 1.43e-01 |  |
| ATOH8 | MVA | Stomach | ADJ | CA4,RBP7,PLVAP, etc. | 3.45e-01 |  |
| ATOH8 | MVA | Stomach | CSG | CA4,RBP7,PLVAP, etc. | 2.14e-01 |  |
| ∗The dot plots of a searched regulon are shown for all cell subpopulations in each disease state of each tissue based on the regulon specific score inferred using pySCENIC and by calculating the average expression. |
| Page: 1 |
Top |
Somatic mutation of malignant transformation related genes |
| Annotation of somatic variants for genes involved in malignant transformation |
| Hugo Symbol | Variant Class | Variant Classification | dbSNP RS | HGVSc | HGVSp | HGVSp Short | SWISSPROT | BIOTYPE | SIFT | PolyPhen | Tumor Sample Barcode | Tissue | Histology | Sex | Age | Stage | Therapy Types | Drugs | Outcome |
| ATOH8 | SNV | Missense_Mutation | novel | c.907N>T | p.Val303Leu | p.V303L | Q96SQ7 | protein_coding | tolerated(0.06) | benign(0.012) | TCGA-C5-A8YT-01 | Cervix | cervical & endocervical cancer | Female | <65 | I/II | Chemotherapy | cisplatin | PD |
| ATOH8 | SNV | Missense_Mutation | c.751G>C | p.Glu251Gln | p.E251Q | Q96SQ7 | protein_coding | deleterious(0) | probably_damaging(0.993) | TCGA-DS-A0VL-01 | Cervix | cervical & endocervical cancer | Female | <65 | I/II | Unknown | Unknown | SD | |
| ATOH8 | SNV | Missense_Mutation | rs760406327 | c.943C>T | p.Arg315Cys | p.R315C | Q96SQ7 | protein_coding | deleterious(0) | probably_damaging(0.976) | TCGA-AA-3864-01 | Colorectum | colon adenocarcinoma | Male | >=65 | I/II | Unknown | Unknown | SD |
| ATOH8 | SNV | Missense_Mutation | c.123N>C | p.Lys41Asn | p.K41N | Q96SQ7 | protein_coding | deleterious_low_confidence(0) | probably_damaging(0.981) | TCGA-AP-A056-01 | Endometrium | uterine corpus endometrioid carcinoma | Female | <65 | I/II | Unknown | Unknown | SD | |
| ATOH8 | SNV | Missense_Mutation | c.605N>G | p.Asn202Ser | p.N202S | Q96SQ7 | protein_coding | tolerated(0.1) | benign(0.425) | TCGA-AP-A0LM-01 | Endometrium | uterine corpus endometrioid carcinoma | Female | <65 | III/IV | Chemotherapy | cisplatin | SD | |
| ATOH8 | SNV | Missense_Mutation | rs768036689 | c.602N>C | p.Asn201Thr | p.N201T | Q96SQ7 | protein_coding | tolerated(0.23) | possibly_damaging(0.624) | TCGA-AX-A06F-01 | Endometrium | uterine corpus endometrioid carcinoma | Female | <65 | III/IV | Chemotherapy | carboplatin | SD |
| ATOH8 | SNV | Missense_Mutation | c.897N>A | p.Phe299Leu | p.F299L | Q96SQ7 | protein_coding | tolerated(0.08) | benign(0.063) | TCGA-D1-A103-01 | Endometrium | uterine corpus endometrioid carcinoma | Female | >=65 | I/II | Unknown | Unknown | SD | |
| ATOH8 | SNV | Missense_Mutation | rs754920791 | c.955N>T | p.Arg319Cys | p.R319C | Q96SQ7 | protein_coding | deleterious(0) | probably_damaging(0.989) | TCGA-D1-A17M-01 | Endometrium | uterine corpus endometrioid carcinoma | Female | <65 | I/II | Unknown | Unknown | SD |
| ATOH8 | SNV | Missense_Mutation | novel | c.872N>C | p.Ser291Thr | p.S291T | Q96SQ7 | protein_coding | tolerated(0.32) | benign(0.046) | TCGA-EY-A1GU-01 | Endometrium | uterine corpus endometrioid carcinoma | Female | >=65 | I/II | Unknown | Unknown | SD |
| ATOH8 | SNV | Missense_Mutation | rs372705499 | c.914N>A | p.Arg305His | p.R305H | Q96SQ7 | protein_coding | deleterious(0.01) | benign(0.346) | TCGA-EY-A215-01 | Endometrium | uterine corpus endometrioid carcinoma | Female | <65 | I/II | Unknown | Unknown | SD |
| Page: 1 2 |
Top |
Related drugs of malignant transformation related genes |
| Identification of chemicals and drugs interact with genes involved in malignant transfromation |
| (DGIdb 4.0) |
| Entrez ID | Symbol | Category | Interaction Types | Drug Claim Name | Drug Name | PMIDs |
| Page: 1 |

Copyright 2023-Present -The University of Texas Health Science Center at Houston |