
|
|||||
|
 | |
| |
| |
| |
| |
| |
|
Gene: ATN1 |
Gene summary for ATN1 |
| Gene information | Species | Human | Gene symbol | ATN1 | Gene ID | 1822 |
| Gene name | atrophin 1 | |
| Gene Alias | B37 | |
| Cytomap | 12p13.31 | |
| Gene Type | protein-coding | GO ID | GO:0000122 | UniProtAcc | P54259 |
Top |
Malignant transformation analysis |
| Identification of the aberrant gene expression in precancerous and cancerous lesions by comparing the gene expression of stem-like cells in diseased tissues with normal stem cells |
| Entrez ID | Symbol | Replicates | Species | Organ | Tissue | Adj P-value | Log2FC | Malignancy |
| 1822 | ATN1 | LZE2T | Human | Esophagus | ESCC | 2.57e-03 | 2.29e-01 | 0.082 |
| 1822 | ATN1 | LZE4T | Human | Esophagus | ESCC | 1.88e-06 | -9.47e-02 | 0.0811 |
| 1822 | ATN1 | LZE5T | Human | Esophagus | ESCC | 4.14e-02 | -4.37e-02 | 0.0514 |
| 1822 | ATN1 | LZE7T | Human | Esophagus | ESCC | 7.77e-11 | 5.86e-01 | 0.0667 |
| 1822 | ATN1 | LZE8T | Human | Esophagus | ESCC | 4.71e-11 | 3.23e-01 | 0.067 |
| 1822 | ATN1 | LZE20T | Human | Esophagus | ESCC | 1.87e-05 | 6.55e-02 | 0.0662 |
| 1822 | ATN1 | LZE22T | Human | Esophagus | ESCC | 2.44e-03 | 2.04e-01 | 0.068 |
| 1822 | ATN1 | LZE24T | Human | Esophagus | ESCC | 9.30e-07 | 2.37e-01 | 0.0596 |
| 1822 | ATN1 | LZE6T | Human | Esophagus | ESCC | 3.77e-06 | 5.98e-02 | 0.0845 |
| 1822 | ATN1 | P1T-E | Human | Esophagus | ESCC | 1.75e-09 | 3.49e-01 | 0.0875 |
| 1822 | ATN1 | P2T-E | Human | Esophagus | ESCC | 1.24e-27 | 5.78e-01 | 0.1177 |
| 1822 | ATN1 | P4T-E | Human | Esophagus | ESCC | 1.03e-11 | 3.23e-01 | 0.1323 |
| 1822 | ATN1 | P5T-E | Human | Esophagus | ESCC | 1.45e-10 | -5.81e-02 | 0.1327 |
| 1822 | ATN1 | P8T-E | Human | Esophagus | ESCC | 2.48e-27 | 5.91e-01 | 0.0889 |
| 1822 | ATN1 | P9T-E | Human | Esophagus | ESCC | 7.42e-06 | 9.00e-02 | 0.1131 |
| 1822 | ATN1 | P10T-E | Human | Esophagus | ESCC | 4.74e-16 | 3.34e-01 | 0.116 |
| 1822 | ATN1 | P11T-E | Human | Esophagus | ESCC | 4.36e-05 | 1.53e-01 | 0.1426 |
| 1822 | ATN1 | P12T-E | Human | Esophagus | ESCC | 1.15e-31 | 2.98e-01 | 0.1122 |
| 1822 | ATN1 | P15T-E | Human | Esophagus | ESCC | 1.11e-14 | 2.94e-01 | 0.1149 |
| 1822 | ATN1 | P16T-E | Human | Esophagus | ESCC | 3.03e-32 | 7.36e-01 | 0.1153 |
| Page: 1 2 3 4 5 6 |
| Tissue | Expression Dynamics | Abbreviation |
| Esophagus | 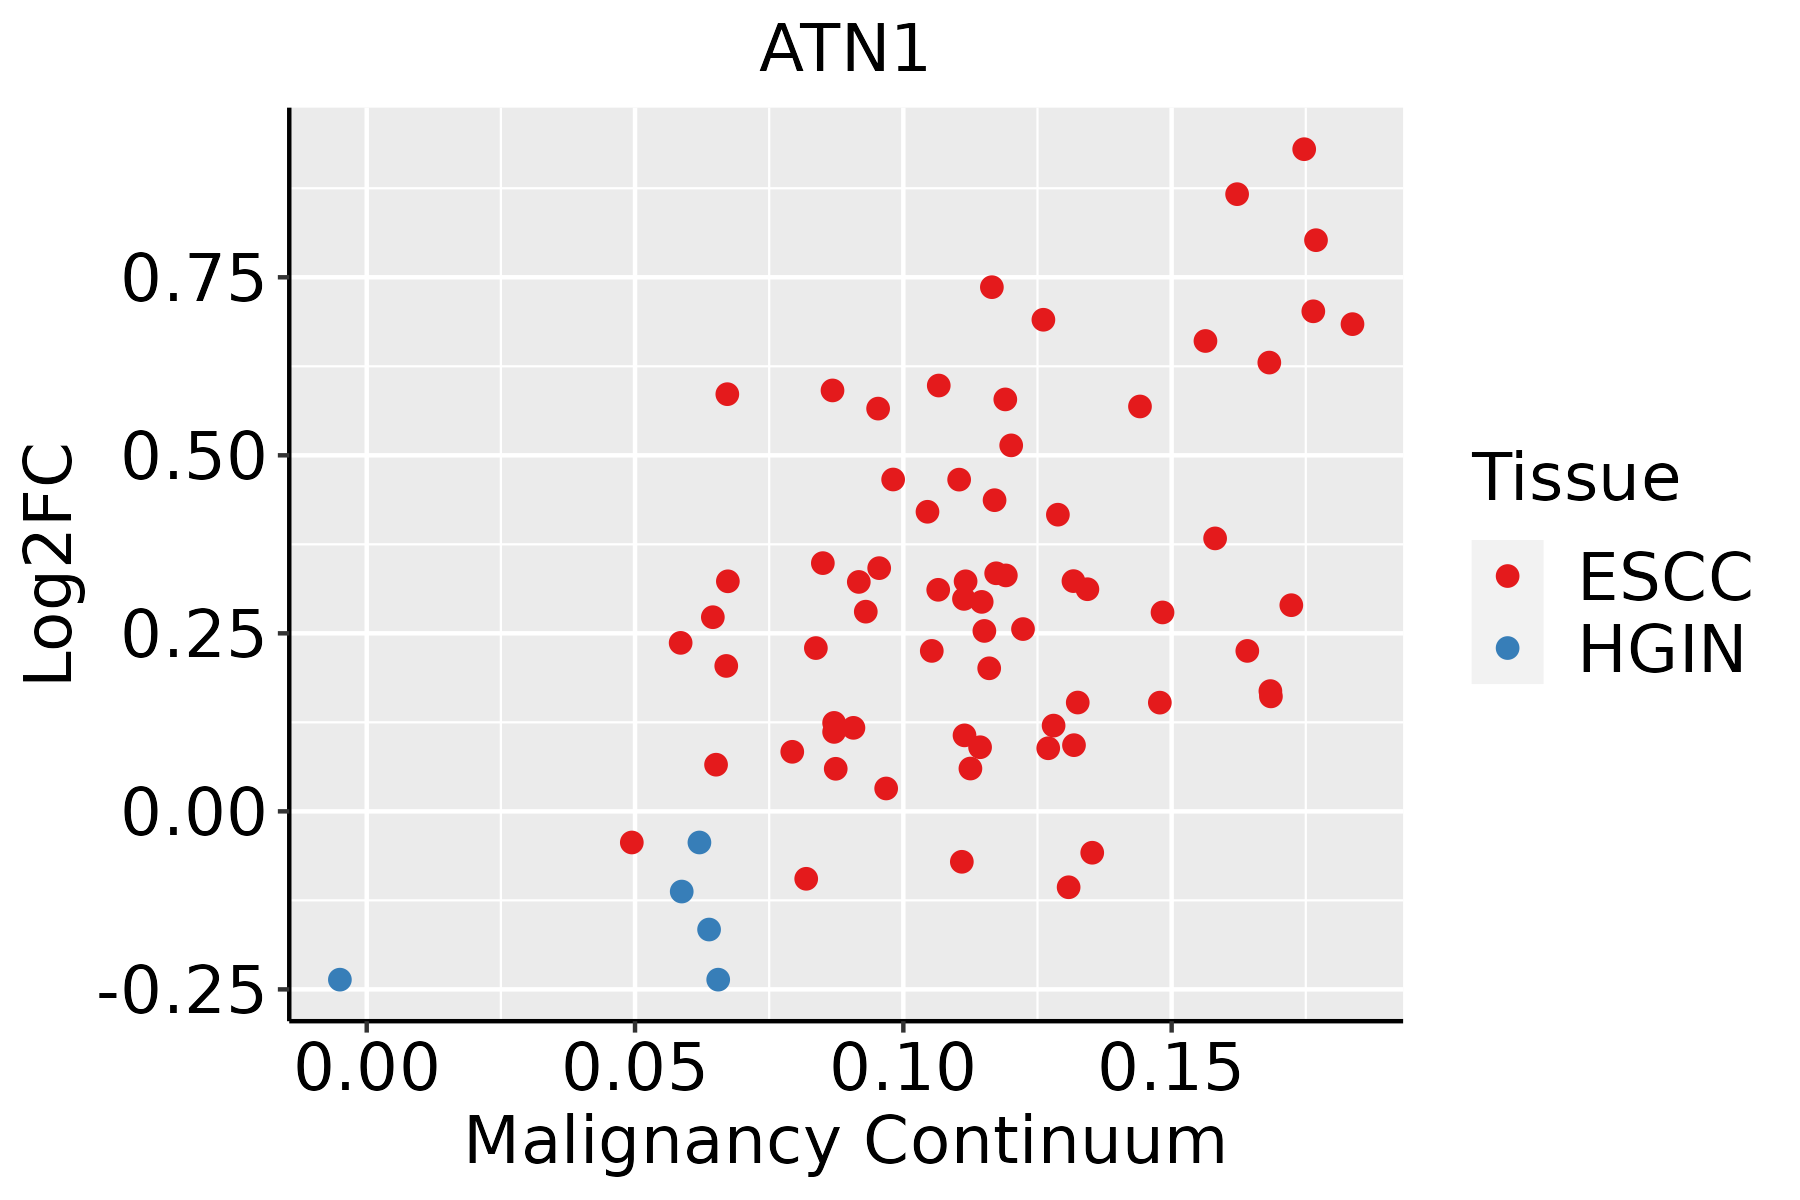 | ESCC: Esophageal squamous cell carcinoma |
| HGIN: High-grade intraepithelial neoplasias | ||
| LGIN: Low-grade intraepithelial neoplasias | ||
| Liver | 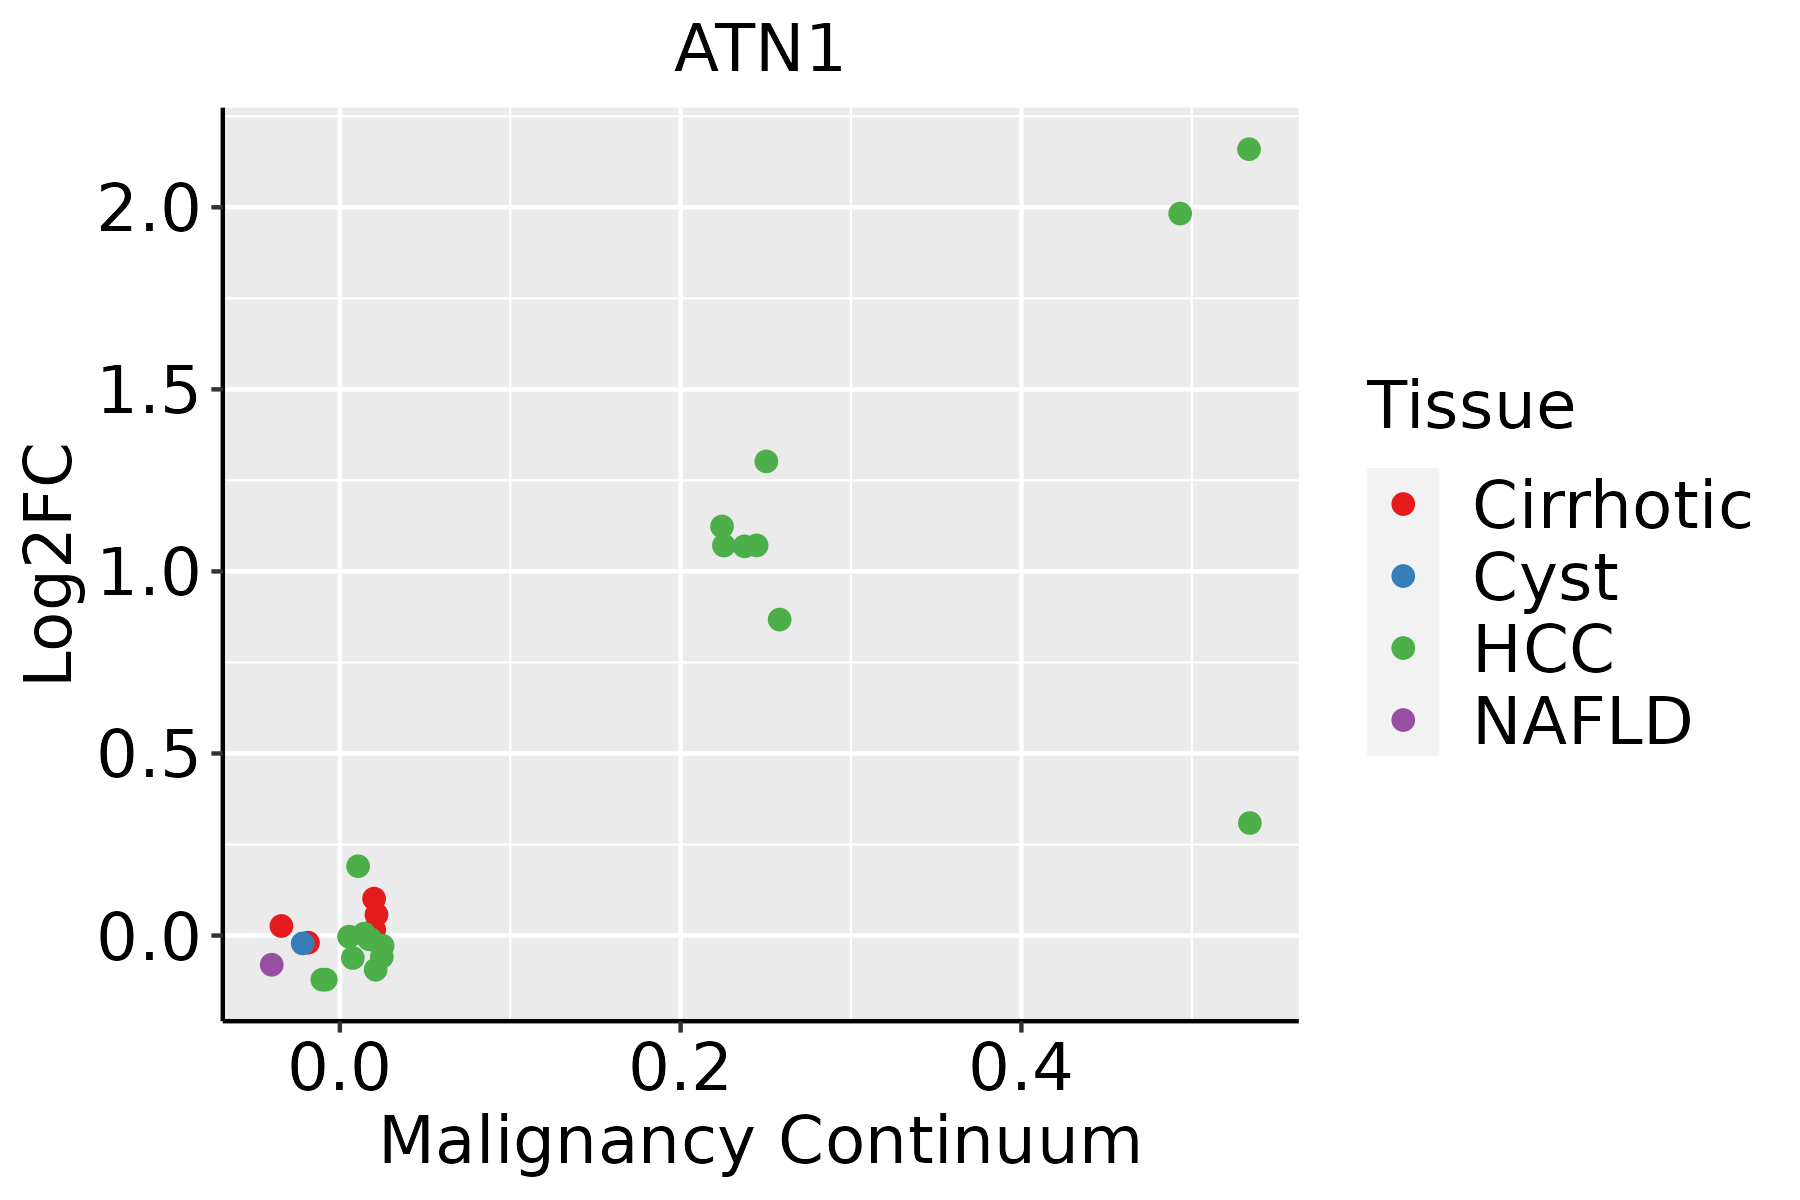 | HCC: Hepatocellular carcinoma |
| NAFLD: Non-alcoholic fatty liver disease | ||
| Oral Cavity | 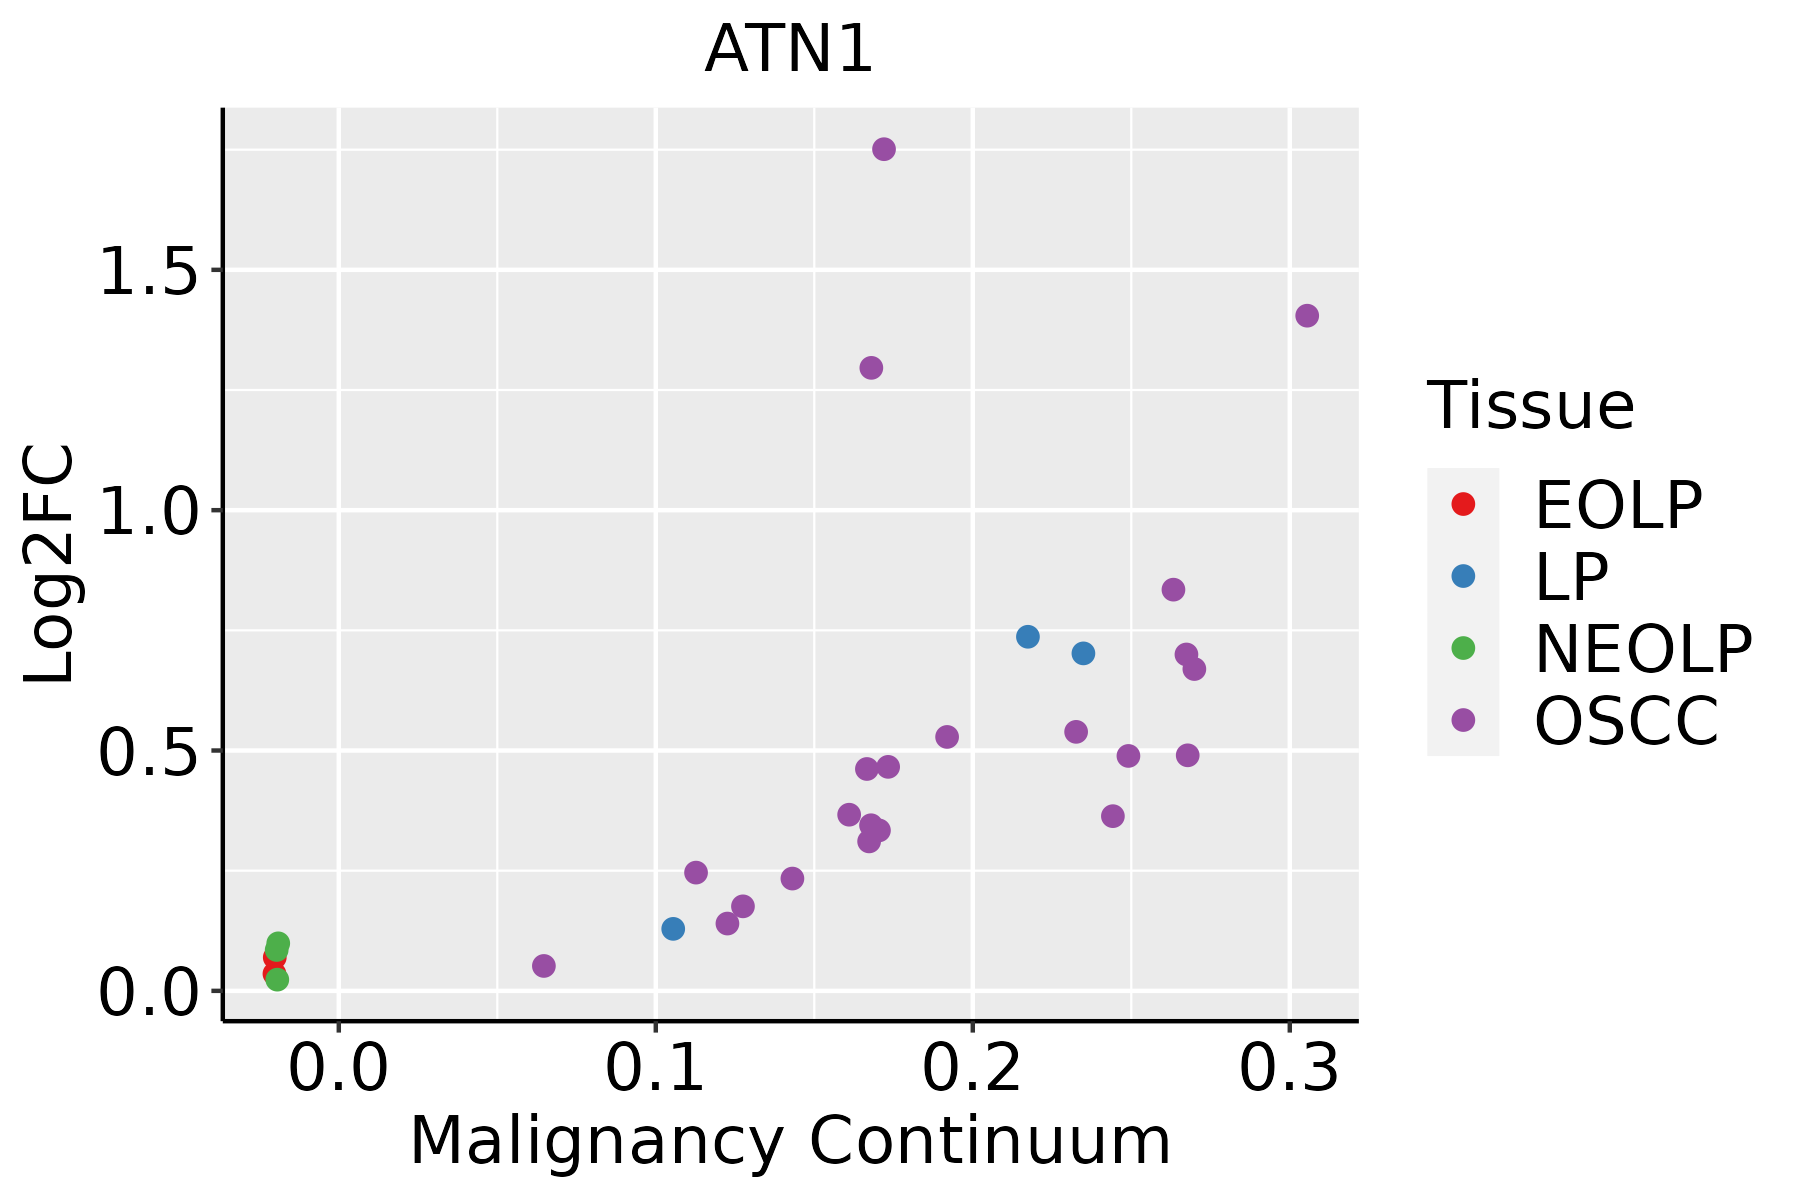 | EOLP: Erosive Oral lichen planus |
| LP: leukoplakia | ||
| NEOLP: Non-erosive oral lichen planus | ||
| OSCC: Oral squamous cell carcinoma | ||
| Thyroid | 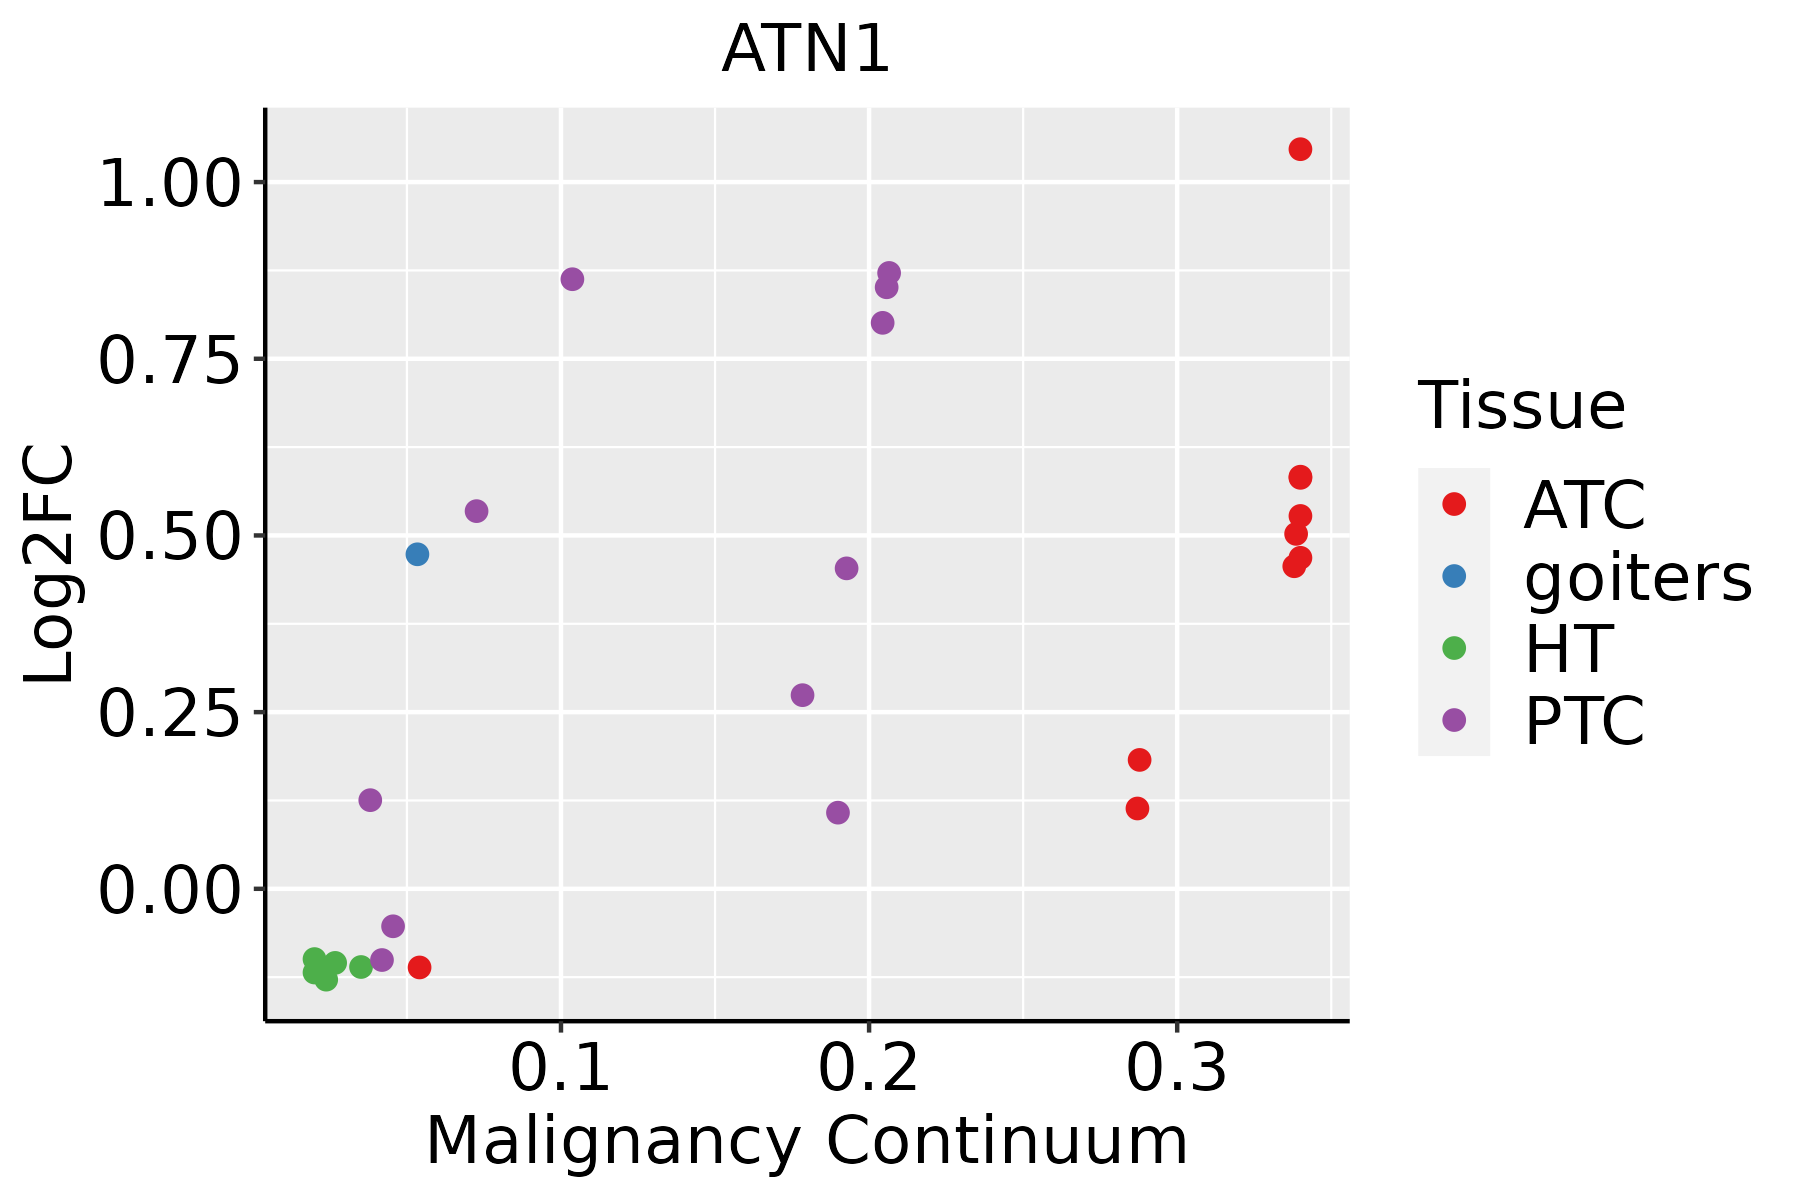 | ATC: Anaplastic thyroid cancer |
| HT: Hashimoto's thyroiditis | ||
| PTC: Papillary thyroid cancer |
| ∗log2FC in expression of this searched gene in stem-like cells from each diseased tissue sample relative to stem-like cells in normal samples in each tissue plotted against the malignancy continuum. Samples are colored based on if they are from different disease stage. |
Top |
Malignant transformation related pathway analysis |
| Find out the enriched GO biological processes and KEGG pathways involved in transition from healthy to precancer to cancer |
| Tissue | Disease Stage | Enriched GO biological Processes |
| Colorectum | AD |  |
| Colorectum | SER |  |
| Colorectum | MSS |  |
| Colorectum | MSI-H |  |
| Colorectum | FAP |  |
| ∗Top 15 enriched GO BP terms are showed in the bar plot of each disease state in each tissue. Each row represents a significant GO biological process which is colored according to the -log10(p.adjust). |
| Page: 1 2 3 4 5 6 7 8 9 |
| GO ID | Tissue | Disease Stage | Description | Gene Ratio | Bg Ratio | pvalue | p.adjust | Count |
| GO:0070997111 | Esophagus | ESCC | neuron death | 216/8552 | 361/18723 | 3.49e-08 | 6.45e-07 | 216 |
| GO:0051402110 | Esophagus | ESCC | neuron apoptotic process | 148/8552 | 246/18723 | 3.08e-06 | 3.47e-05 | 148 |
| GO:007099712 | Liver | Cirrhotic | neuron death | 141/4634 | 361/18723 | 9.56e-10 | 4.38e-08 | 141 |
| GO:00514027 | Liver | Cirrhotic | neuron apoptotic process | 91/4634 | 246/18723 | 1.18e-05 | 1.68e-04 | 91 |
| GO:007099722 | Liver | HCC | neuron death | 202/7958 | 361/18723 | 1.44e-07 | 2.70e-06 | 202 |
| GO:005140212 | Liver | HCC | neuron apoptotic process | 135/7958 | 246/18723 | 5.64e-05 | 5.26e-04 | 135 |
| GO:007099720 | Oral cavity | OSCC | neuron death | 202/7305 | 361/18723 | 3.75e-11 | 1.23e-09 | 202 |
| GO:005140217 | Oral cavity | OSCC | neuron apoptotic process | 134/7305 | 246/18723 | 5.65e-07 | 8.19e-06 | 134 |
| GO:0070997110 | Oral cavity | LP | neuron death | 135/4623 | 361/18723 | 4.31e-08 | 1.52e-06 | 135 |
| GO:005140218 | Oral cavity | LP | neuron apoptotic process | 91/4623 | 246/18723 | 1.07e-05 | 1.94e-04 | 91 |
| GO:0070997113 | Thyroid | PTC | neuron death | 171/5968 | 361/18723 | 4.32e-10 | 1.38e-08 | 171 |
| GO:0051402112 | Thyroid | PTC | neuron apoptotic process | 118/5968 | 246/18723 | 8.99e-08 | 1.81e-06 | 118 |
| GO:0070997210 | Thyroid | ATC | neuron death | 176/6293 | 361/18723 | 1.43e-09 | 3.57e-08 | 176 |
| GO:005140227 | Thyroid | ATC | neuron apoptotic process | 120/6293 | 246/18723 | 5.41e-07 | 7.75e-06 | 120 |
| Page: 1 |
| Pathway ID | Tissue | Disease Stage | Description | Gene Ratio | Bg Ratio | pvalue | p.adjust | qvalue | Count |
| Page: 1 |
Top |
Cell-cell communication analysis |
| Identification of potential cell-cell interactions between two cell types and their ligand-receptor pairs for different disease states |
| Ligand | Receptor | LRpair | Pathway | Tissue | Disease Stage |
| Page: 1 |
Top |
Single-cell gene regulatory network inference analysis |
| Find out the significant the regulons (TFs) and the target genes of each regulon across cell types for different disease states |
| TF | Cell Type | Tissue | Disease Stage | Target Gene | RSS | Regulon Activity |
| ∗The dot plots of a searched regulon are shown for all cell subpopulations in each disease state of each tissue based on the regulon specific score inferred using pySCENIC and by calculating the average expression. |
| Page: 1 |
Top |
Somatic mutation of malignant transformation related genes |
| Annotation of somatic variants for genes involved in malignant transformation |
| Hugo Symbol | Variant Class | Variant Classification | dbSNP RS | HGVSc | HGVSp | HGVSp Short | SWISSPROT | BIOTYPE | SIFT | PolyPhen | Tumor Sample Barcode | Tissue | Histology | Sex | Age | Stage | Therapy Types | Drugs | Outcome |
| ATN1 | SNV | Missense_Mutation | novel | c.3392C>G | p.Ser1131Cys | p.S1131C | P54259 | protein_coding | deleterious_low_confidence(0.01) | probably_damaging(0.99) | TCGA-5L-AAT1-01 | Breast | breast invasive carcinoma | Female | <65 | III/IV | Hormone Therapy | letrozol | SD |
| ATN1 | SNV | Missense_Mutation | c.1031C>T | p.Pro344Leu | p.P344L | P54259 | protein_coding | deleterious_low_confidence(0) | benign(0) | TCGA-A2-A0CL-01 | Breast | breast invasive carcinoma | Female | <65 | III/IV | Chemotherapy | cytoxan | SD | |
| ATN1 | SNV | Missense_Mutation | c.3186N>G | p.His1062Gln | p.H1062Q | P54259 | protein_coding | deleterious_low_confidence(0.01) | benign(0.125) | TCGA-AC-A23H-01 | Breast | breast invasive carcinoma | Female | >=65 | I/II | Unknown | Unknown | PD | |
| ATN1 | SNV | Missense_Mutation | novel | c.3028N>T | p.Ala1010Ser | p.A1010S | P54259 | protein_coding | tolerated_low_confidence(0.11) | possibly_damaging(0.489) | TCGA-AC-A3QP-01 | Breast | breast invasive carcinoma | Female | >=65 | I/II | Hormone Therapy | femara | SD |
| ATN1 | SNV | Missense_Mutation | c.2881N>T | p.His961Tyr | p.H961Y | P54259 | protein_coding | deleterious_low_confidence(0.04) | probably_damaging(0.985) | TCGA-AR-A1AQ-01 | Breast | breast invasive carcinoma | Female | <65 | I/II | Chemotherapy | doxorubicin | SD | |
| ATN1 | SNV | Missense_Mutation | c.3266N>C | p.Leu1089Pro | p.L1089P | P54259 | protein_coding | deleterious_low_confidence(0) | probably_damaging(0.999) | TCGA-BH-A0HF-01 | Breast | breast invasive carcinoma | Female | >=65 | I/II | Hormone Therapy | arimidex | SD | |
| ATN1 | SNV | Missense_Mutation | c.3368N>G | p.Tyr1123Cys | p.Y1123C | P54259 | protein_coding | deleterious_low_confidence(0) | probably_damaging(0.997) | TCGA-BH-A0HF-01 | Breast | breast invasive carcinoma | Female | >=65 | I/II | Hormone Therapy | arimidex | SD | |
| ATN1 | SNV | Missense_Mutation | c.3409N>A | p.Ala1137Thr | p.A1137T | P54259 | protein_coding | deleterious_low_confidence(0) | probably_damaging(0.998) | TCGA-BH-A18G-01 | Breast | breast invasive carcinoma | Female | >=65 | I/II | Unknown | Unknown | SD | |
| ATN1 | SNV | Missense_Mutation | novel | c.917N>T | p.Ala306Val | p.A306V | P54259 | protein_coding | deleterious_low_confidence(0) | probably_damaging(0.992) | TCGA-BH-A203-01 | Breast | breast invasive carcinoma | Female | >=65 | I/II | Unknown | Unknown | PD |
| ATN1 | SNV | Missense_Mutation | c.194C>T | p.Pro65Leu | p.P65L | P54259 | protein_coding | tolerated_low_confidence(0.18) | possibly_damaging(0.675) | TCGA-C8-A274-01 | Breast | breast invasive carcinoma | Female | <65 | I/II | Hormone Therapy | tamoxiphen | SD |
| Page: 1 2 3 4 5 6 7 8 9 10 11 12 13 |
Top |
Related drugs of malignant transformation related genes |
| Identification of chemicals and drugs interact with genes involved in malignant transfromation |
| (DGIdb 4.0) |
| Entrez ID | Symbol | Category | Interaction Types | Drug Claim Name | Drug Name | PMIDs |
| Page: 1 |

Copyright 2023-Present -The University of Texas Health Science Center at Houston |