
|
|||||
|
 | |
| |
| |
| |
| |
| |
|
Gene: ATMIN |
Gene summary for ATMIN |
| Gene information | Species | Human | Gene symbol | ATMIN | Gene ID | 23300 |
| Gene name | ATM interactor | |
| Gene Alias | ASCIZ | |
| Cytomap | 16q23.2 | |
| Gene Type | protein-coding | GO ID | GO:0006139 | UniProtAcc | O43313 |
Top |
Malignant transformation analysis |
| Identification of the aberrant gene expression in precancerous and cancerous lesions by comparing the gene expression of stem-like cells in diseased tissues with normal stem cells |
| Entrez ID | Symbol | Replicates | Species | Organ | Tissue | Adj P-value | Log2FC | Malignancy |
| 23300 | ATMIN | HTA11_78_2000001011 | Human | Colorectum | AD | 4.93e-03 | 2.53e-01 | -0.1088 |
| 23300 | ATMIN | HTA11_99999970781_79442 | Human | Colorectum | MSS | 2.02e-06 | 2.65e-01 | 0.294 |
| 23300 | ATMIN | HTA11_99999965062_69753 | Human | Colorectum | MSI-H | 2.74e-02 | 5.73e-01 | 0.3487 |
| 23300 | ATMIN | HTA11_99999971662_82457 | Human | Colorectum | MSS | 1.05e-03 | 1.88e-01 | 0.3859 |
| 23300 | ATMIN | HCC1_Meng | Human | Liver | HCC | 4.47e-26 | -1.28e-02 | 0.0246 |
| 23300 | ATMIN | HCC2_Meng | Human | Liver | HCC | 1.61e-17 | 1.14e-01 | 0.0107 |
| 23300 | ATMIN | HCC1 | Human | Liver | HCC | 4.01e-06 | 3.07e+00 | 0.5336 |
| 23300 | ATMIN | HCC2 | Human | Liver | HCC | 5.12e-15 | 3.55e+00 | 0.5341 |
| 23300 | ATMIN | S014 | Human | Liver | HCC | 1.67e-03 | 2.48e-01 | 0.2254 |
| 23300 | ATMIN | S027 | Human | Liver | HCC | 8.00e-03 | 4.78e-01 | 0.2446 |
| 23300 | ATMIN | S028 | Human | Liver | HCC | 4.16e-11 | 4.31e-01 | 0.2503 |
| 23300 | ATMIN | S029 | Human | Liver | HCC | 1.54e-10 | 5.16e-01 | 0.2581 |
| 23300 | ATMIN | C04 | Human | Oral cavity | OSCC | 1.07e-06 | 5.58e-01 | 0.2633 |
| 23300 | ATMIN | C21 | Human | Oral cavity | OSCC | 5.56e-15 | 6.78e-01 | 0.2678 |
| 23300 | ATMIN | C30 | Human | Oral cavity | OSCC | 4.91e-23 | 8.67e-01 | 0.3055 |
| 23300 | ATMIN | C43 | Human | Oral cavity | OSCC | 5.14e-09 | 1.98e-01 | 0.1704 |
| 23300 | ATMIN | C51 | Human | Oral cavity | OSCC | 1.83e-02 | 4.10e-01 | 0.2674 |
| 23300 | ATMIN | C57 | Human | Oral cavity | OSCC | 8.88e-03 | 2.28e-01 | 0.1679 |
| 23300 | ATMIN | C08 | Human | Oral cavity | OSCC | 2.22e-06 | 2.36e-01 | 0.1919 |
| 23300 | ATMIN | SYSMH1 | Human | Oral cavity | OSCC | 5.75e-07 | 1.71e-01 | 0.1127 |
| Page: 1 2 3 |
| Tissue | Expression Dynamics | Abbreviation |
| Colorectum (GSE201348) | 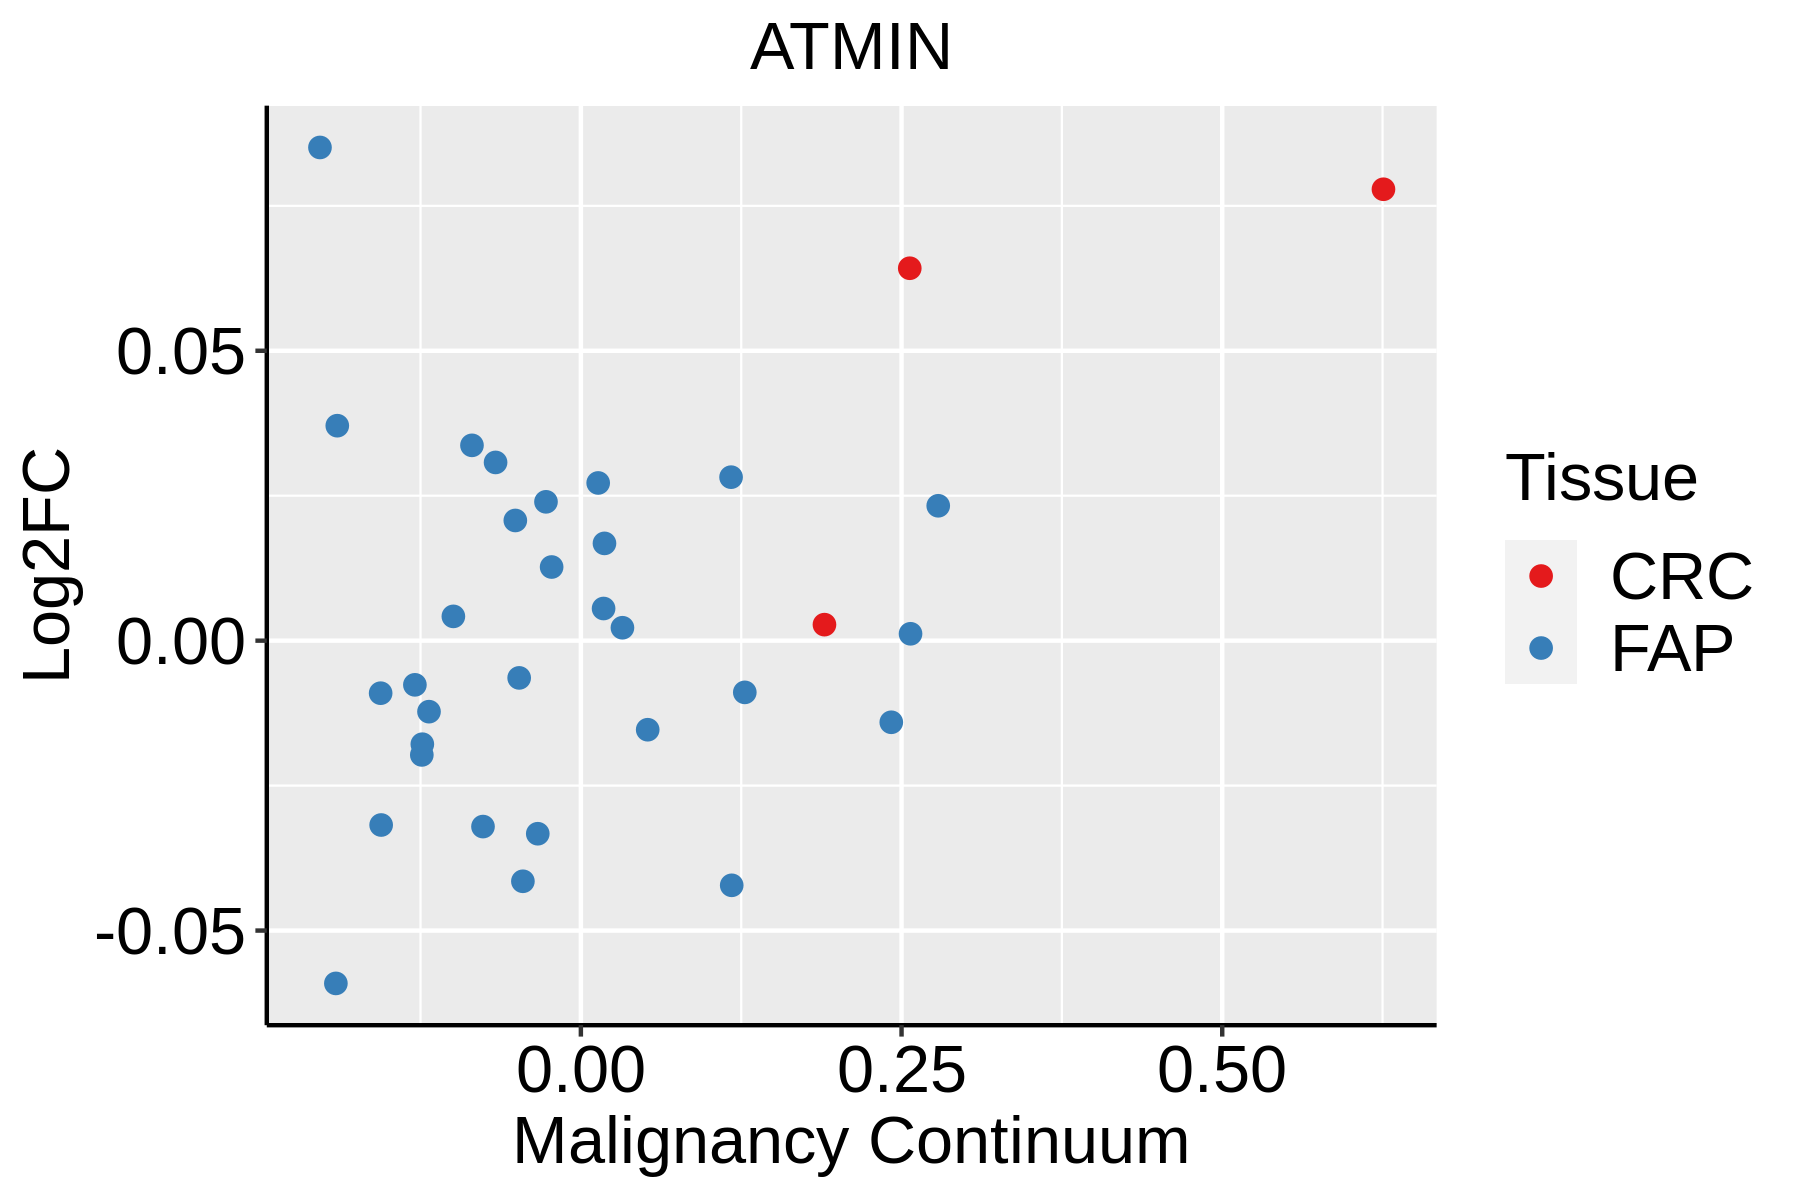 | FAP: Familial adenomatous polyposis |
| CRC: Colorectal cancer | ||
| Colorectum (HTA11) |  | AD: Adenomas |
| SER: Sessile serrated lesions | ||
| MSI-H: Microsatellite-high colorectal cancer | ||
| MSS: Microsatellite stable colorectal cancer | ||
| Liver |  | HCC: Hepatocellular carcinoma |
| NAFLD: Non-alcoholic fatty liver disease | ||
| Oral Cavity | 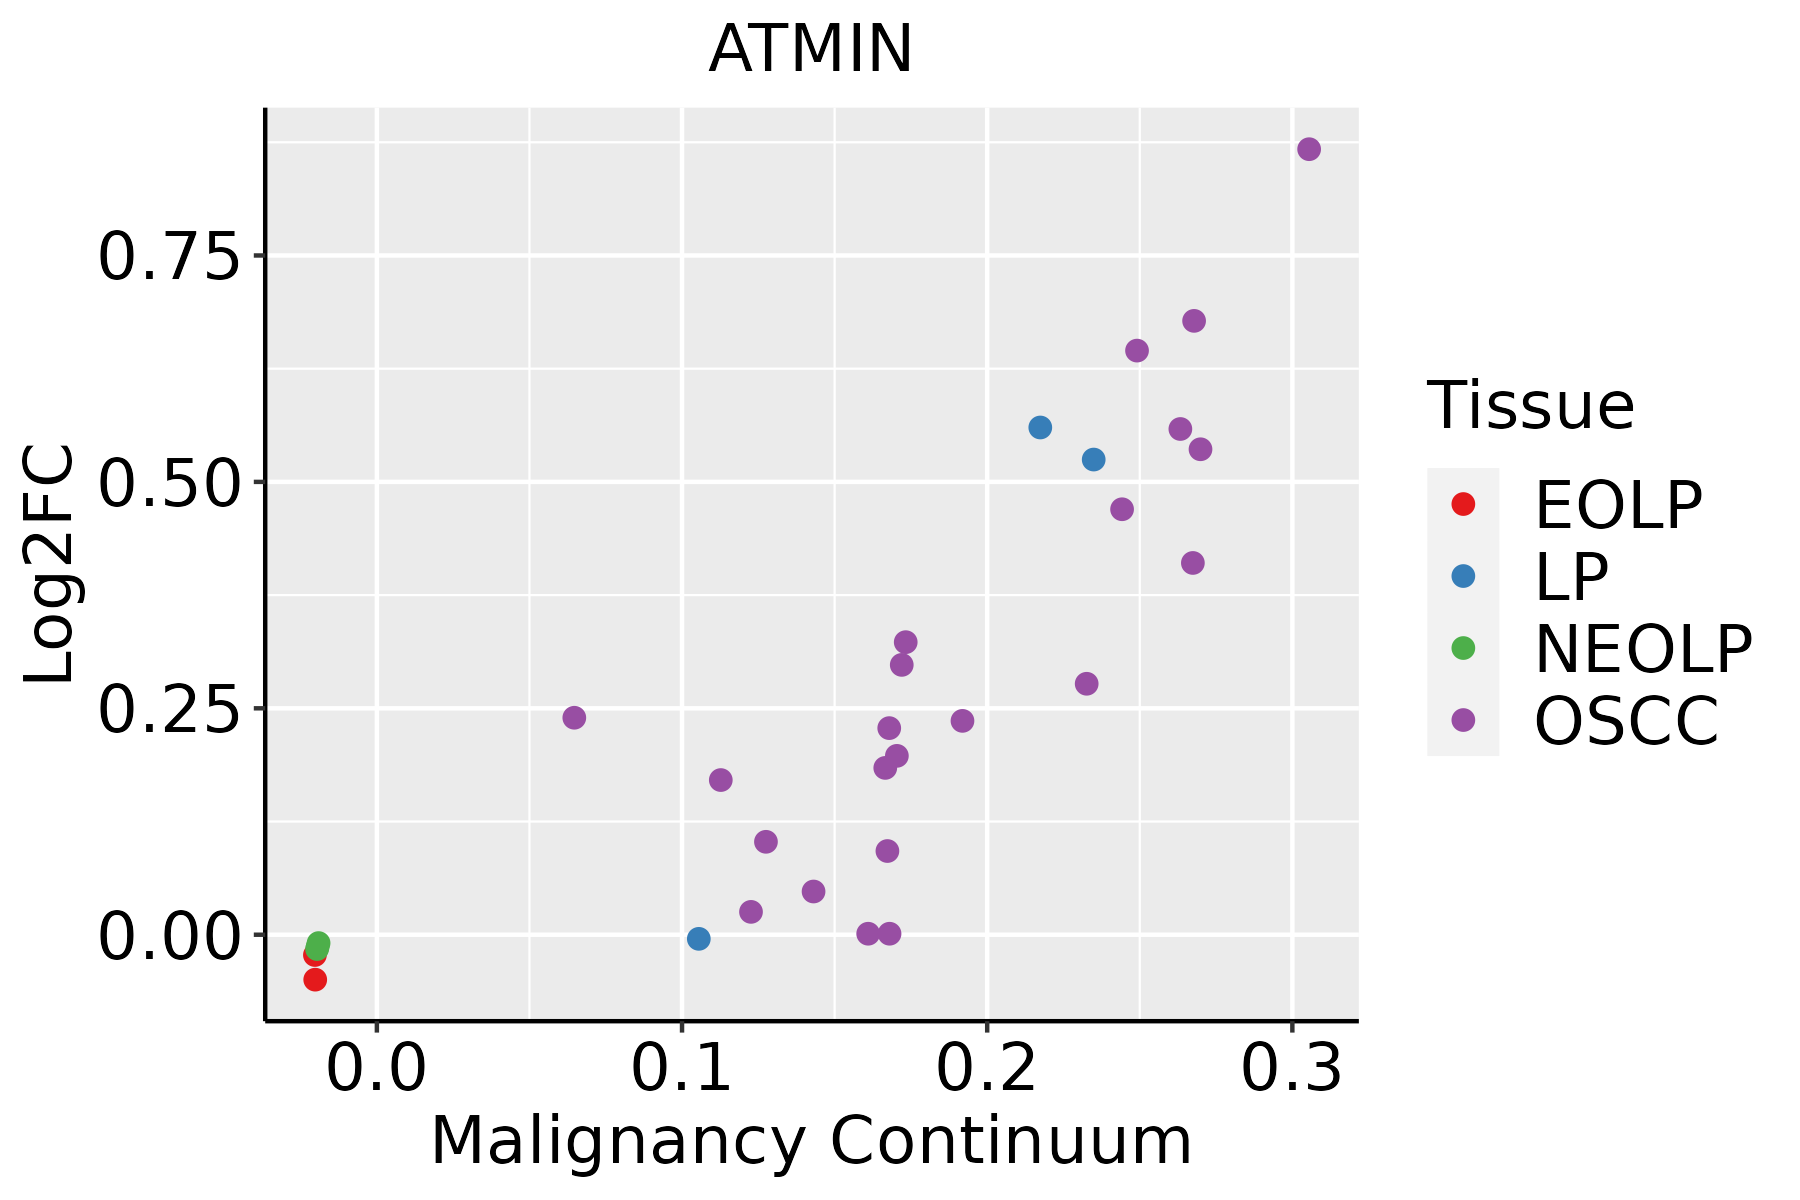 | EOLP: Erosive Oral lichen planus |
| LP: leukoplakia | ||
| NEOLP: Non-erosive oral lichen planus | ||
| OSCC: Oral squamous cell carcinoma | ||
| Prostate |  | BPH: Benign Prostatic Hyperplasia |
| Thyroid | 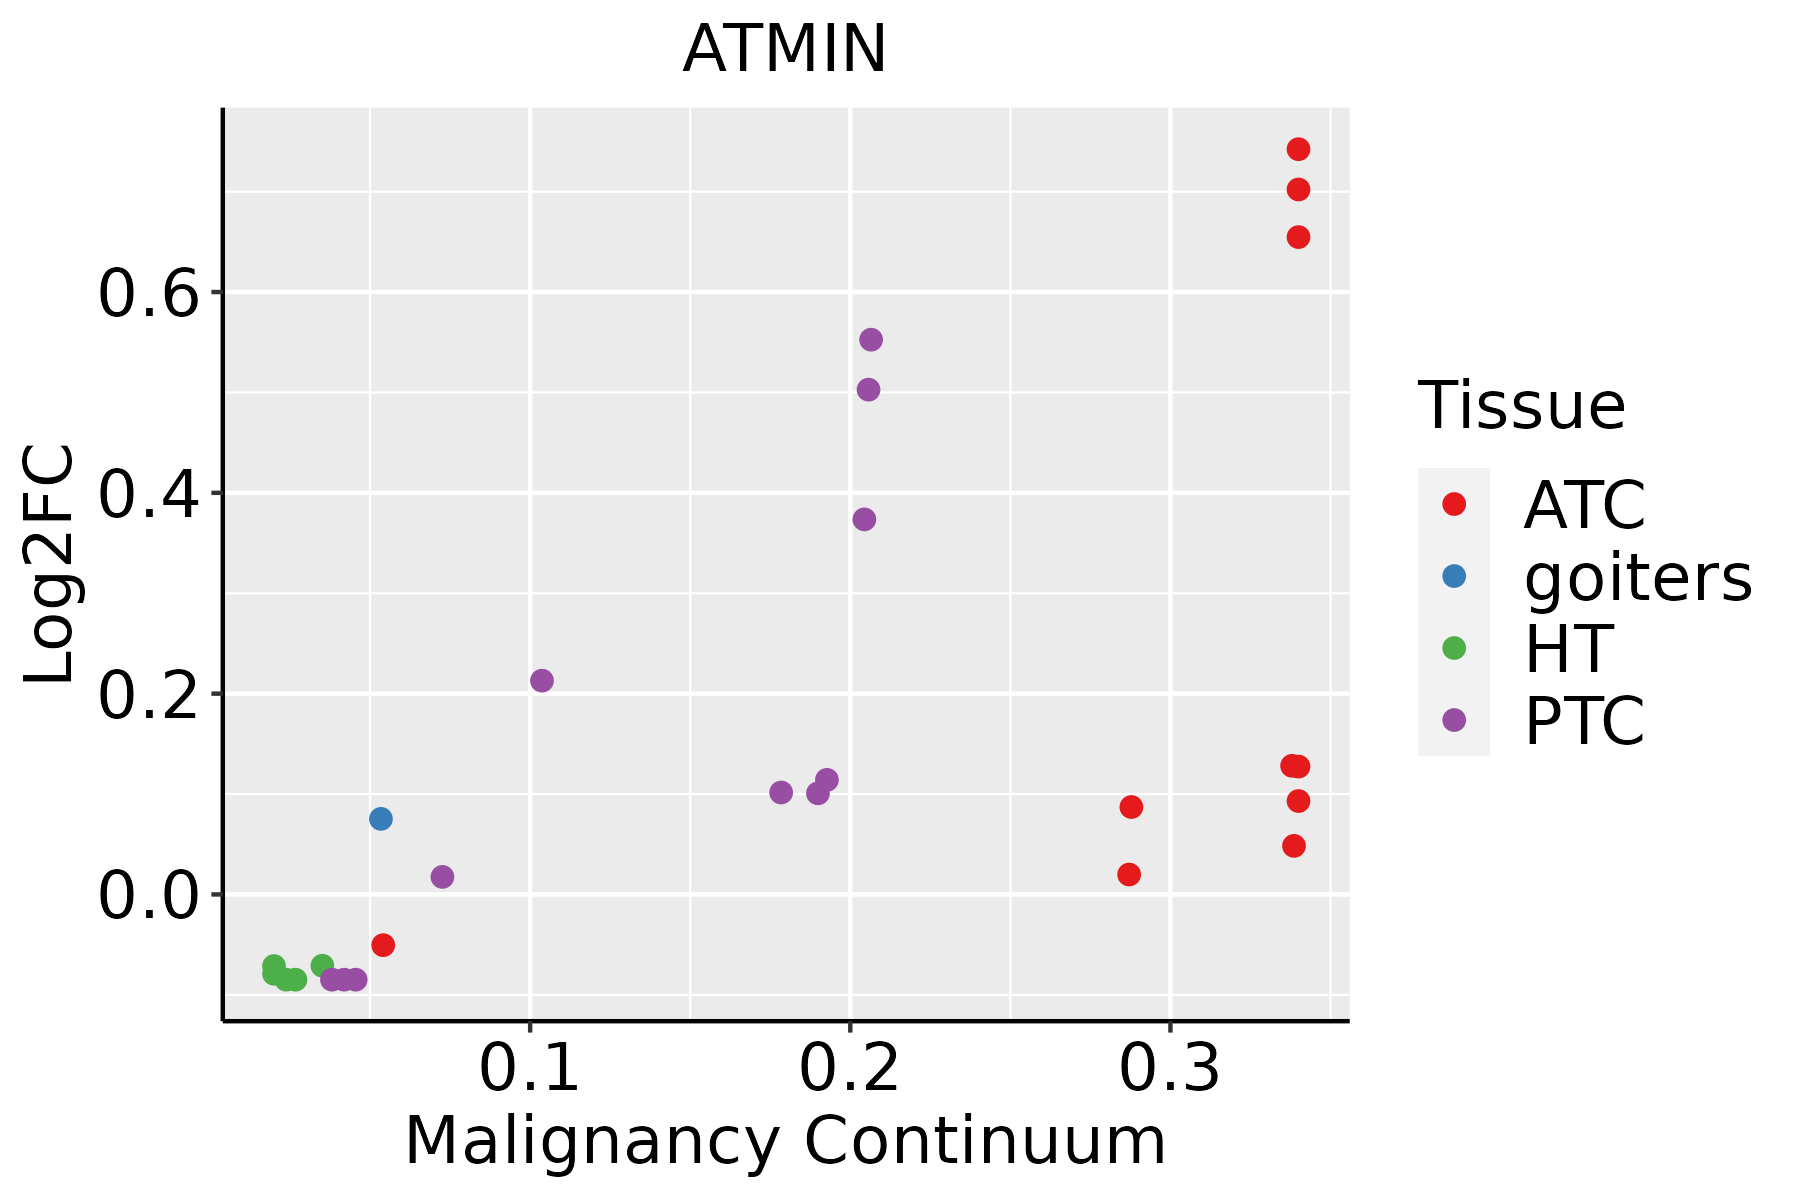 | ATC: Anaplastic thyroid cancer |
| HT: Hashimoto's thyroiditis | ||
| PTC: Papillary thyroid cancer |
| ∗log2FC in expression of this searched gene in stem-like cells from each diseased tissue sample relative to stem-like cells in normal samples in each tissue plotted against the malignancy continuum. Samples are colored based on if they are from different disease stage. |
Top |
Malignant transformation related pathway analysis |
| Find out the enriched GO biological processes and KEGG pathways involved in transition from healthy to precancer to cancer |
| Tissue | Disease Stage | Enriched GO biological Processes |
| Colorectum | AD |  |
| Colorectum | SER |  |
| Colorectum | MSS |  |
| Colorectum | MSI-H |  |
| Colorectum | FAP |  |
| ∗Top 15 enriched GO BP terms are showed in the bar plot of each disease state in each tissue. Each row represents a significant GO biological process which is colored according to the -log10(p.adjust). |
| Page: 1 2 3 4 5 6 7 8 9 |
| GO ID | Tissue | Disease Stage | Description | Gene Ratio | Bg Ratio | pvalue | p.adjust | Count |
| GO:0031346 | Colorectum | AD | positive regulation of cell projection organization | 104/3918 | 353/18723 | 8.26e-05 | 1.30e-03 | 104 |
| GO:0120034 | Colorectum | AD | positive regulation of plasma membrane bounded cell projection assembly | 33/3918 | 105/18723 | 7.49e-03 | 4.55e-02 | 33 |
| GO:0120032 | Colorectum | AD | regulation of plasma membrane bounded cell projection assembly | 53/3918 | 186/18723 | 8.51e-03 | 4.97e-02 | 53 |
| GO:00313462 | Colorectum | MSS | positive regulation of cell projection organization | 96/3467 | 353/18723 | 3.44e-05 | 6.70e-04 | 96 |
| GO:01200322 | Colorectum | MSS | regulation of plasma membrane bounded cell projection assembly | 51/3467 | 186/18723 | 1.78e-03 | 1.58e-02 | 51 |
| GO:00604911 | Colorectum | MSS | regulation of cell projection assembly | 51/3467 | 188/18723 | 2.28e-03 | 1.87e-02 | 51 |
| GO:01200341 | Colorectum | MSS | positive regulation of plasma membrane bounded cell projection assembly | 30/3467 | 105/18723 | 7.74e-03 | 4.84e-02 | 30 |
| GO:003134611 | Liver | HCC | positive regulation of cell projection organization | 193/7958 | 353/18723 | 2.28e-06 | 3.08e-05 | 193 |
| GO:19021151 | Liver | HCC | regulation of organelle assembly | 110/7958 | 186/18723 | 3.30e-06 | 4.34e-05 | 110 |
| GO:006049112 | Liver | HCC | regulation of cell projection assembly | 101/7958 | 188/18723 | 1.20e-03 | 6.69e-03 | 101 |
| GO:012003212 | Liver | HCC | regulation of plasma membrane bounded cell projection assembly | 100/7958 | 186/18723 | 1.23e-03 | 6.81e-03 | 100 |
| GO:1902117 | Liver | HCC | positive regulation of organelle assembly | 41/7958 | 67/18723 | 1.55e-03 | 8.20e-03 | 41 |
| GO:01200344 | Liver | HCC | positive regulation of plasma membrane bounded cell projection assembly | 58/7958 | 105/18723 | 5.66e-03 | 2.36e-02 | 58 |
| GO:19021155 | Oral cavity | OSCC | regulation of organelle assembly | 109/7305 | 186/18723 | 4.54e-08 | 8.45e-07 | 109 |
| GO:003134610 | Oral cavity | OSCC | positive regulation of cell projection organization | 176/7305 | 353/18723 | 1.94e-05 | 1.87e-04 | 176 |
| GO:006049110 | Oral cavity | OSCC | regulation of cell projection assembly | 100/7305 | 188/18723 | 5.27e-05 | 4.38e-04 | 100 |
| GO:012003216 | Oral cavity | OSCC | regulation of plasma membrane bounded cell projection assembly | 98/7305 | 186/18723 | 1.00e-04 | 7.54e-04 | 98 |
| GO:19021173 | Oral cavity | OSCC | positive regulation of organelle assembly | 41/7305 | 67/18723 | 1.94e-04 | 1.30e-03 | 41 |
| GO:01200346 | Oral cavity | OSCC | positive regulation of plasma membrane bounded cell projection assembly | 55/7305 | 105/18723 | 3.64e-03 | 1.51e-02 | 55 |
| GO:00313469 | Prostate | BPH | positive regulation of cell projection organization | 98/3107 | 353/18723 | 7.34e-08 | 1.88e-06 | 98 |
| Page: 1 2 3 |
| Pathway ID | Tissue | Disease Stage | Description | Gene Ratio | Bg Ratio | pvalue | p.adjust | qvalue | Count |
| Page: 1 |
Top |
Cell-cell communication analysis |
| Identification of potential cell-cell interactions between two cell types and their ligand-receptor pairs for different disease states |
| Ligand | Receptor | LRpair | Pathway | Tissue | Disease Stage |
| Page: 1 |
Top |
Single-cell gene regulatory network inference analysis |
| Find out the significant the regulons (TFs) and the target genes of each regulon across cell types for different disease states |
| TF | Cell Type | Tissue | Disease Stage | Target Gene | RSS | Regulon Activity |
| ∗The dot plots of a searched regulon are shown for all cell subpopulations in each disease state of each tissue based on the regulon specific score inferred using pySCENIC and by calculating the average expression. |
| Page: 1 |
Top |
Somatic mutation of malignant transformation related genes |
| Annotation of somatic variants for genes involved in malignant transformation |
| Hugo Symbol | Variant Class | Variant Classification | dbSNP RS | HGVSc | HGVSp | HGVSp Short | SWISSPROT | BIOTYPE | SIFT | PolyPhen | Tumor Sample Barcode | Tissue | Histology | Sex | Age | Stage | Therapy Types | Drugs | Outcome |
| ATMIN | SNV | Missense_Mutation | c.2386N>T | p.Asp796Tyr | p.D796Y | O43313 | protein_coding | deleterious(0) | probably_damaging(0.962) | TCGA-AO-A0J4-01 | Breast | breast invasive carcinoma | Female | <65 | I/II | Chemotherapy | doxorubicin | SD | |
| ATMIN | SNV | Missense_Mutation | novel | c.395G>T | p.Cys132Phe | p.C132F | O43313 | protein_coding | deleterious(0.02) | probably_damaging(1) | TCGA-B6-A0RE-01 | Breast | breast invasive carcinoma | Female | <65 | I/II | Unknown | Unknown | SD |
| ATMIN | SNV | Missense_Mutation | novel | c.1307N>T | p.Ser436Phe | p.S436F | O43313 | protein_coding | deleterious(0) | possibly_damaging(0.819) | TCGA-C8-A8HP-01 | Breast | breast invasive carcinoma | Female | <65 | III/IV | Chemotherapy | 5-fluorouracil | CR |
| ATMIN | SNV | Missense_Mutation | c.484G>C | p.Glu162Gln | p.E162Q | O43313 | protein_coding | deleterious(0) | probably_damaging(0.996) | TCGA-C5-A1BQ-01 | Cervix | cervical & endocervical cancer | Female | >=65 | III/IV | Chemotherapy | cisplatin | CR | |
| ATMIN | SNV | Missense_Mutation | novel | c.1678N>C | p.Glu560Gln | p.E560Q | O43313 | protein_coding | deleterious(0.04) | benign(0.255) | TCGA-C5-A1MN-01 | Cervix | cervical & endocervical cancer | Female | <65 | III/IV | Chemotherapy | cisplatin | SD |
| ATMIN | SNV | Missense_Mutation | novel | c.1342N>C | p.Asp448His | p.D448H | O43313 | protein_coding | deleterious(0.03) | benign(0.259) | TCGA-EA-A43B-01 | Cervix | cervical & endocervical cancer | Female | <65 | I/II | Chemotherapy | cisplatin | CR |
| ATMIN | SNV | Missense_Mutation | c.1856N>A | p.Gly619Glu | p.G619E | O43313 | protein_coding | deleterious(0.05) | benign(0.052) | TCGA-EA-A43B-01 | Cervix | cervical & endocervical cancer | Female | <65 | I/II | Chemotherapy | cisplatin | CR | |
| ATMIN | SNV | Missense_Mutation | c.2119G>A | p.Asp707Asn | p.D707N | O43313 | protein_coding | deleterious(0) | probably_damaging(0.999) | TCGA-AZ-4682-01 | Colorectum | colon adenocarcinoma | Male | <65 | I/II | Chemotherapy | camptosar | PD | |
| ATMIN | SNV | Missense_Mutation | c.662N>T | p.Arg221Met | p.R221M | O43313 | protein_coding | deleterious(0) | probably_damaging(0.998) | TCGA-F4-6570-01 | Colorectum | colon adenocarcinoma | Female | >=65 | I/II | Unknown | Unknown | SD | |
| ATMIN | SNV | Missense_Mutation | c.1680N>T | p.Glu560Asp | p.E560D | O43313 | protein_coding | tolerated(0.22) | benign(0.005) | TCGA-AG-A002-01 | Colorectum | rectum adenocarcinoma | Male | <65 | I/II | Unknown | Unknown | SD |
| Page: 1 2 3 4 5 6 7 |
Top |
Related drugs of malignant transformation related genes |
| Identification of chemicals and drugs interact with genes involved in malignant transfromation |
| (DGIdb 4.0) |
| Entrez ID | Symbol | Category | Interaction Types | Drug Claim Name | Drug Name | PMIDs |
| Page: 1 |

Copyright 2023-Present -The University of Texas Health Science Center at Houston |