
|
|||||
|
 | |
| |
| |
| |
| |
| |
|
Gene: ATM |
Gene summary for ATM |
| Gene information | Species | Human | Gene symbol | ATM | Gene ID | 472 |
| Gene name | ATM serine/threonine kinase | |
| Gene Alias | AT1 | |
| Cytomap | 11q22.3 | |
| Gene Type | protein-coding | GO ID | GO:0000003 | UniProtAcc | A0A024R3C7 |
Top |
Malignant transformation analysis |
| Identification of the aberrant gene expression in precancerous and cancerous lesions by comparing the gene expression of stem-like cells in diseased tissues with normal stem cells |
| Entrez ID | Symbol | Replicates | Species | Organ | Tissue | Adj P-value | Log2FC | Malignancy |
| 472 | ATM | LZE4T | Human | Esophagus | ESCC | 1.38e-07 | 2.10e-01 | 0.0811 |
| 472 | ATM | LZE7T | Human | Esophagus | ESCC | 2.19e-02 | 2.21e-01 | 0.0667 |
| 472 | ATM | LZE8T | Human | Esophagus | ESCC | 8.32e-03 | 7.62e-02 | 0.067 |
| 472 | ATM | LZE20T | Human | Esophagus | ESCC | 9.55e-07 | 1.07e-01 | 0.0662 |
| 472 | ATM | LZE24T | Human | Esophagus | ESCC | 1.17e-10 | 3.24e-01 | 0.0596 |
| 472 | ATM | P2T-E | Human | Esophagus | ESCC | 6.27e-08 | 1.19e-01 | 0.1177 |
| 472 | ATM | P4T-E | Human | Esophagus | ESCC | 3.04e-21 | 4.01e-01 | 0.1323 |
| 472 | ATM | P5T-E | Human | Esophagus | ESCC | 3.77e-17 | 1.17e-01 | 0.1327 |
| 472 | ATM | P8T-E | Human | Esophagus | ESCC | 5.06e-06 | 7.77e-02 | 0.0889 |
| 472 | ATM | P9T-E | Human | Esophagus | ESCC | 4.13e-10 | 2.04e-01 | 0.1131 |
| 472 | ATM | P10T-E | Human | Esophagus | ESCC | 7.83e-18 | 3.32e-01 | 0.116 |
| 472 | ATM | P11T-E | Human | Esophagus | ESCC | 3.57e-10 | 2.56e-01 | 0.1426 |
| 472 | ATM | P12T-E | Human | Esophagus | ESCC | 5.02e-22 | 3.49e-01 | 0.1122 |
| 472 | ATM | P15T-E | Human | Esophagus | ESCC | 1.06e-08 | 1.83e-01 | 0.1149 |
| 472 | ATM | P16T-E | Human | Esophagus | ESCC | 1.63e-17 | 2.52e-01 | 0.1153 |
| 472 | ATM | P20T-E | Human | Esophagus | ESCC | 3.15e-06 | 3.48e-02 | 0.1124 |
| 472 | ATM | P21T-E | Human | Esophagus | ESCC | 1.40e-14 | 2.08e-01 | 0.1617 |
| 472 | ATM | P22T-E | Human | Esophagus | ESCC | 2.28e-11 | 1.62e-01 | 0.1236 |
| 472 | ATM | P23T-E | Human | Esophagus | ESCC | 2.30e-08 | 1.63e-01 | 0.108 |
| 472 | ATM | P24T-E | Human | Esophagus | ESCC | 9.86e-03 | 7.31e-02 | 0.1287 |
| Page: 1 2 3 4 5 |
| Tissue | Expression Dynamics | Abbreviation |
| Esophagus | 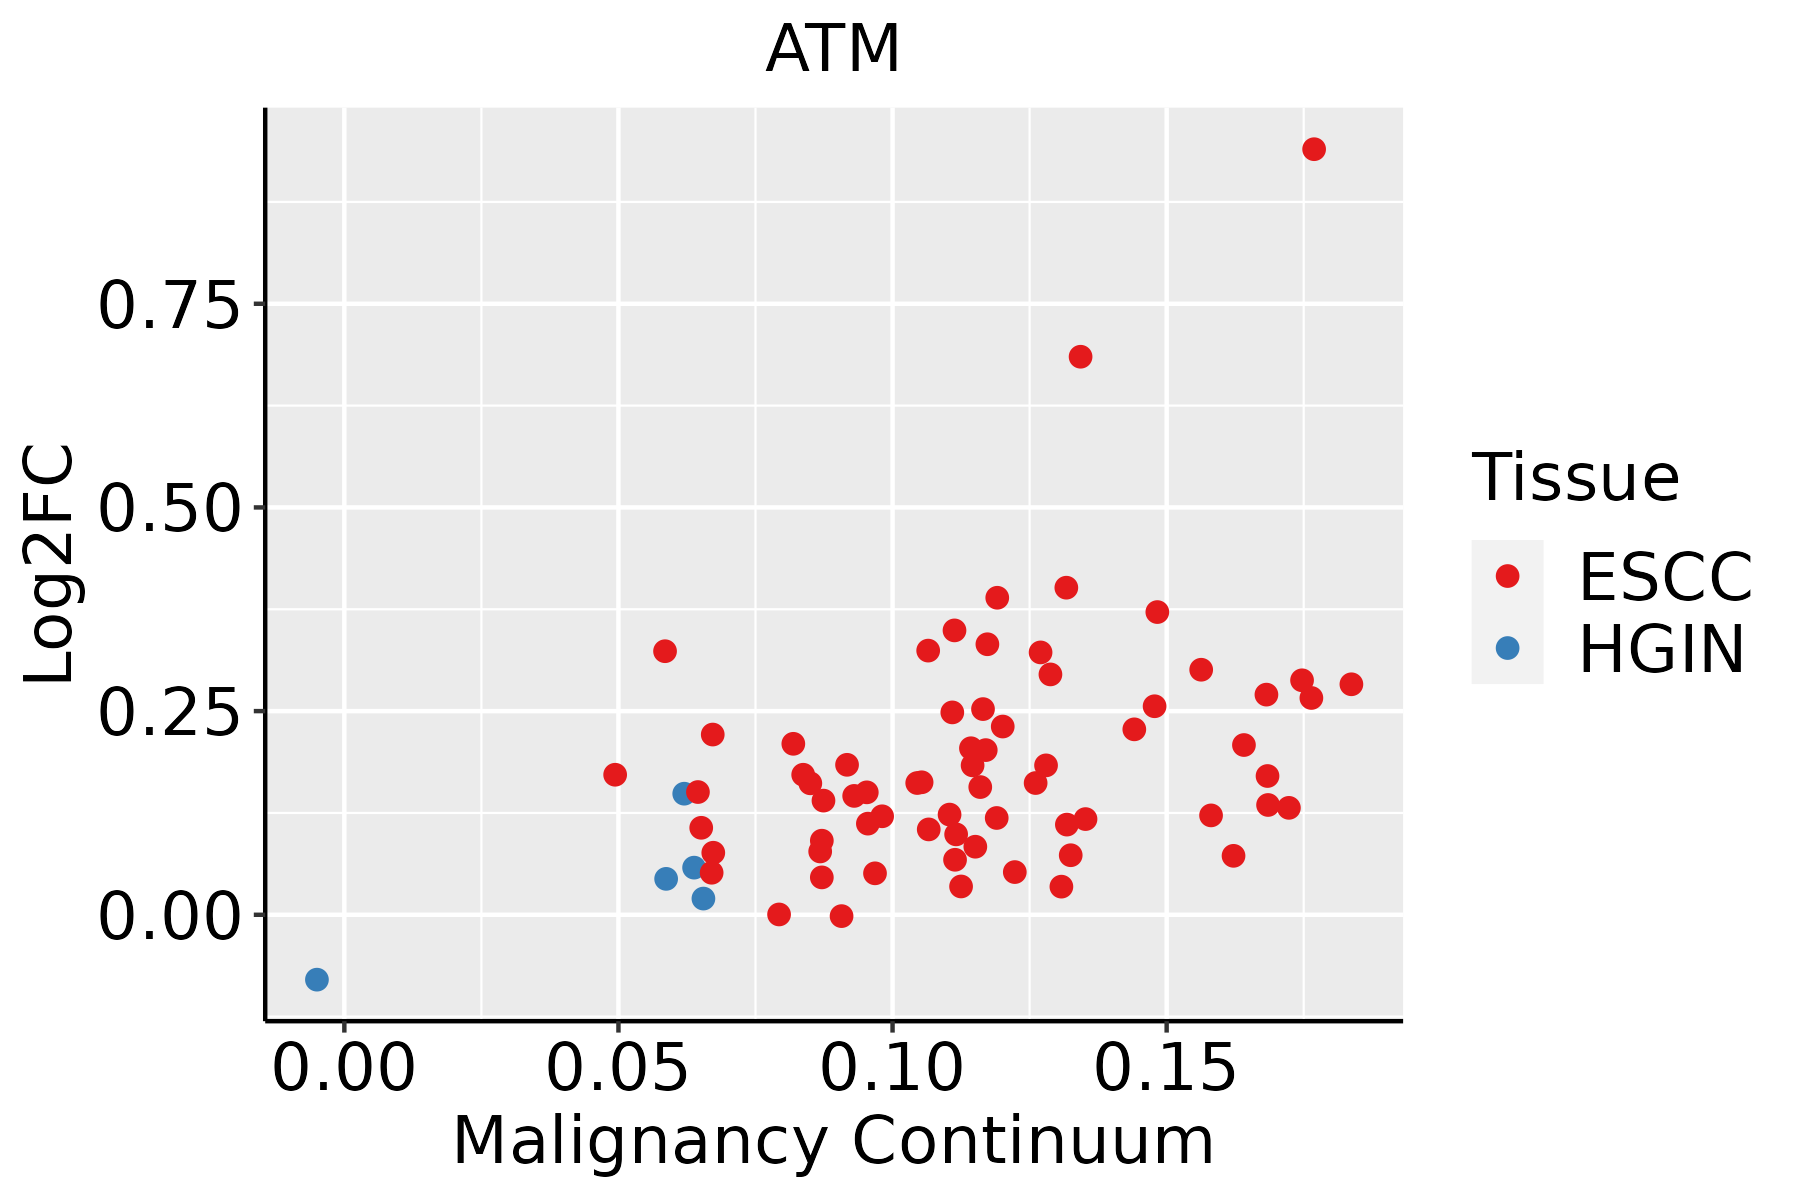 | ESCC: Esophageal squamous cell carcinoma |
| HGIN: High-grade intraepithelial neoplasias | ||
| LGIN: Low-grade intraepithelial neoplasias | ||
| Liver | 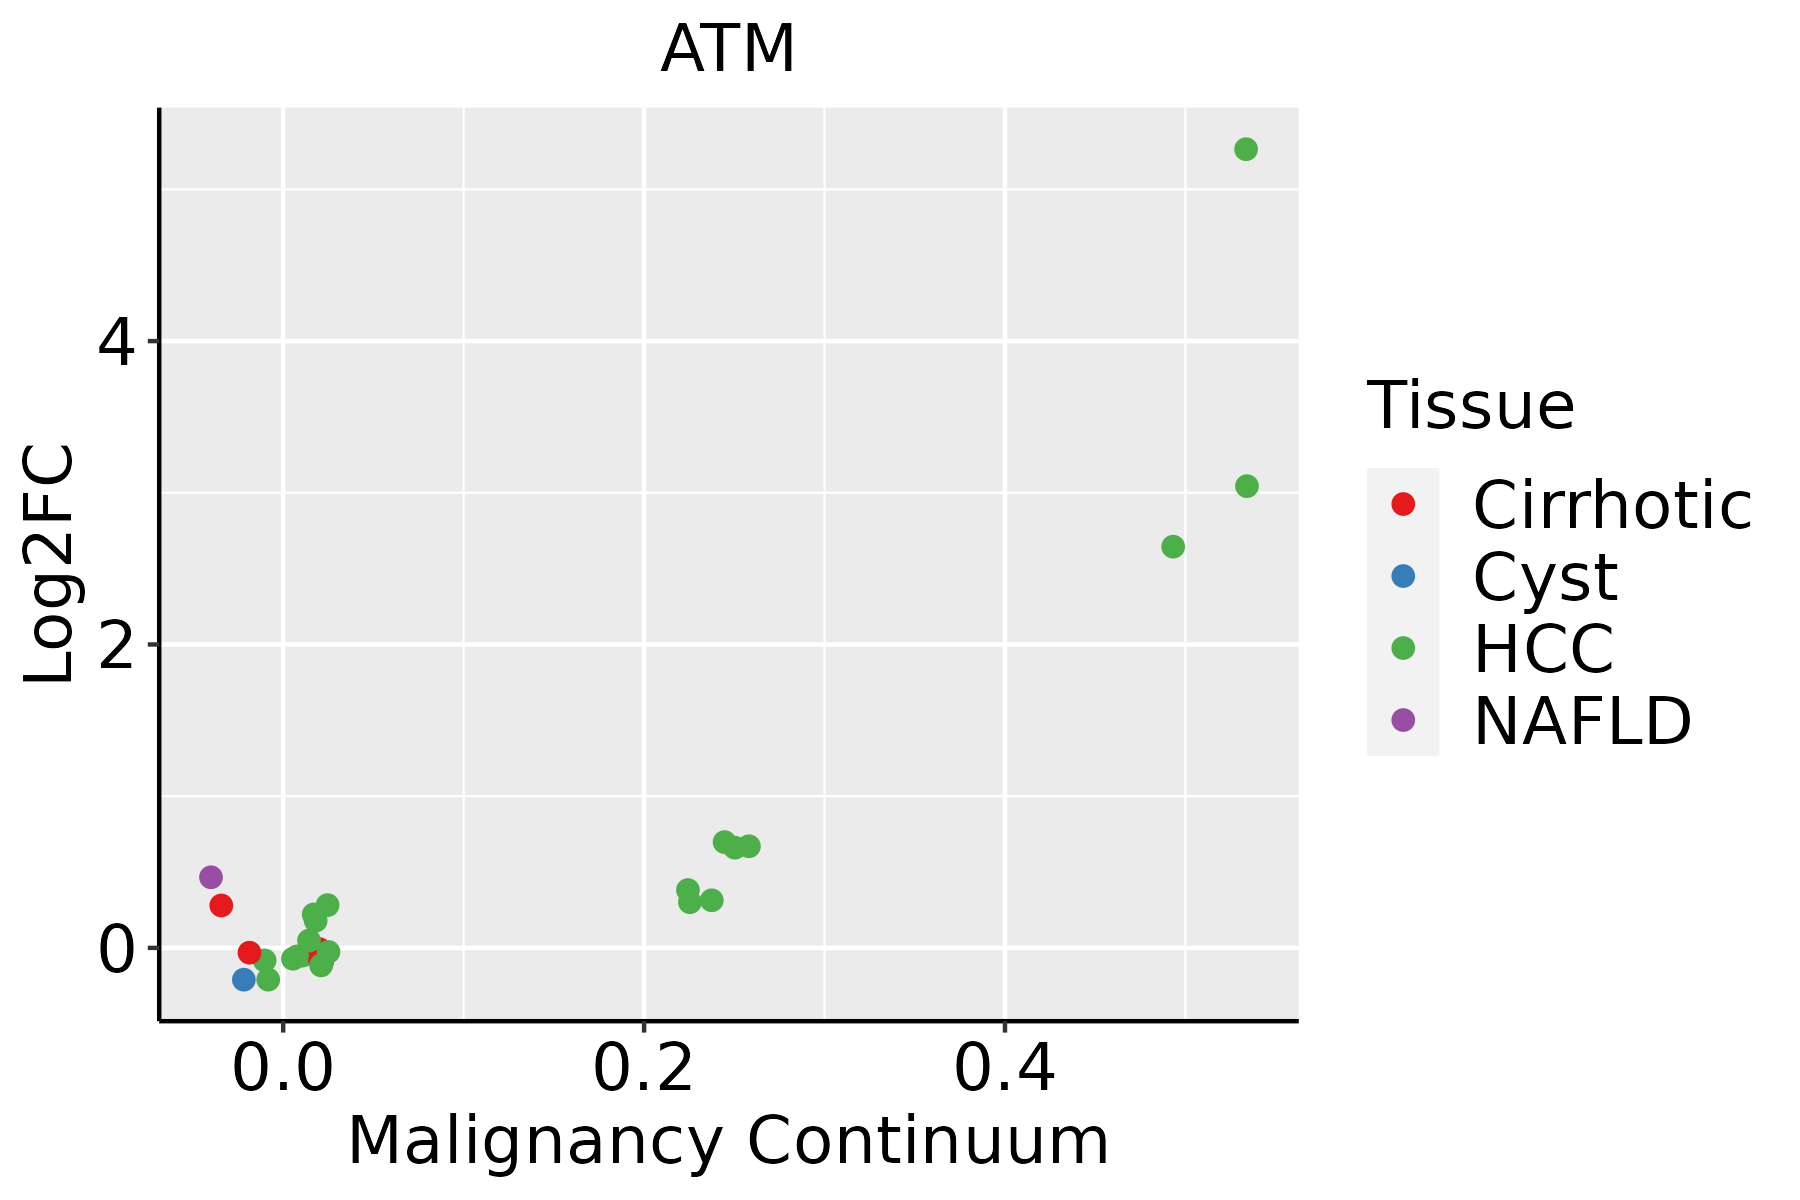 | HCC: Hepatocellular carcinoma |
| NAFLD: Non-alcoholic fatty liver disease | ||
| Prostate |  | BPH: Benign Prostatic Hyperplasia |
| Thyroid | 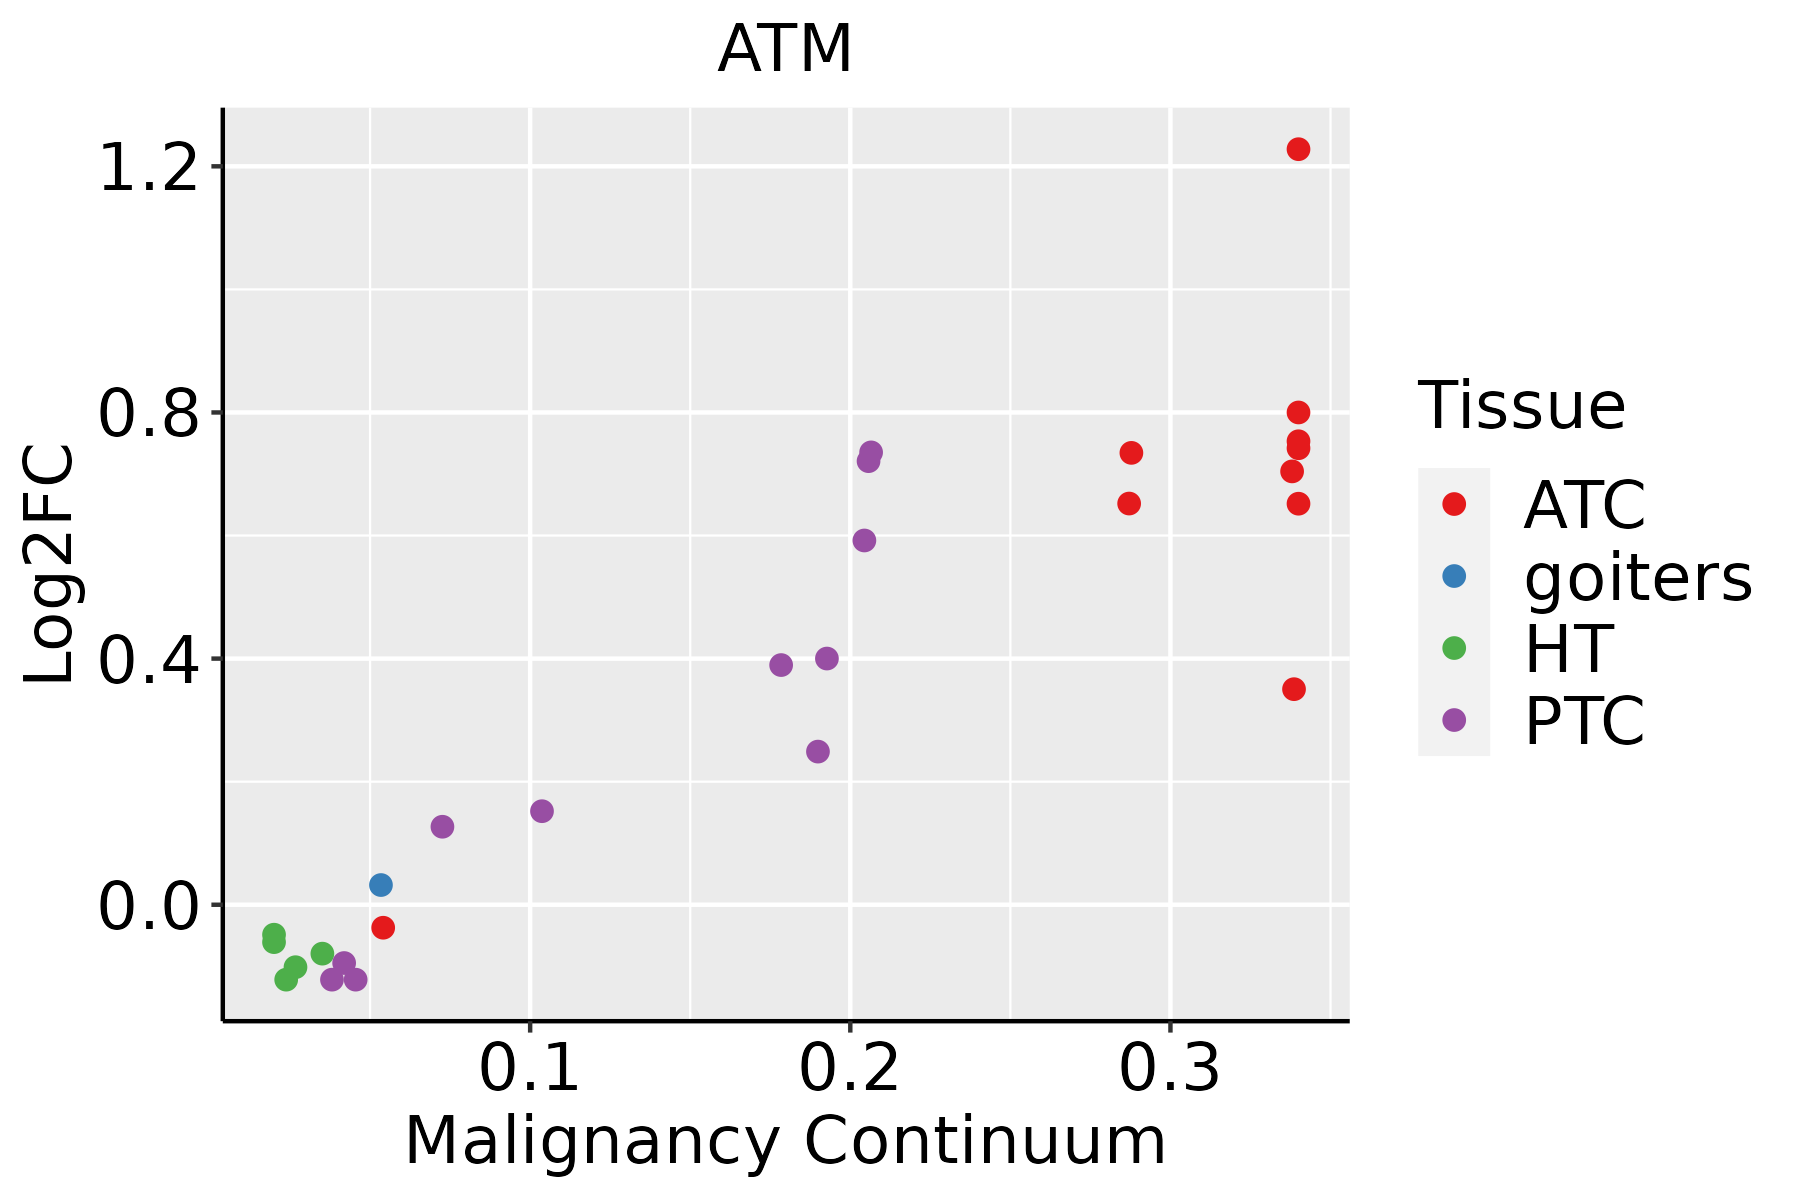 | ATC: Anaplastic thyroid cancer |
| HT: Hashimoto's thyroiditis | ||
| PTC: Papillary thyroid cancer |
| ∗log2FC in expression of this searched gene in stem-like cells from each diseased tissue sample relative to stem-like cells in normal samples in each tissue plotted against the malignancy continuum. Samples are colored based on if they are from different disease stage. |
Top |
Malignant transformation related pathway analysis |
| Find out the enriched GO biological processes and KEGG pathways involved in transition from healthy to precancer to cancer |
| Tissue | Disease Stage | Enriched GO biological Processes |
| Colorectum | AD |  |
| Colorectum | SER |  |
| Colorectum | MSS |  |
| Colorectum | MSI-H |  |
| Colorectum | FAP |  |
| ∗Top 15 enriched GO BP terms are showed in the bar plot of each disease state in each tissue. Each row represents a significant GO biological process which is colored according to the -log10(p.adjust). |
| Page: 1 2 3 4 5 6 7 8 9 |
| GO ID | Tissue | Disease Stage | Description | Gene Ratio | Bg Ratio | pvalue | p.adjust | Count |
| GO:0031346 | Colorectum | AD | positive regulation of cell projection organization | 104/3918 | 353/18723 | 8.26e-05 | 1.30e-03 | 104 |
| GO:0120034 | Colorectum | AD | positive regulation of plasma membrane bounded cell projection assembly | 33/3918 | 105/18723 | 7.49e-03 | 4.55e-02 | 33 |
| GO:0120032 | Colorectum | AD | regulation of plasma membrane bounded cell projection assembly | 53/3918 | 186/18723 | 8.51e-03 | 4.97e-02 | 53 |
| GO:00313462 | Colorectum | MSS | positive regulation of cell projection organization | 96/3467 | 353/18723 | 3.44e-05 | 6.70e-04 | 96 |
| GO:00423981 | Colorectum | MSS | cellular modified amino acid biosynthetic process | 20/3467 | 46/18723 | 8.26e-05 | 1.35e-03 | 20 |
| GO:00065751 | Colorectum | MSS | cellular modified amino acid metabolic process | 55/3467 | 188/18723 | 2.16e-04 | 3.01e-03 | 55 |
| GO:01200322 | Colorectum | MSS | regulation of plasma membrane bounded cell projection assembly | 51/3467 | 186/18723 | 1.78e-03 | 1.58e-02 | 51 |
| GO:00604911 | Colorectum | MSS | regulation of cell projection assembly | 51/3467 | 188/18723 | 2.28e-03 | 1.87e-02 | 51 |
| GO:00030121 | Colorectum | MSS | muscle system process | 105/3467 | 452/18723 | 6.39e-03 | 4.26e-02 | 105 |
| GO:0046394 | Colorectum | MSS | carboxylic acid biosynthetic process | 76/3467 | 314/18723 | 6.71e-03 | 4.38e-02 | 76 |
| GO:01200341 | Colorectum | MSS | positive regulation of plasma membrane bounded cell projection assembly | 30/3467 | 105/18723 | 7.74e-03 | 4.84e-02 | 30 |
| GO:0016053 | Colorectum | MSS | organic acid biosynthetic process | 76/3467 | 316/18723 | 7.88e-03 | 4.84e-02 | 76 |
| GO:00423982 | Colorectum | MSI-H | cellular modified amino acid biosynthetic process | 10/1319 | 46/18723 | 1.14e-03 | 1.90e-02 | 10 |
| GO:00065752 | Colorectum | MSI-H | cellular modified amino acid metabolic process | 25/1319 | 188/18723 | 1.61e-03 | 2.39e-02 | 25 |
| GO:00463941 | Colorectum | MSI-H | carboxylic acid biosynthetic process | 36/1319 | 314/18723 | 2.68e-03 | 3.48e-02 | 36 |
| GO:00160531 | Colorectum | MSI-H | organic acid biosynthetic process | 36/1319 | 316/18723 | 2.98e-03 | 3.78e-02 | 36 |
| GO:0022613111 | Esophagus | ESCC | ribonucleoprotein complex biogenesis | 365/8552 | 463/18723 | 1.74e-49 | 1.11e-45 | 365 |
| GO:0097193111 | Esophagus | ESCC | intrinsic apoptotic signaling pathway | 222/8552 | 288/18723 | 5.87e-28 | 2.02e-25 | 222 |
| GO:0006403110 | Esophagus | ESCC | RNA localization | 166/8552 | 201/18723 | 1.95e-27 | 6.18e-25 | 166 |
| GO:001657015 | Esophagus | ESCC | histone modification | 323/8552 | 463/18723 | 2.61e-26 | 7.88e-24 | 323 |
| Page: 1 2 3 4 5 6 7 8 9 10 11 12 13 14 15 16 17 18 19 20 21 22 23 24 25 26 27 28 29 30 31 32 33 34 35 36 37 38 39 40 41 42 43 44 45 46 47 48 49 |
| Pathway ID | Tissue | Disease Stage | Description | Gene Ratio | Bg Ratio | pvalue | p.adjust | qvalue | Count |
| hsa0411023 | Esophagus | ESCC | Cell cycle | 126/4205 | 157/8465 | 1.34e-15 | 5.60e-14 | 2.87e-14 | 126 |
| hsa05166211 | Esophagus | ESCC | Human T-cell leukemia virus 1 infection | 164/4205 | 222/8465 | 8.13e-14 | 2.09e-12 | 1.07e-12 | 164 |
| hsa05131211 | Esophagus | ESCC | Shigellosis | 176/4205 | 247/8465 | 2.27e-12 | 4.01e-11 | 2.05e-11 | 176 |
| hsa0411524 | Esophagus | ESCC | p53 signaling pathway | 65/4205 | 74/8465 | 3.88e-12 | 6.50e-11 | 3.33e-11 | 65 |
| hsa0421829 | Esophagus | ESCC | Cellular senescence | 119/4205 | 156/8465 | 5.89e-12 | 9.40e-11 | 4.81e-11 | 119 |
| hsa0421027 | Esophagus | ESCC | Apoptosis | 102/4205 | 136/8465 | 1.05e-09 | 1.21e-08 | 6.21e-09 | 102 |
| hsa05170210 | Esophagus | ESCC | Human immunodeficiency virus 1 infection | 147/4205 | 212/8465 | 3.37e-09 | 3.53e-08 | 1.81e-08 | 147 |
| hsa0516510 | Esophagus | ESCC | Human papillomavirus infection | 215/4205 | 331/8465 | 7.86e-09 | 7.12e-08 | 3.65e-08 | 215 |
| hsa015247 | Esophagus | ESCC | Platinum drug resistance | 56/4205 | 73/8465 | 1.85e-06 | 1.13e-05 | 5.78e-06 | 56 |
| hsa040689 | Esophagus | ESCC | FoxO signaling pathway | 89/4205 | 131/8465 | 1.56e-05 | 7.98e-05 | 4.09e-05 | 89 |
| hsa040645 | Esophagus | ESCC | NF-kappa B signaling pathway | 67/4205 | 104/8465 | 1.62e-03 | 4.89e-03 | 2.50e-03 | 67 |
| hsa052028 | Esophagus | ESCC | Transcriptional misregulation in cancer | 116/4205 | 193/8465 | 2.08e-03 | 5.95e-03 | 3.05e-03 | 116 |
| hsa0411033 | Esophagus | ESCC | Cell cycle | 126/4205 | 157/8465 | 1.34e-15 | 5.60e-14 | 2.87e-14 | 126 |
| hsa05166310 | Esophagus | ESCC | Human T-cell leukemia virus 1 infection | 164/4205 | 222/8465 | 8.13e-14 | 2.09e-12 | 1.07e-12 | 164 |
| hsa05131310 | Esophagus | ESCC | Shigellosis | 176/4205 | 247/8465 | 2.27e-12 | 4.01e-11 | 2.05e-11 | 176 |
| hsa0411534 | Esophagus | ESCC | p53 signaling pathway | 65/4205 | 74/8465 | 3.88e-12 | 6.50e-11 | 3.33e-11 | 65 |
| hsa0421838 | Esophagus | ESCC | Cellular senescence | 119/4205 | 156/8465 | 5.89e-12 | 9.40e-11 | 4.81e-11 | 119 |
| hsa0421037 | Esophagus | ESCC | Apoptosis | 102/4205 | 136/8465 | 1.05e-09 | 1.21e-08 | 6.21e-09 | 102 |
| hsa0517038 | Esophagus | ESCC | Human immunodeficiency virus 1 infection | 147/4205 | 212/8465 | 3.37e-09 | 3.53e-08 | 1.81e-08 | 147 |
| hsa0516515 | Esophagus | ESCC | Human papillomavirus infection | 215/4205 | 331/8465 | 7.86e-09 | 7.12e-08 | 3.65e-08 | 215 |
| Page: 1 2 3 4 5 6 |
Top |
Cell-cell communication analysis |
| Identification of potential cell-cell interactions between two cell types and their ligand-receptor pairs for different disease states |
| Ligand | Receptor | LRpair | Pathway | Tissue | Disease Stage |
| Page: 1 |
Top |
Single-cell gene regulatory network inference analysis |
| Find out the significant the regulons (TFs) and the target genes of each regulon across cell types for different disease states |
| TF | Cell Type | Tissue | Disease Stage | Target Gene | RSS | Regulon Activity |
| ∗The dot plots of a searched regulon are shown for all cell subpopulations in each disease state of each tissue based on the regulon specific score inferred using pySCENIC and by calculating the average expression. |
| Page: 1 |
Top |
Somatic mutation of malignant transformation related genes |
| Annotation of somatic variants for genes involved in malignant transformation |
| Hugo Symbol | Variant Class | Variant Classification | dbSNP RS | HGVSc | HGVSp | HGVSp Short | SWISSPROT | BIOTYPE | SIFT | PolyPhen | Tumor Sample Barcode | Tissue | Histology | Sex | Age | Stage | Therapy Types | Drugs | Outcome |
| ATM | SNV | Missense_Mutation | c.4759N>A | p.Pro1587Thr | p.P1587T | Q13315 | protein_coding | tolerated(0.39) | benign(0.009) | TCGA-A2-A0EY-01 | Breast | breast invasive carcinoma | Female | <65 | I/II | Chemotherapy | adriamycin | SD | |
| ATM | SNV | Missense_Mutation | rs876659942 | c.8158N>A | p.Asp2720Asn | p.D2720N | Q13315 | protein_coding | deleterious(0.03) | possibly_damaging(0.696) | TCGA-A2-A0YK-01 | Breast | breast invasive carcinoma | Female | <65 | I/II | Chemotherapy | cytoxan | SD |
| ATM | SNV | Missense_Mutation | c.1134N>G | p.Ser378Arg | p.S378R | Q13315 | protein_coding | tolerated(0.61) | benign(0.005) | TCGA-A8-A06X-01 | Breast | breast invasive carcinoma | Female | >=65 | I/II | Unknown | Unknown | SD | |
| ATM | SNV | Missense_Mutation | c.2212G>A | p.Glu738Lys | p.E738K | Q13315 | protein_coding | tolerated(0.06) | benign(0.111) | TCGA-A8-A076-01 | Breast | breast invasive carcinoma | Female | >=65 | I/II | Hormone Therapy | anastrozole | SD | |
| ATM | SNV | Missense_Mutation | novel | c.8440G>A | p.Glu2814Lys | p.E2814K | Q13315 | protein_coding | deleterious(0.02) | benign(0.018) | TCGA-AC-A3W6-01 | Breast | breast invasive carcinoma | Female | >=65 | III/IV | Unknown | Unknown | SD |
| ATM | SNV | Missense_Mutation | c.7310N>G | p.Tyr2437Cys | p.Y2437C | Q13315 | protein_coding | deleterious(0) | probably_damaging(0.917) | TCGA-AN-A046-01 | Breast | breast invasive carcinoma | Female | >=65 | I/II | Unknown | Unknown | SD | |
| ATM | SNV | Missense_Mutation | novel | c.4211N>G | p.Ile1404Ser | p.I1404S | Q13315 | protein_coding | deleterious(0.03) | benign(0.433) | TCGA-AR-A0U0-01 | Breast | breast invasive carcinoma | Female | >=65 | I/II | Unknown | Unknown | SD |
| ATM | SNV | Missense_Mutation | rs781449586 | c.6881A>G | p.Glu2294Gly | p.E2294G | Q13315 | protein_coding | deleterious(0) | probably_damaging(0.996) | TCGA-B6-A0IA-01 | Breast | breast invasive carcinoma | Female | <65 | I/II | Unknown | Unknown | SD |
| ATM | SNV | Missense_Mutation | rs587782310 | c.7328N>A | p.Arg2443Gln | p.R2443Q | Q13315 | protein_coding | deleterious(0.03) | benign(0.131) | TCGA-B6-A0RL-01 | Breast | breast invasive carcinoma | Female | <65 | I/II | Unknown | Unknown | SD |
| ATM | SNV | Missense_Mutation | c.5993N>A | p.Gly1998Glu | p.G1998E | Q13315 | protein_coding | tolerated(0.05) | benign(0.152) | TCGA-BH-A0B6-01 | Breast | breast invasive carcinoma | Female | <65 | I/II | Unknown | Unknown | SD |
| Page: 1 2 3 4 5 6 7 8 9 10 11 12 13 14 15 16 17 18 19 20 21 22 23 24 25 26 27 28 29 30 31 32 33 34 35 |
Top |
Related drugs of malignant transformation related genes |
| Identification of chemicals and drugs interact with genes involved in malignant transfromation |
| (DGIdb 4.0) |
| Entrez ID | Symbol | Category | Interaction Types | Drug Claim Name | Drug Name | PMIDs |
| 472 | ATM | CLINICALLY ACTIONABLE, SERINE THREONINE KINASE, KINASE, ENZYME, DRUGGABLE GENOME, PHOSPHATIDYLINOSITOL 3 KINASE, TUMOR SUPPRESSOR, DRUG RESISTANCE | metformin | METFORMIN | 28834135 | |
| 472 | ATM | CLINICALLY ACTIONABLE, SERINE THREONINE KINASE, KINASE, ENZYME, DRUGGABLE GENOME, PHOSPHATIDYLINOSITOL 3 KINASE, TUMOR SUPPRESSOR, DRUG RESISTANCE | OLAPARIB | OLAPARIB | 20739657,26510020,32343890,28363999,20124459,24841718 | |
| 472 | ATM | CLINICALLY ACTIONABLE, SERINE THREONINE KINASE, KINASE, ENZYME, DRUGGABLE GENOME, PHOSPHATIDYLINOSITOL 3 KINASE, TUMOR SUPPRESSOR, DRUG RESISTANCE | PHLORETIN | PHLORETIN | ||
| 472 | ATM | CLINICALLY ACTIONABLE, SERINE THREONINE KINASE, KINASE, ENZYME, DRUGGABLE GENOME, PHOSPHATIDYLINOSITOL 3 KINASE, TUMOR SUPPRESSOR, DRUG RESISTANCE | Fludarabine | FLUDARABINE | 20739657 | |
| 472 | ATM | CLINICALLY ACTIONABLE, SERINE THREONINE KINASE, KINASE, ENZYME, DRUGGABLE GENOME, PHOSPHATIDYLINOSITOL 3 KINASE, TUMOR SUPPRESSOR, DRUG RESISTANCE | DOXORUBICIN | DOXORUBICIN | 23585524 | |
| 472 | ATM | CLINICALLY ACTIONABLE, SERINE THREONINE KINASE, KINASE, ENZYME, DRUGGABLE GENOME, PHOSPHATIDYLINOSITOL 3 KINASE, TUMOR SUPPRESSOR, DRUG RESISTANCE | Bendamustine | BENDAMUSTINE | 20739657 | |
| 472 | ATM | CLINICALLY ACTIONABLE, SERINE THREONINE KINASE, KINASE, ENZYME, DRUGGABLE GENOME, PHOSPHATIDYLINOSITOL 3 KINASE, TUMOR SUPPRESSOR, DRUG RESISTANCE | NAFTIFINE HYDROCHLORIDE | NAFTIFINE HYDROCHLORIDE | ||
| 472 | ATM | CLINICALLY ACTIONABLE, SERINE THREONINE KINASE, KINASE, ENZYME, DRUGGABLE GENOME, PHOSPHATIDYLINOSITOL 3 KINASE, TUMOR SUPPRESSOR, DRUG RESISTANCE | TCMDC-125528 | CHEMBL375673 | ||
| 472 | ATM | CLINICALLY ACTIONABLE, SERINE THREONINE KINASE, KINASE, ENZYME, DRUGGABLE GENOME, PHOSPHATIDYLINOSITOL 3 KINASE, TUMOR SUPPRESSOR, DRUG RESISTANCE | AZD1390 | |||
| 472 | ATM | CLINICALLY ACTIONABLE, SERINE THREONINE KINASE, KINASE, ENZYME, DRUGGABLE GENOME, PHOSPHATIDYLINOSITOL 3 KINASE, TUMOR SUPPRESSOR, DRUG RESISTANCE | doxorubicin | DOXORUBICIN |
| Page: 1 2 3 4 5 6 7 8 |

Copyright 2023-Present -The University of Texas Health Science Center at Houston |