
|
|||||
|
 | |
| |
| |
| |
| |
| |
|
Gene: ATL3 |
Gene summary for ATL3 |
| Gene information | Species | Human | Gene symbol | ATL3 | Gene ID | 25923 |
| Gene name | atlastin GTPase 3 | |
| Gene Alias | HSN1F | |
| Cytomap | 11q13.1 | |
| Gene Type | protein-coding | GO ID | GO:0006996 | UniProtAcc | B4DXC4 |
Top |
Malignant transformation analysis |
| Identification of the aberrant gene expression in precancerous and cancerous lesions by comparing the gene expression of stem-like cells in diseased tissues with normal stem cells |
| Entrez ID | Symbol | Replicates | Species | Organ | Tissue | Adj P-value | Log2FC | Malignancy |
| 25923 | ATL3 | LZE4T | Human | Esophagus | ESCC | 1.88e-21 | 5.86e-01 | 0.0811 |
| 25923 | ATL3 | LZE7T | Human | Esophagus | ESCC | 8.68e-07 | 3.83e-01 | 0.0667 |
| 25923 | ATL3 | LZE8T | Human | Esophagus | ESCC | 1.37e-02 | 1.17e-01 | 0.067 |
| 25923 | ATL3 | LZE24T | Human | Esophagus | ESCC | 8.04e-22 | 6.09e-01 | 0.0596 |
| 25923 | ATL3 | LZE6T | Human | Esophagus | ESCC | 3.42e-02 | 2.17e-01 | 0.0845 |
| 25923 | ATL3 | P2T-E | Human | Esophagus | ESCC | 3.75e-24 | 3.82e-01 | 0.1177 |
| 25923 | ATL3 | P4T-E | Human | Esophagus | ESCC | 6.41e-23 | 5.63e-01 | 0.1323 |
| 25923 | ATL3 | P5T-E | Human | Esophagus | ESCC | 6.46e-27 | 5.87e-01 | 0.1327 |
| 25923 | ATL3 | P8T-E | Human | Esophagus | ESCC | 1.33e-15 | 8.20e-02 | 0.0889 |
| 25923 | ATL3 | P9T-E | Human | Esophagus | ESCC | 1.01e-09 | 2.07e-01 | 0.1131 |
| 25923 | ATL3 | P10T-E | Human | Esophagus | ESCC | 1.55e-10 | 2.29e-01 | 0.116 |
| 25923 | ATL3 | P11T-E | Human | Esophagus | ESCC | 1.56e-20 | 9.62e-01 | 0.1426 |
| 25923 | ATL3 | P12T-E | Human | Esophagus | ESCC | 1.25e-24 | 3.99e-01 | 0.1122 |
| 25923 | ATL3 | P15T-E | Human | Esophagus | ESCC | 2.81e-14 | 1.62e-01 | 0.1149 |
| 25923 | ATL3 | P16T-E | Human | Esophagus | ESCC | 7.84e-18 | 2.38e-01 | 0.1153 |
| 25923 | ATL3 | P17T-E | Human | Esophagus | ESCC | 6.57e-12 | 5.54e-01 | 0.1278 |
| 25923 | ATL3 | P19T-E | Human | Esophagus | ESCC | 5.57e-09 | 1.05e+00 | 0.1662 |
| 25923 | ATL3 | P20T-E | Human | Esophagus | ESCC | 2.05e-10 | 2.47e-01 | 0.1124 |
| 25923 | ATL3 | P21T-E | Human | Esophagus | ESCC | 4.87e-53 | 1.20e+00 | 0.1617 |
| 25923 | ATL3 | P22T-E | Human | Esophagus | ESCC | 9.13e-18 | 2.45e-01 | 0.1236 |
| Page: 1 2 3 4 5 6 |
| Tissue | Expression Dynamics | Abbreviation |
| Esophagus |  | ESCC: Esophageal squamous cell carcinoma |
| HGIN: High-grade intraepithelial neoplasias | ||
| LGIN: Low-grade intraepithelial neoplasias | ||
| Liver | 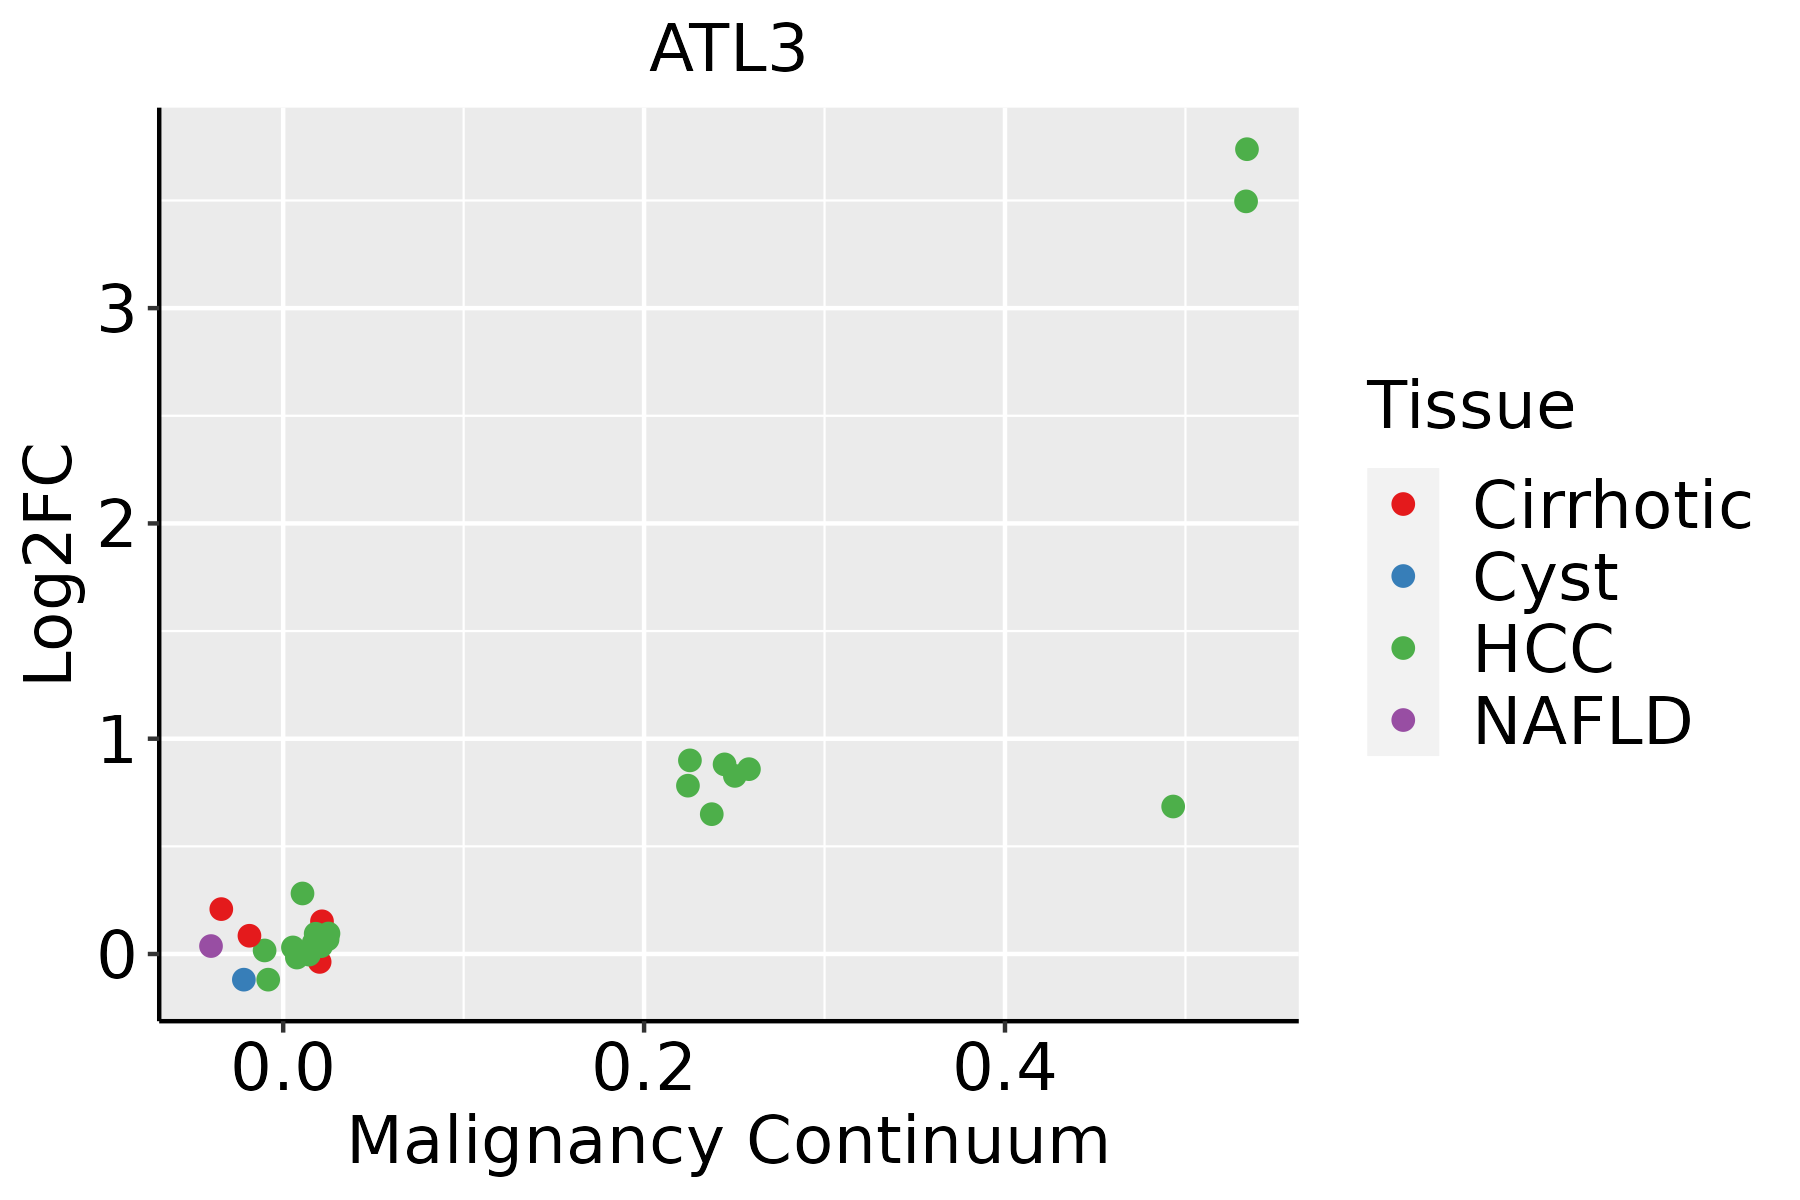 | HCC: Hepatocellular carcinoma |
| NAFLD: Non-alcoholic fatty liver disease | ||
| Oral Cavity | 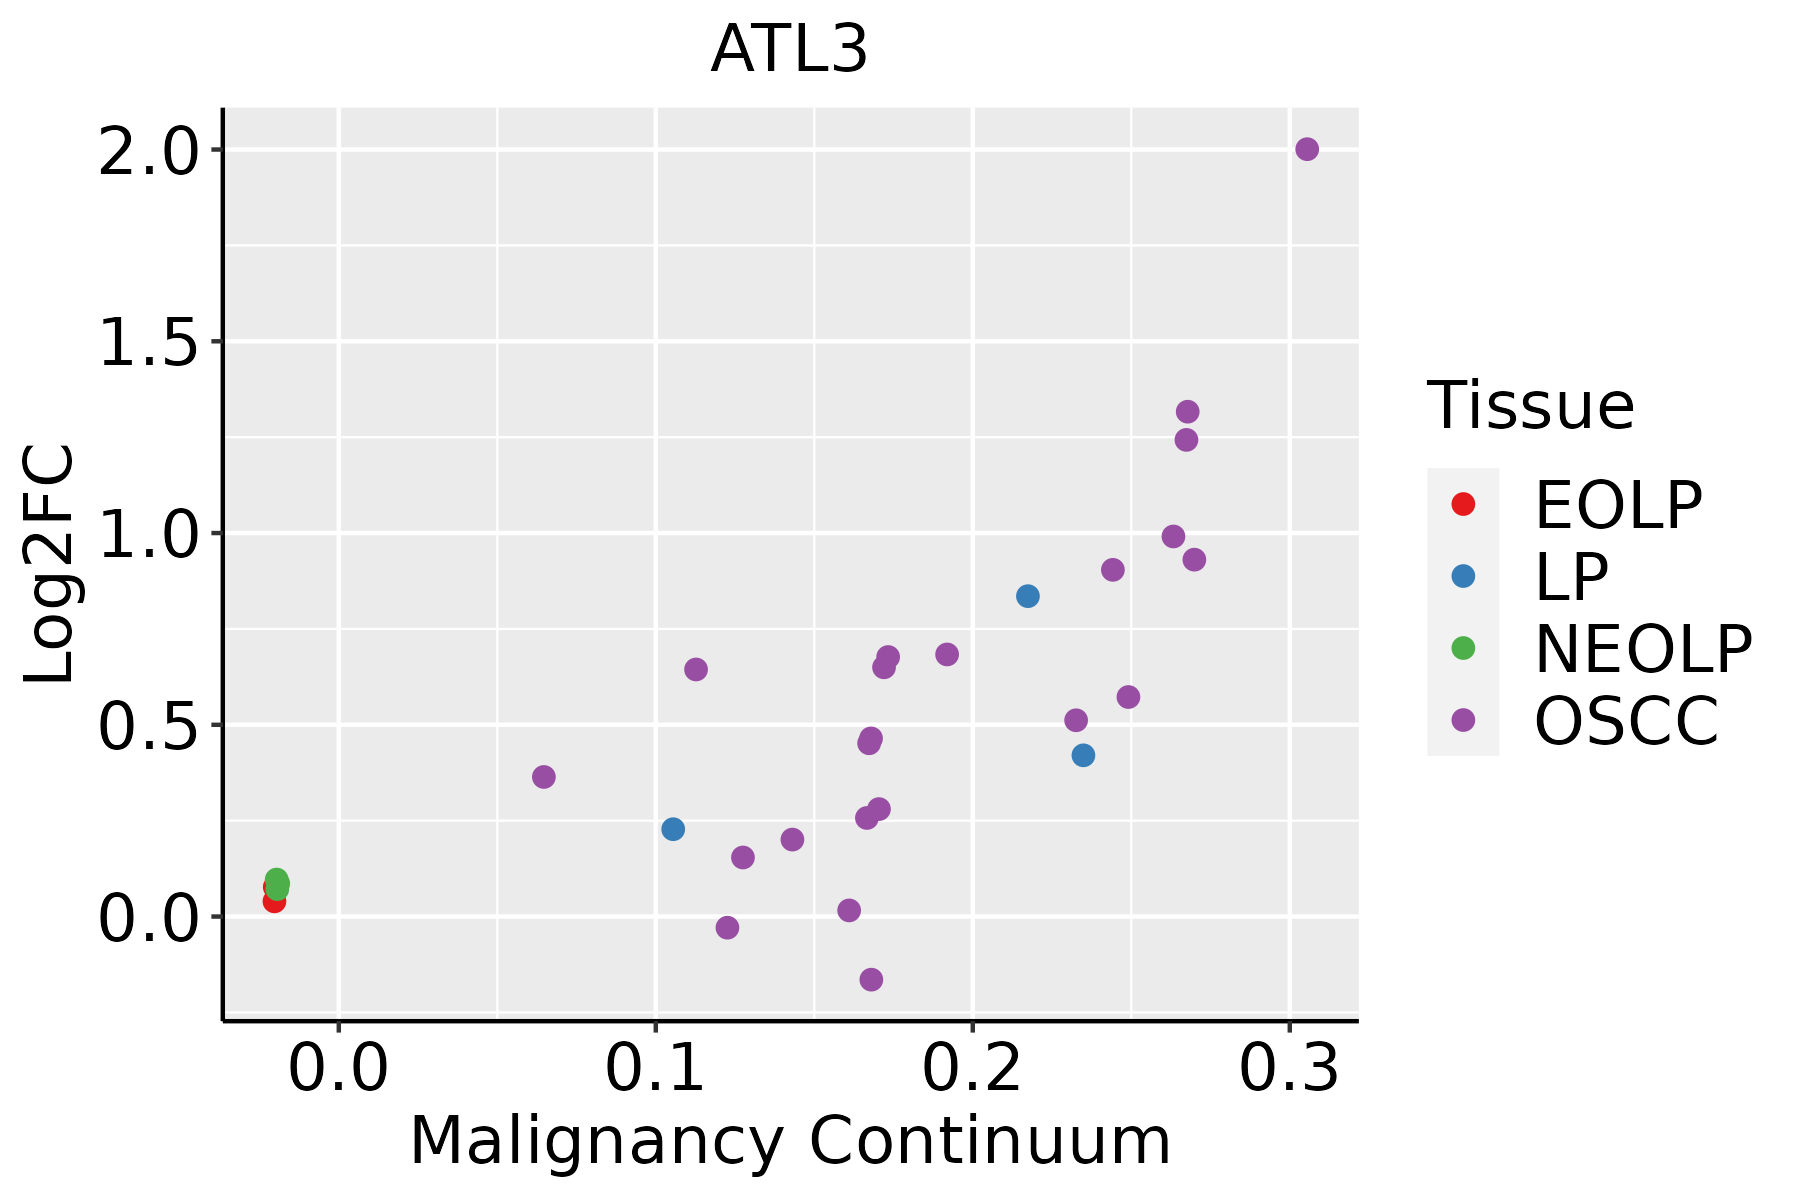 | EOLP: Erosive Oral lichen planus |
| LP: leukoplakia | ||
| NEOLP: Non-erosive oral lichen planus | ||
| OSCC: Oral squamous cell carcinoma | ||
| Skin | 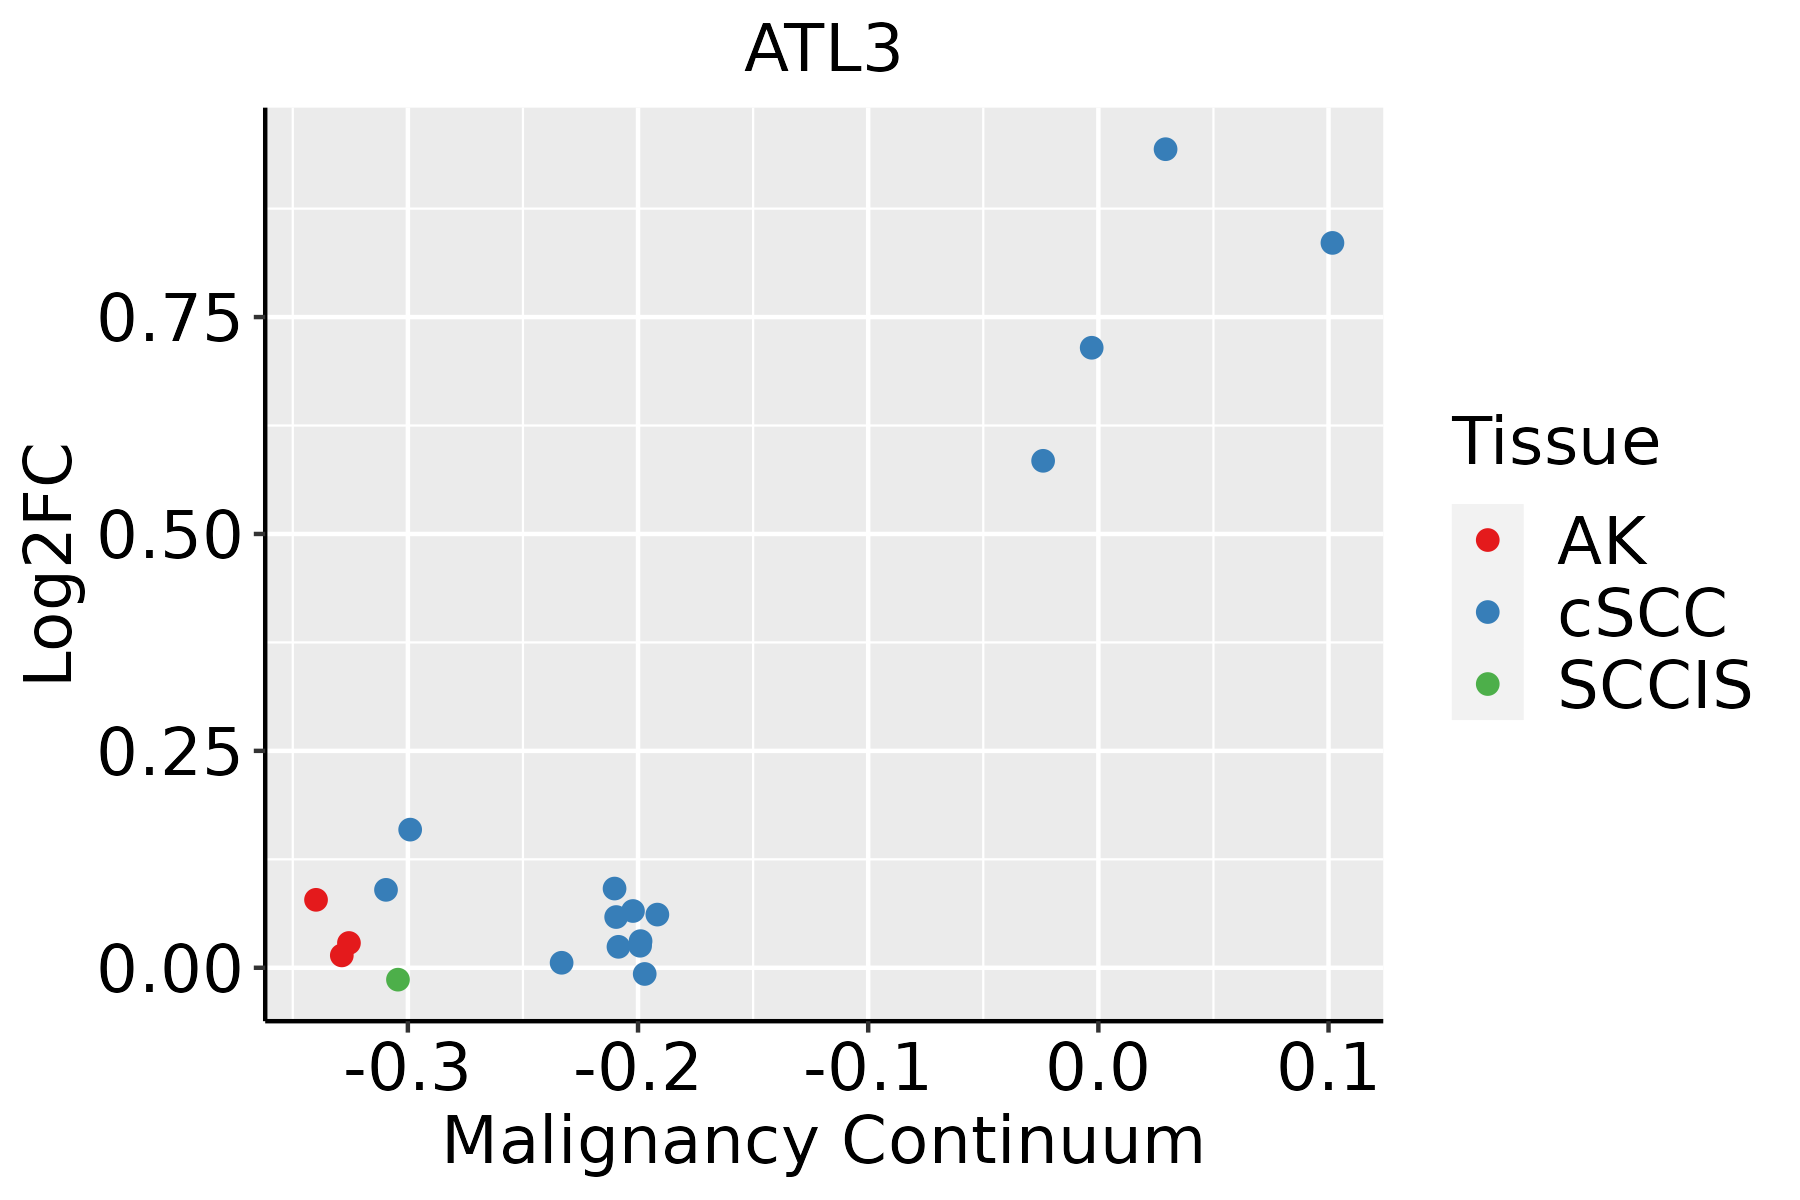 | AK: Actinic keratosis |
| cSCC: Cutaneous squamous cell carcinoma | ||
| SCCIS:squamous cell carcinoma in situ | ||
| Thyroid | 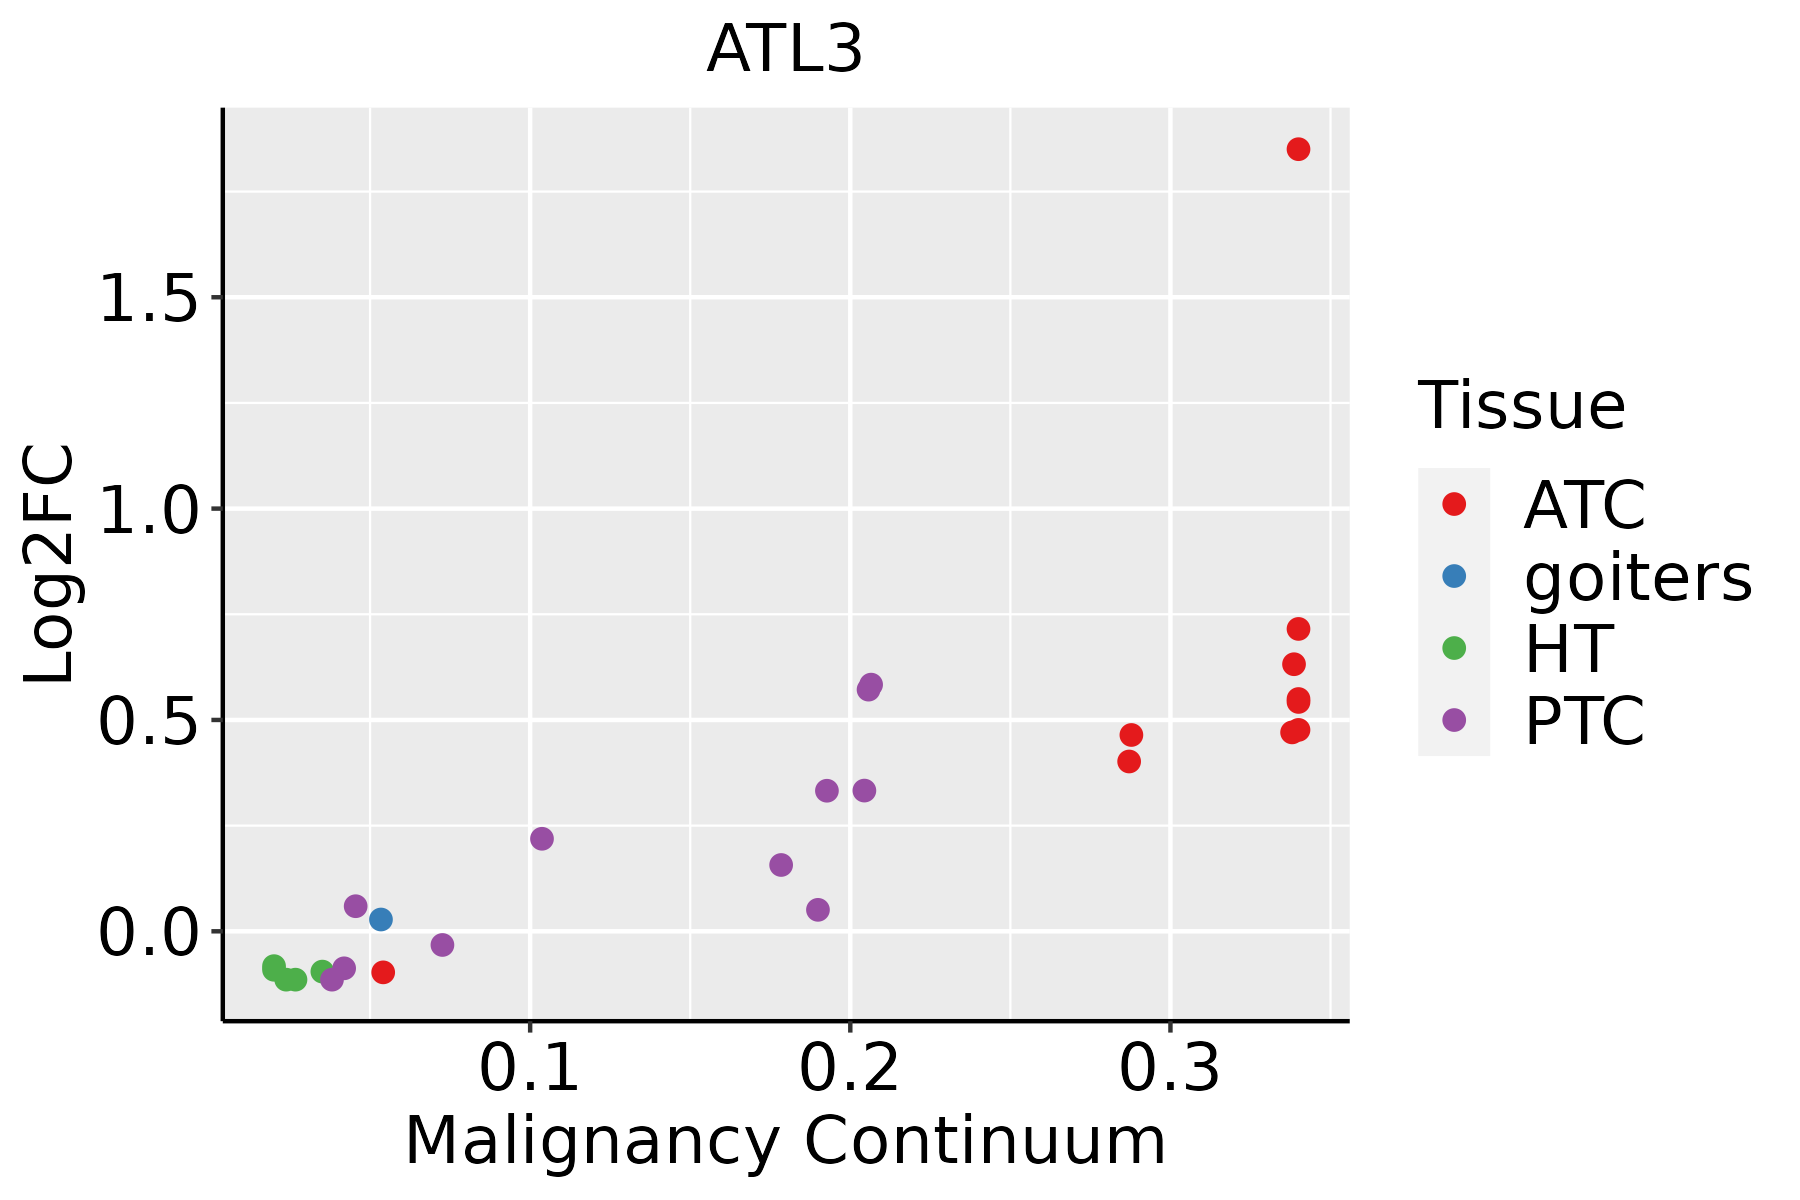 | ATC: Anaplastic thyroid cancer |
| HT: Hashimoto's thyroiditis | ||
| PTC: Papillary thyroid cancer |
| ∗log2FC in expression of this searched gene in stem-like cells from each diseased tissue sample relative to stem-like cells in normal samples in each tissue plotted against the malignancy continuum. Samples are colored based on if they are from different disease stage. |
Top |
Malignant transformation related pathway analysis |
| Find out the enriched GO biological processes and KEGG pathways involved in transition from healthy to precancer to cancer |
| Tissue | Disease Stage | Enriched GO biological Processes |
| Colorectum | AD |  |
| Colorectum | SER |  |
| Colorectum | MSS |  |
| Colorectum | MSI-H |  |
| Colorectum | FAP |  |
| ∗Top 15 enriched GO BP terms are showed in the bar plot of each disease state in each tissue. Each row represents a significant GO biological process which is colored according to the -log10(p.adjust). |
| Page: 1 2 3 4 5 6 7 8 9 |
| GO ID | Tissue | Disease Stage | Description | Gene Ratio | Bg Ratio | pvalue | p.adjust | Count |
| GO:000702914 | Esophagus | ESCC | endoplasmic reticulum organization | 65/8552 | 87/18723 | 3.28e-08 | 6.08e-07 | 65 |
| GO:00070308 | Esophagus | ESCC | Golgi organization | 101/8552 | 157/18723 | 1.78e-06 | 2.10e-05 | 101 |
| GO:00717865 | Esophagus | ESCC | endoplasmic reticulum tubular network organization | 15/8552 | 18/18723 | 1.20e-03 | 5.88e-03 | 15 |
| GO:00512592 | Esophagus | ESCC | protein complex oligomerization | 130/8552 | 238/18723 | 3.29e-03 | 1.36e-02 | 130 |
| GO:00070301 | Liver | Cirrhotic | Golgi organization | 68/4634 | 157/18723 | 2.57e-07 | 6.41e-06 | 68 |
| GO:00070292 | Liver | Cirrhotic | endoplasmic reticulum organization | 42/4634 | 87/18723 | 1.67e-06 | 3.22e-05 | 42 |
| GO:00717861 | Liver | Cirrhotic | endoplasmic reticulum tubular network organization | 11/4634 | 18/18723 | 1.13e-03 | 7.73e-03 | 11 |
| GO:000702911 | Liver | HCC | endoplasmic reticulum organization | 64/7958 | 87/18723 | 3.92e-09 | 1.04e-07 | 64 |
| GO:00070302 | Liver | HCC | Golgi organization | 99/7958 | 157/18723 | 1.54e-07 | 2.85e-06 | 99 |
| GO:00717862 | Liver | HCC | endoplasmic reticulum tubular network organization | 15/7958 | 18/18723 | 4.74e-04 | 3.12e-03 | 15 |
| GO:00070294 | Oral cavity | OSCC | endoplasmic reticulum organization | 58/7305 | 87/18723 | 1.59e-07 | 2.61e-06 | 58 |
| GO:00070307 | Oral cavity | OSCC | Golgi organization | 92/7305 | 157/18723 | 4.96e-07 | 7.27e-06 | 92 |
| GO:0051259 | Oral cavity | OSCC | protein complex oligomerization | 121/7305 | 238/18723 | 1.29e-04 | 9.21e-04 | 121 |
| GO:00717864 | Oral cavity | OSCC | endoplasmic reticulum tubular network organization | 14/7305 | 18/18723 | 9.51e-04 | 4.96e-03 | 14 |
| GO:000702913 | Oral cavity | LP | endoplasmic reticulum organization | 41/4623 | 87/18723 | 4.49e-06 | 9.16e-05 | 41 |
| GO:00512591 | Oral cavity | LP | protein complex oligomerization | 85/4623 | 238/18723 | 8.81e-05 | 1.11e-03 | 85 |
| GO:007178611 | Oral cavity | LP | endoplasmic reticulum tubular network organization | 10/4623 | 18/18723 | 4.91e-03 | 3.06e-02 | 10 |
| GO:00070296 | Skin | cSCC | endoplasmic reticulum organization | 42/4864 | 87/18723 | 6.36e-06 | 8.92e-05 | 42 |
| GO:00070309 | Skin | cSCC | Golgi organization | 64/4864 | 157/18723 | 3.53e-05 | 3.83e-04 | 64 |
| GO:007178612 | Skin | cSCC | endoplasmic reticulum tubular network organization | 11/4864 | 18/18723 | 1.74e-03 | 1.06e-02 | 11 |
| Page: 1 2 |
| Pathway ID | Tissue | Disease Stage | Description | Gene Ratio | Bg Ratio | pvalue | p.adjust | qvalue | Count |
| Page: 1 |
Top |
Cell-cell communication analysis |
| Identification of potential cell-cell interactions between two cell types and their ligand-receptor pairs for different disease states |
| Ligand | Receptor | LRpair | Pathway | Tissue | Disease Stage |
| Page: 1 |
Top |
Single-cell gene regulatory network inference analysis |
| Find out the significant the regulons (TFs) and the target genes of each regulon across cell types for different disease states |
| TF | Cell Type | Tissue | Disease Stage | Target Gene | RSS | Regulon Activity |
| ∗The dot plots of a searched regulon are shown for all cell subpopulations in each disease state of each tissue based on the regulon specific score inferred using pySCENIC and by calculating the average expression. |
| Page: 1 |
Top |
Somatic mutation of malignant transformation related genes |
| Annotation of somatic variants for genes involved in malignant transformation |
| Hugo Symbol | Variant Class | Variant Classification | dbSNP RS | HGVSc | HGVSp | HGVSp Short | SWISSPROT | BIOTYPE | SIFT | PolyPhen | Tumor Sample Barcode | Tissue | Histology | Sex | Age | Stage | Therapy Types | Drugs | Outcome |
| ATL3 | SNV | Missense_Mutation | rs765720770 | c.935N>G | p.Asn312Ser | p.N312S | Q6DD88 | protein_coding | tolerated(0.29) | benign(0.255) | TCGA-D8-A141-01 | Breast | breast invasive carcinoma | Female | <65 | I/II | Chemotherapy | doxorubicine | SD |
| ATL3 | SNV | Missense_Mutation | c.422N>A | p.Met141Lys | p.M141K | Q6DD88 | protein_coding | deleterious(0) | probably_damaging(0.982) | TCGA-D8-A1X9-01 | Breast | breast invasive carcinoma | Female | >=65 | I/II | Chemotherapy | adriamycin+cyclophosphamide | SD | |
| ATL3 | SNV | Missense_Mutation | novel | c.1280N>C | p.Asn427Thr | p.N427T | Q6DD88 | protein_coding | tolerated(0.06) | benign(0.062) | TCGA-E2-A15A-06 | Breast | breast invasive carcinoma | Female | <65 | III/IV | Chemotherapy | cyclophosphamide | SD |
| ATL3 | SNV | Missense_Mutation | c.992N>C | p.Ile331Thr | p.I331T | Q6DD88 | protein_coding | deleterious(0) | possibly_damaging(0.904) | TCGA-EK-A2RK-01 | Cervix | cervical & endocervical cancer | Female | >=65 | I/II | Unknown | Unknown | SD | |
| ATL3 | SNV | Missense_Mutation | c.760N>T | p.His254Tyr | p.H254Y | Q6DD88 | protein_coding | deleterious(0.03) | benign(0.097) | TCGA-LP-A4AV-01 | Cervix | cervical & endocervical cancer | Female | <65 | I/II | Unknown | Unknown | SD | |
| ATL3 | SNV | Missense_Mutation | novel | c.1450C>T | p.Leu484Phe | p.L484F | Q6DD88 | protein_coding | tolerated(0.05) | benign(0.349) | TCGA-VS-A94W-01 | Cervix | cervical & endocervical cancer | Female | <65 | I/II | Chemotherapy | cisplatin | CR |
| ATL3 | SNV | Missense_Mutation | novel | c.547N>T | p.Leu183Phe | p.L183F | Q6DD88 | protein_coding | deleterious(0) | probably_damaging(0.991) | TCGA-VS-A9UY-01 | Cervix | cervical & endocervical cancer | Female | <65 | I/II | Chemotherapy | cisplatin | PD |
| ATL3 | SNV | Missense_Mutation | c.1586N>T | p.Ala529Val | p.A529V | Q6DD88 | protein_coding | tolerated(0.16) | benign(0.033) | TCGA-A6-A565-01 | Colorectum | colon adenocarcinoma | Female | <65 | III/IV | Unspecific | 5FU | PD | |
| ATL3 | SNV | Missense_Mutation | c.1201A>G | p.Thr401Ala | p.T401A | Q6DD88 | protein_coding | tolerated(0.29) | benign(0.02) | TCGA-A6-A566-01 | Colorectum | colon adenocarcinoma | Female | <65 | III/IV | Chemotherapy | oxaliplatin | PD | |
| ATL3 | SNV | Missense_Mutation | rs759377612 | c.945N>T | p.Lys315Asn | p.K315N | Q6DD88 | protein_coding | deleterious(0.04) | benign(0.185) | TCGA-F4-6856-01 | Colorectum | colon adenocarcinoma | Male | <65 | I/II | Ancillary | leucovorin | CR |
| Page: 1 2 3 4 |
Top |
Related drugs of malignant transformation related genes |
| Identification of chemicals and drugs interact with genes involved in malignant transfromation |
| (DGIdb 4.0) |
| Entrez ID | Symbol | Category | Interaction Types | Drug Claim Name | Drug Name | PMIDs |
| Page: 1 |

Copyright 2023-Present -The University of Texas Health Science Center at Houston |