Schematic overview of the cellular and molecular mechanisms involved in the cancer progression, including the proposed cellular and molecular mechanisms in cancer cells trajectory. AT1: alveolar type 1 cells; AT2: alveolar type 2 cells; AAH: atypical adenomatous hyperplasia; AIS: adenocarcinoma in situ; MIA: minimally invasive adenocarcinoma; IA: invasive adenocarcinoma; EMT: epithelial-mesenchymal transition

Home

Download

Statistics

Help

Contact

Center for Computational Systems Medicine
leaf

Gene summary

leaf

Malignant transformation analysis

leaf

Malignant transformation related pathway analysis

leaf

Cell-cell communication analysis

leaf

Single-cell gene regulatory network inference analysis

leaf

Somatic mutation of malignant transformation related genes

leaf

Related drugs of malignant transformation related genes

Gene: ATL2

Gene summary for ATL2

check button Gene summary.

Gene informationSpeciesHuman
Gene symbol

ATL2

Gene ID

64225

Gene nameatlastin GTPase 2
Gene AliasARL3IP2
Cytomap2p22.2-p22.1
Gene Typeprotein-coding
GO ID

GO:0006996

UniProtAcc

Q8NHH9


Top

Malignant transformation analysis

check button Identification of the aberrant gene expression in precancerous and cancerous lesions by comparing the gene expression of stem-like cells in diseased tissues with normal stem cells
check button Malignant transformation involving gene list.
Entrez IDSymbolReplicatesSpeciesOrganTissueAdj P-valueLog2FCMalignancy
64225ATL2CCI_2HumanCervixCC4.95e-078.04e-010.5249
64225ATL2CCI_3HumanCervixCC6.04e-086.12e-010.516
64225ATL2HTA11_3410_2000001011HumanColorectumAD1.31e-298.93e-010.0155
64225ATL2HTA11_2487_2000001011HumanColorectumSER7.30e-044.39e-01-0.1808
64225ATL2HTA11_2951_2000001011HumanColorectumAD4.18e-035.85e-010.0216
64225ATL2HTA11_1938_2000001011HumanColorectumAD1.07e-221.09e+00-0.0811
64225ATL2HTA11_347_2000001011HumanColorectumAD5.74e-319.20e-01-0.1954
64225ATL2HTA11_411_2000001011HumanColorectumSER1.83e-081.13e+00-0.2602
64225ATL2HTA11_3361_2000001011HumanColorectumAD9.76e-097.20e-01-0.1207
64225ATL2HTA11_83_2000001011HumanColorectumSER1.20e-046.57e-01-0.1526
64225ATL2HTA11_696_2000001011HumanColorectumAD8.41e-261.17e+00-0.1464
64225ATL2HTA11_866_2000001011HumanColorectumAD9.65e-043.39e-01-0.1001
64225ATL2HTA11_1391_2000001011HumanColorectumAD1.59e-034.20e-01-0.059
64225ATL2HTA11_2992_2000001011HumanColorectumSER1.42e-141.31e+00-0.1706
64225ATL2HTA11_5212_2000001011HumanColorectumAD2.73e-111.04e+00-0.2061
64225ATL2HTA11_5216_2000001011HumanColorectumSER7.21e-171.42e+00-0.1462
64225ATL2HTA11_546_2000001011HumanColorectumAD9.91e-141.12e+00-0.0842
64225ATL2HTA11_99999965104_69814HumanColorectumMSS1.20e-127.95e-010.281
64225ATL2A001-C-207HumanColorectumFAP6.78e-04-2.97e-010.1278
64225ATL2A015-C-203HumanColorectumFAP1.67e-19-2.91e-01-0.1294
Page: 1 2 3 4 5 6 7 8 9 

check button Transcriptomic changes along malignancy continuum.
TissueExpression DynamicsAbbreviation
CervixThe image shows the transcriptomic changes along malignancy continuum.log2FC in expression of this searched gene in stem-like cells from each diseased tissue sample relative to stem-like cells in normal samples in each tissue plotted against the malignancy continuum. Samples are colored based on if they are from different disease stage.CC: Cervix cancer
HSIL_HPV: HPV-infected high-grade squamous intraepithelial lesions
N_HPV: HPV-infected normal cervix
Colorectum (GSE201348)The image shows the transcriptomic changes along malignancy continuum.log2FC in expression of this searched gene in stem-like cells from each diseased tissue sample relative to stem-like cells in normal samples in each tissue plotted against the malignancy continuum. Samples are colored based on if they are from different disease stage.
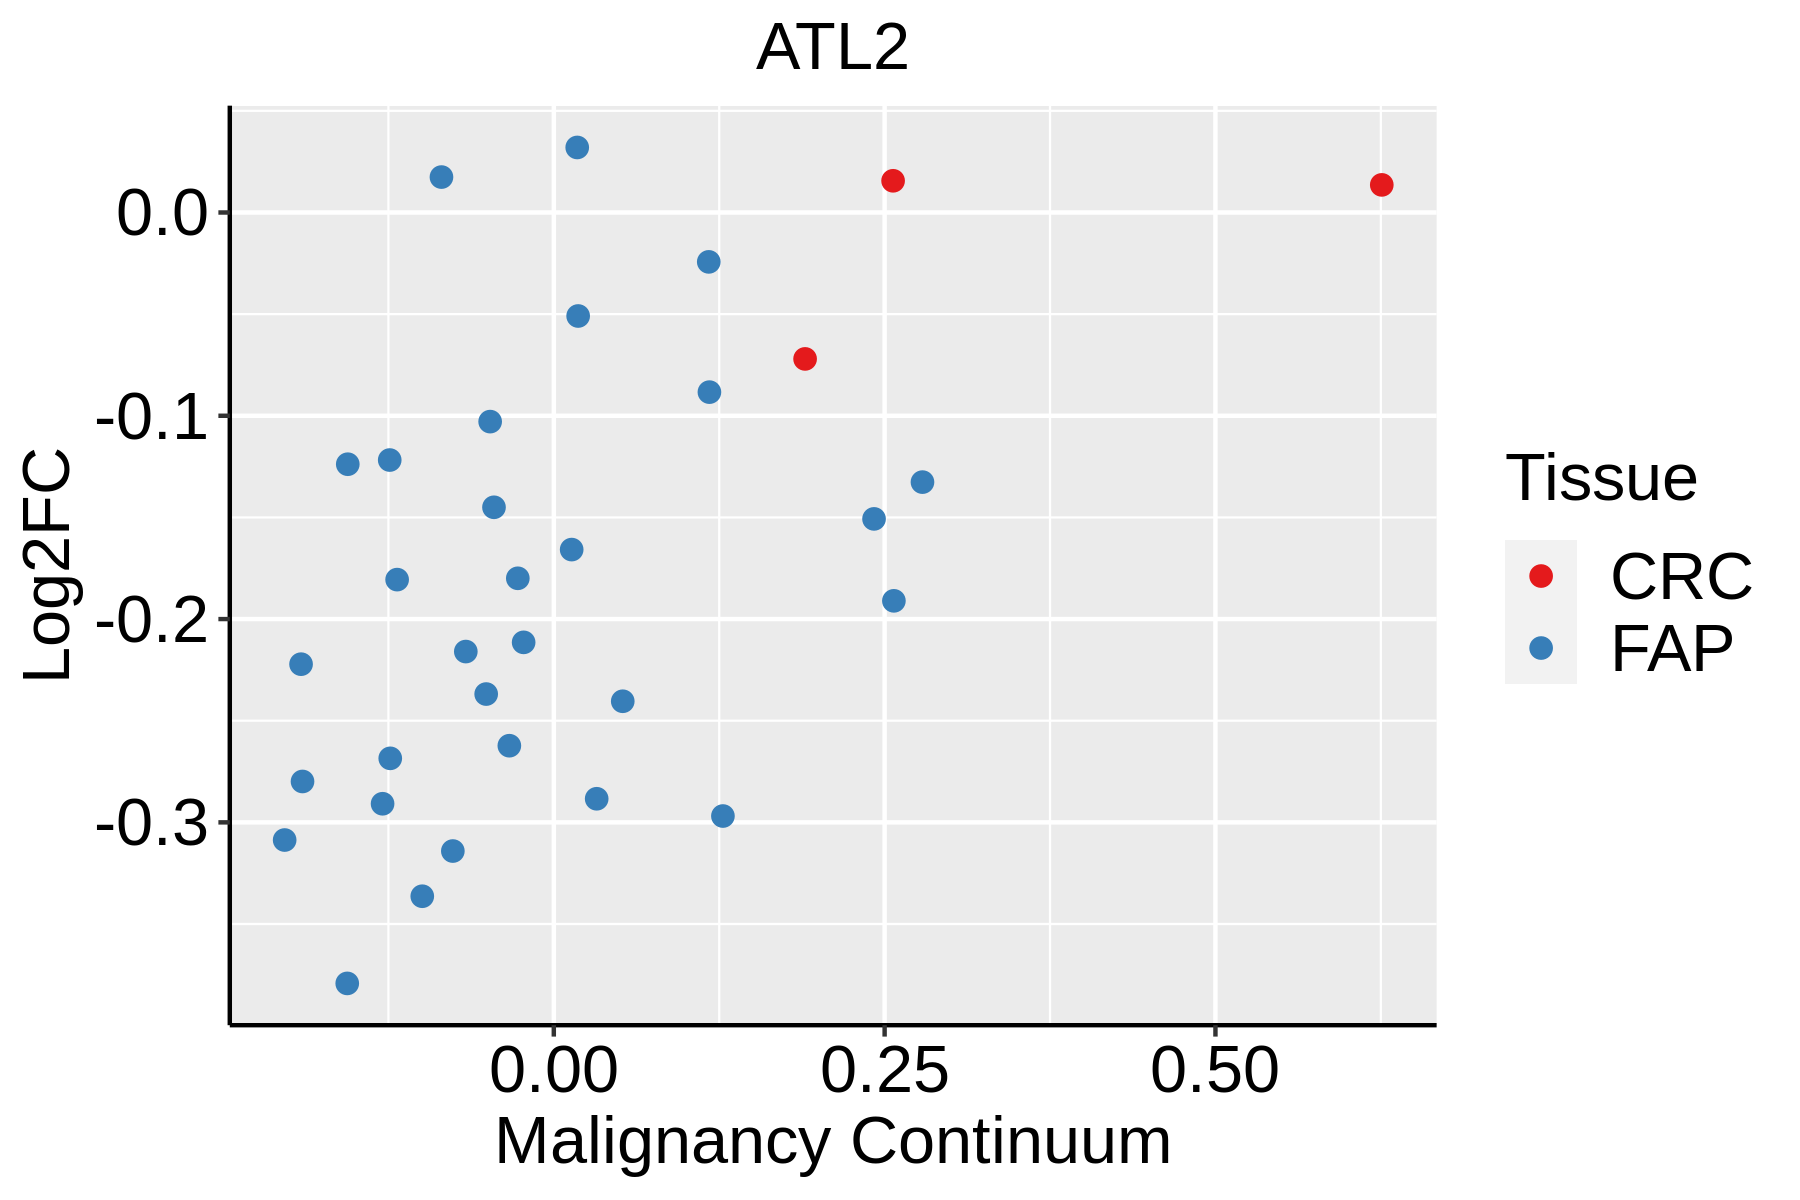
FAP: Familial adenomatous polyposis
CRC: Colorectal cancer
Colorectum (HTA11)The image shows the transcriptomic changes along malignancy continuum.log2FC in expression of this searched gene in stem-like cells from each diseased tissue sample relative to stem-like cells in normal samples in each tissue plotted against the malignancy continuum. Samples are colored based on if they are from different disease stage.AD: Adenomas
SER: Sessile serrated lesions
MSI-H: Microsatellite-high colorectal cancer
MSS: Microsatellite stable colorectal cancer
EndometriumThe image shows the transcriptomic changes along malignancy continuum.log2FC in expression of this searched gene in stem-like cells from each diseased tissue sample relative to stem-like cells in normal samples in each tissue plotted against the malignancy continuum. Samples are colored based on if they are from different disease stage.
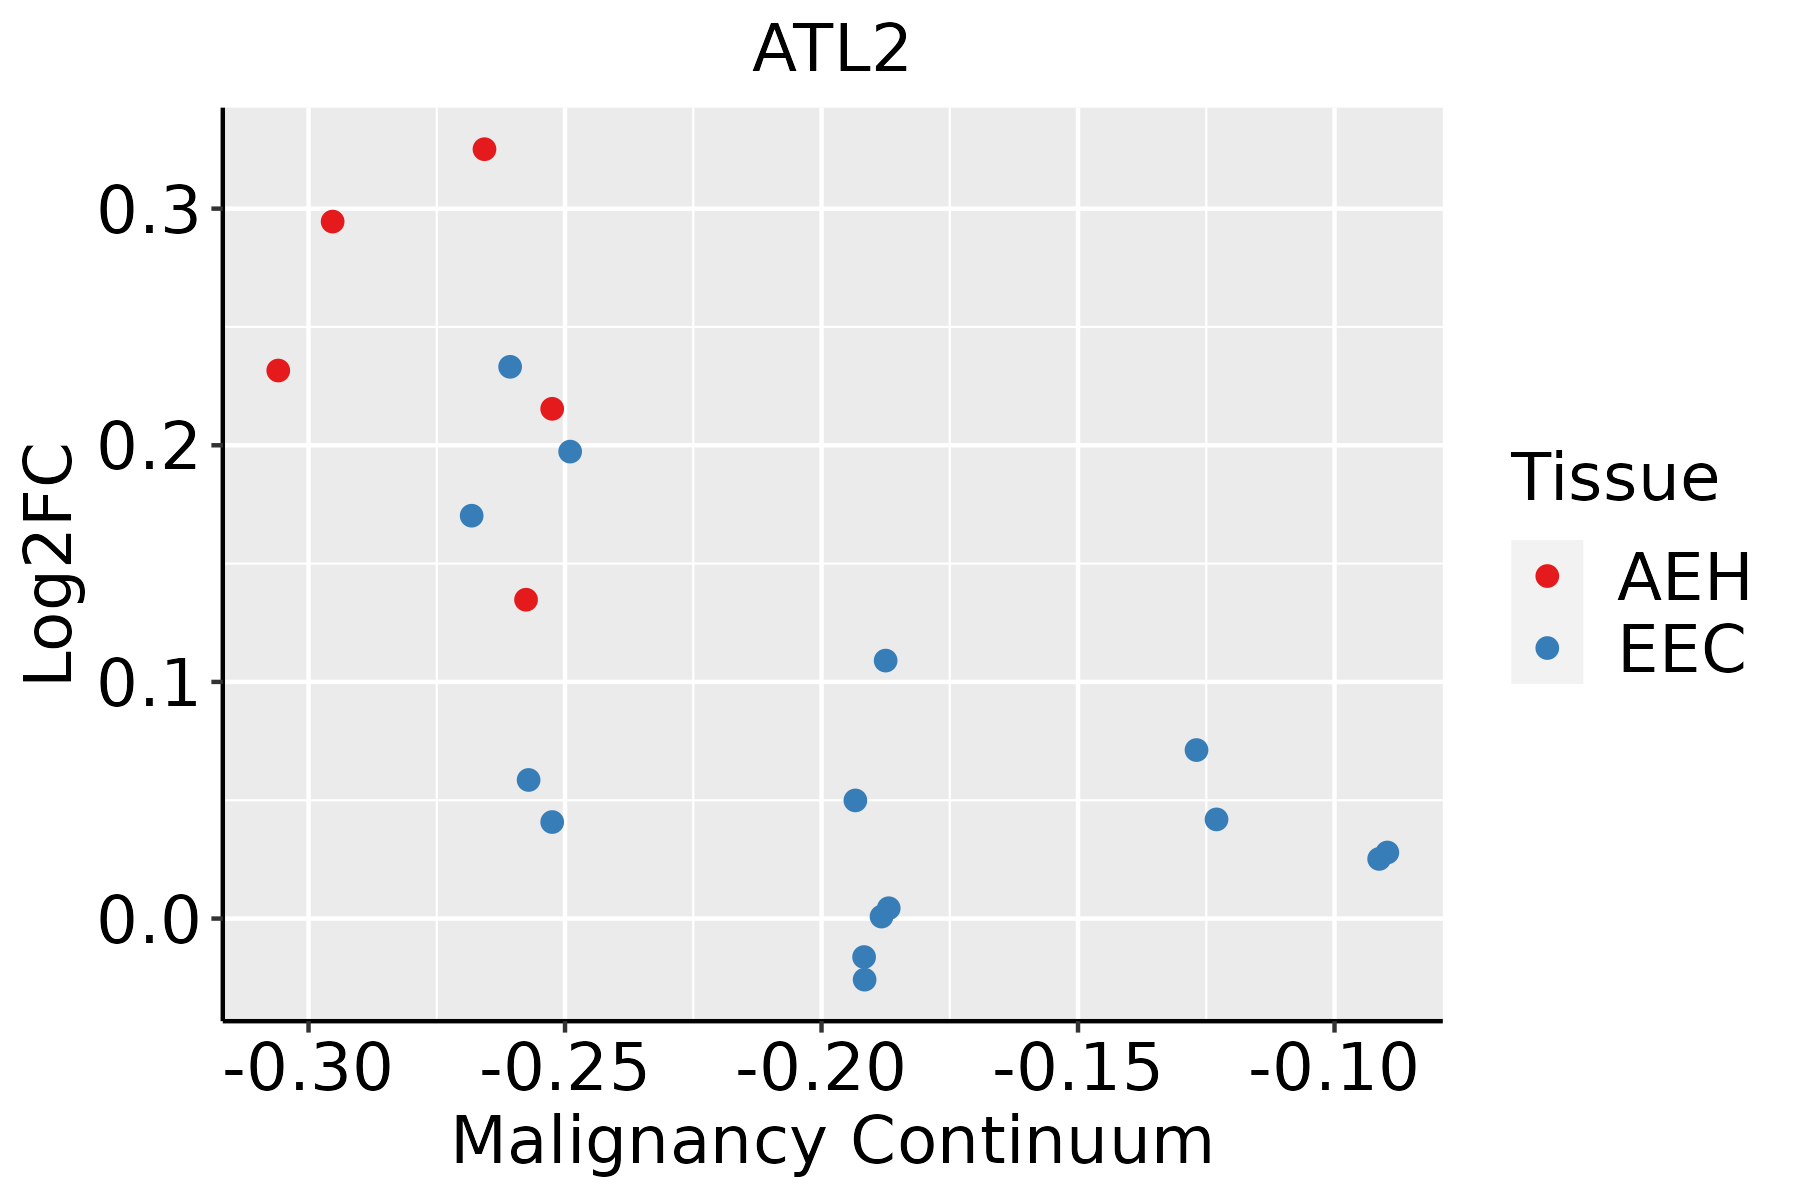
AEH: Atypical endometrial hyperplasia
EEC: Endometrioid Cancer
EsophagusThe image shows the transcriptomic changes along malignancy continuum.log2FC in expression of this searched gene in stem-like cells from each diseased tissue sample relative to stem-like cells in normal samples in each tissue plotted against the malignancy continuum. Samples are colored based on if they are from different disease stage.
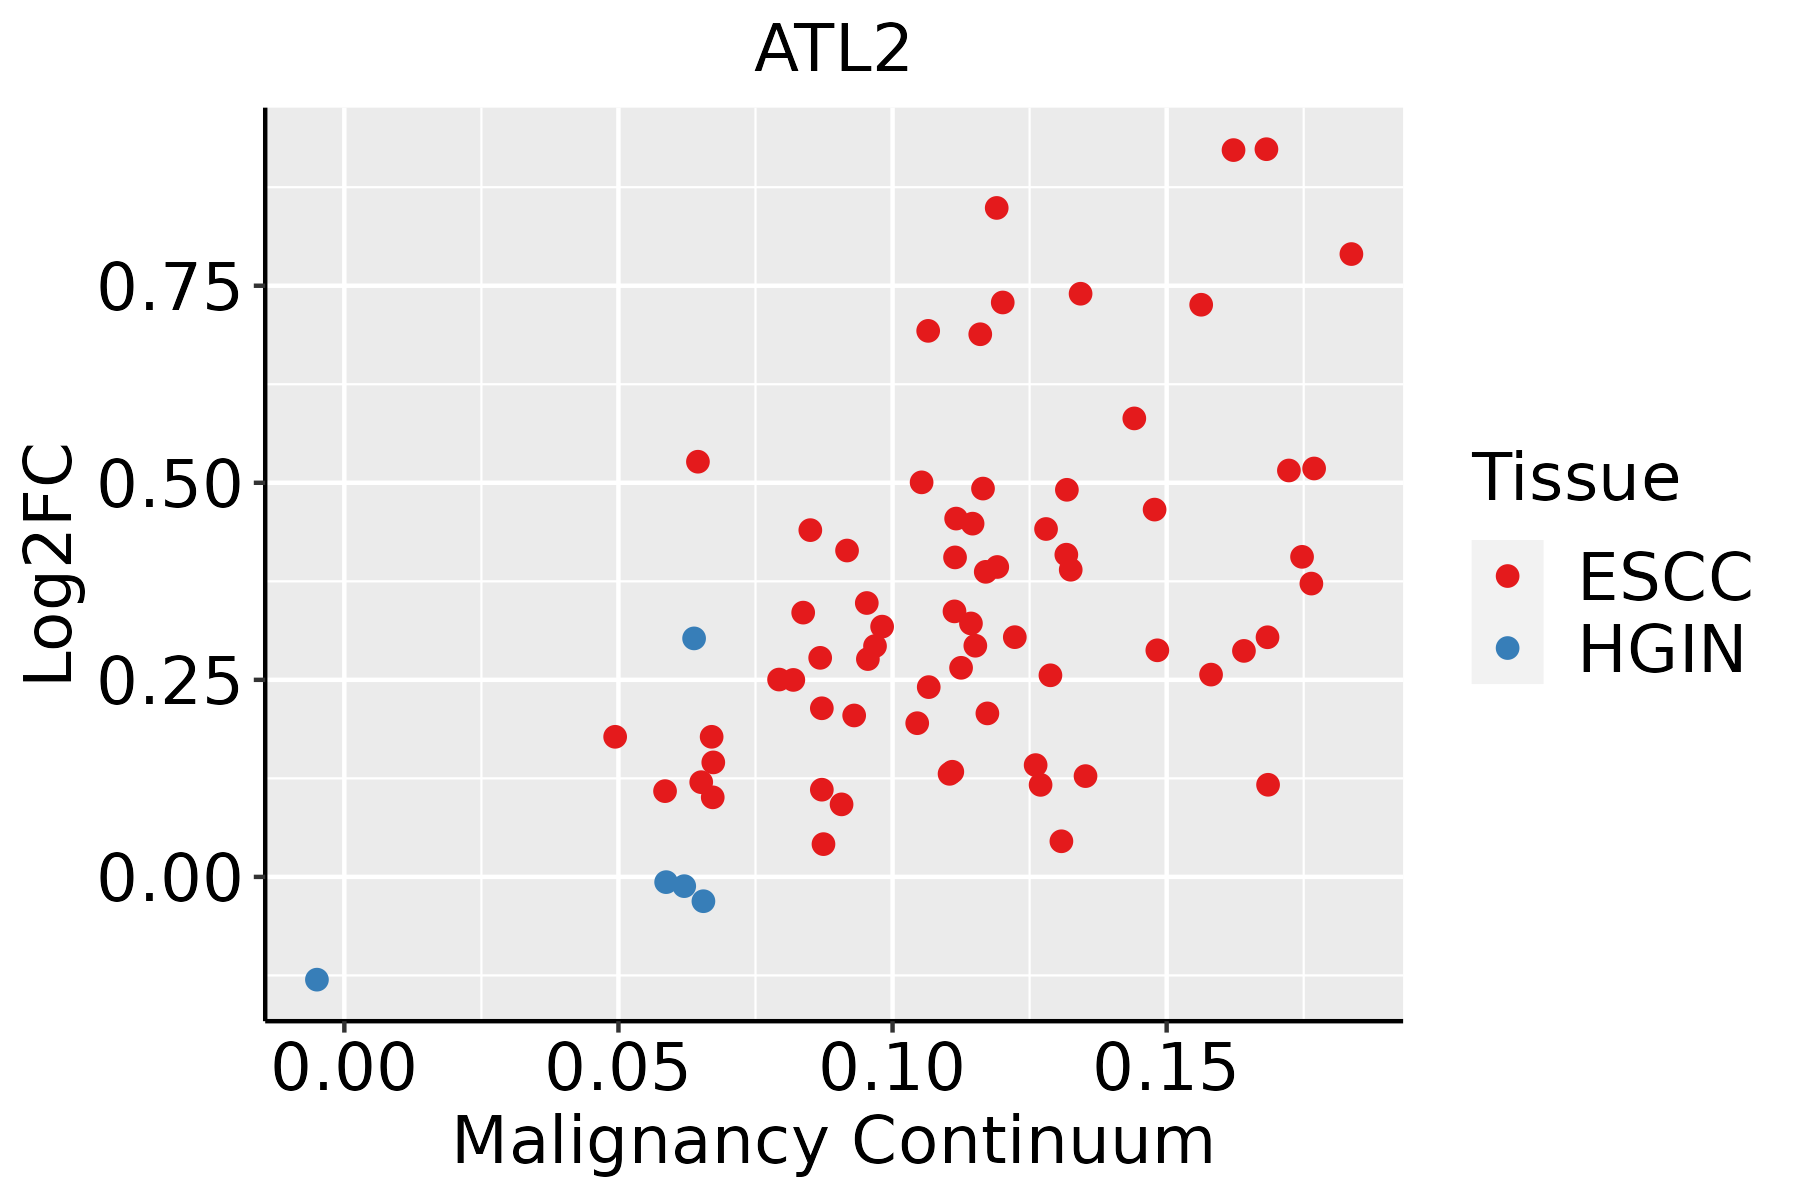
ESCC: Esophageal squamous cell carcinoma
HGIN: High-grade intraepithelial neoplasias
LGIN: Low-grade intraepithelial neoplasias
LiverThe image shows the transcriptomic changes along malignancy continuum.log2FC in expression of this searched gene in stem-like cells from each diseased tissue sample relative to stem-like cells in normal samples in each tissue plotted against the malignancy continuum. Samples are colored based on if they are from different disease stage.HCC: Hepatocellular carcinoma
NAFLD: Non-alcoholic fatty liver disease
LungThe image shows the transcriptomic changes along malignancy continuum.log2FC in expression of this searched gene in stem-like cells from each diseased tissue sample relative to stem-like cells in normal samples in each tissue plotted against the malignancy continuum. Samples are colored based on if they are from different disease stage.
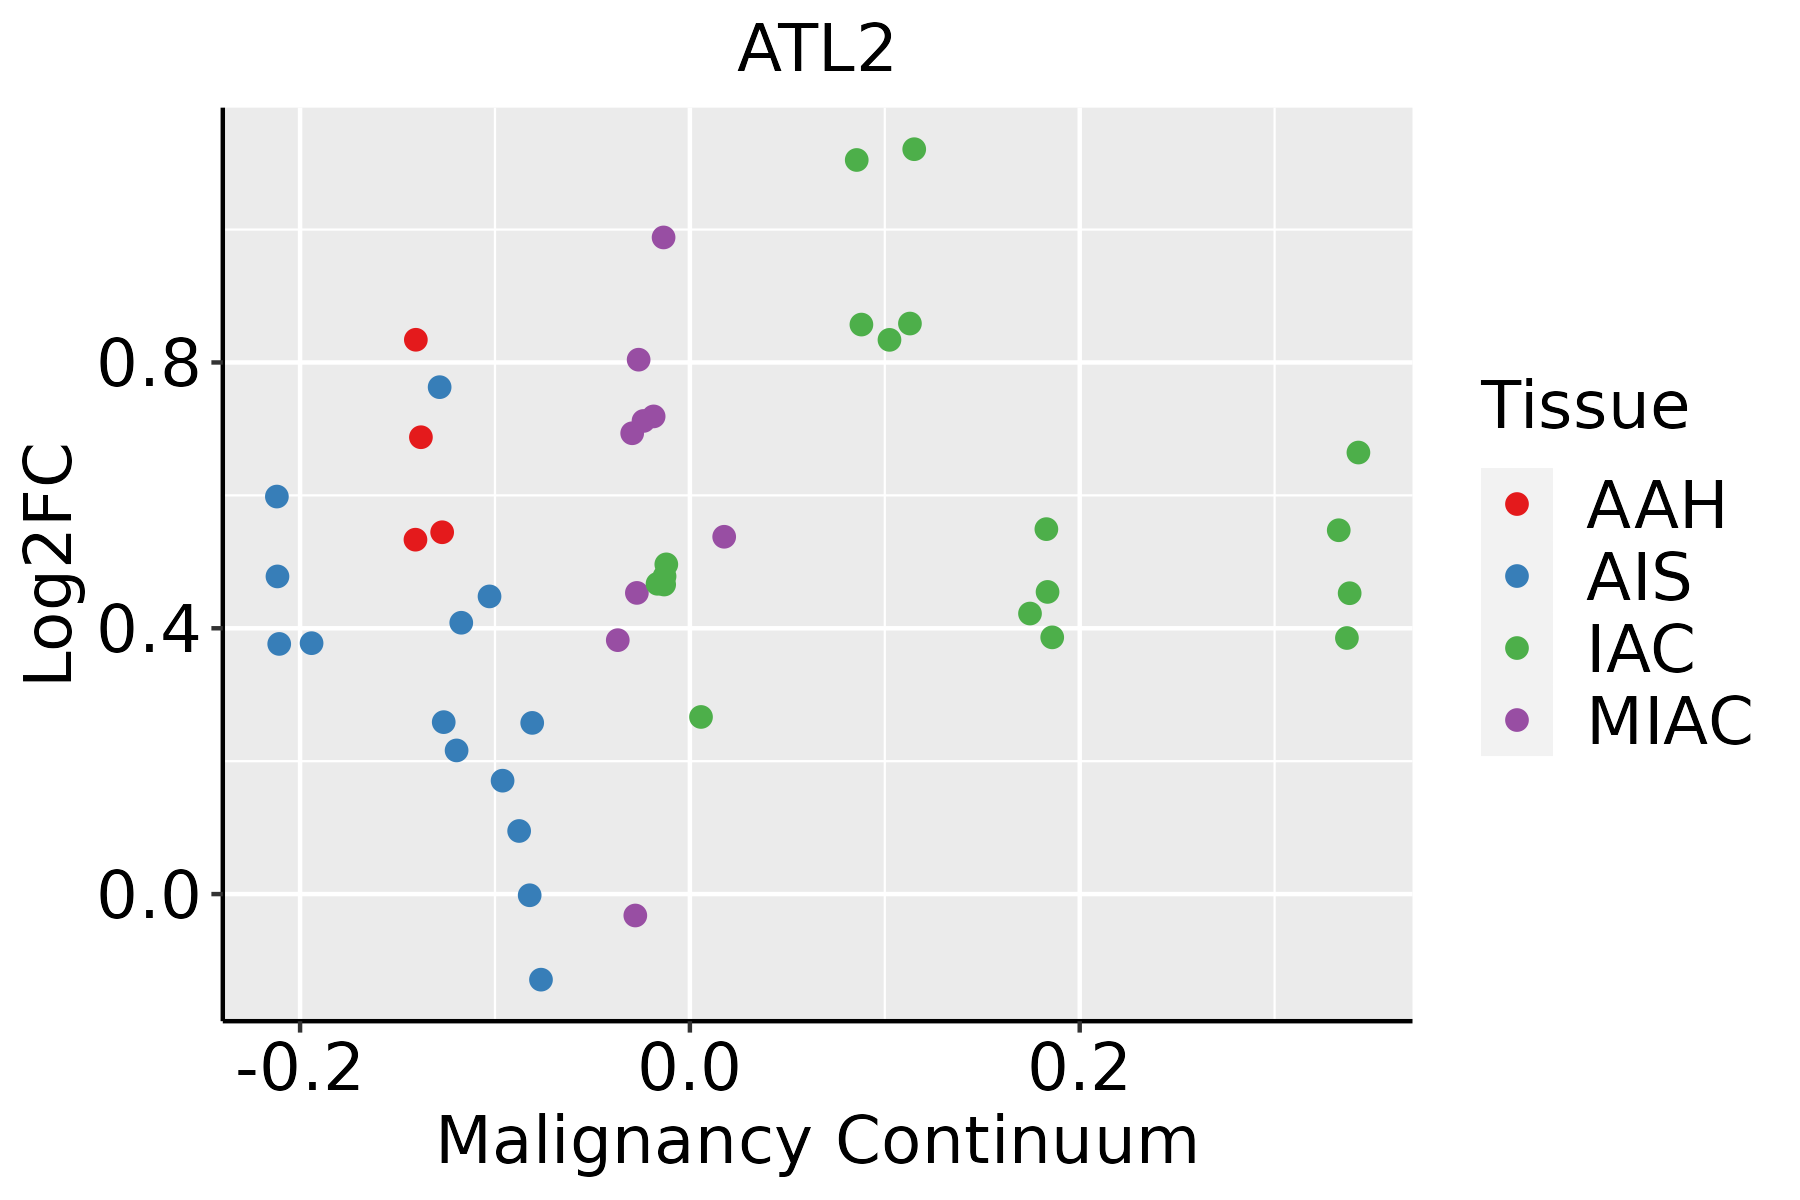
AAH: Atypical adenomatous hyperplasia
AIS: Adenocarcinoma in situ
IAC: Invasive lung adenocarcinoma
MIA: Minimally invasive adenocarcinoma
Oral CavityThe image shows the transcriptomic changes along malignancy continuum.log2FC in expression of this searched gene in stem-like cells from each diseased tissue sample relative to stem-like cells in normal samples in each tissue plotted against the malignancy continuum. Samples are colored based on if they are from different disease stage.
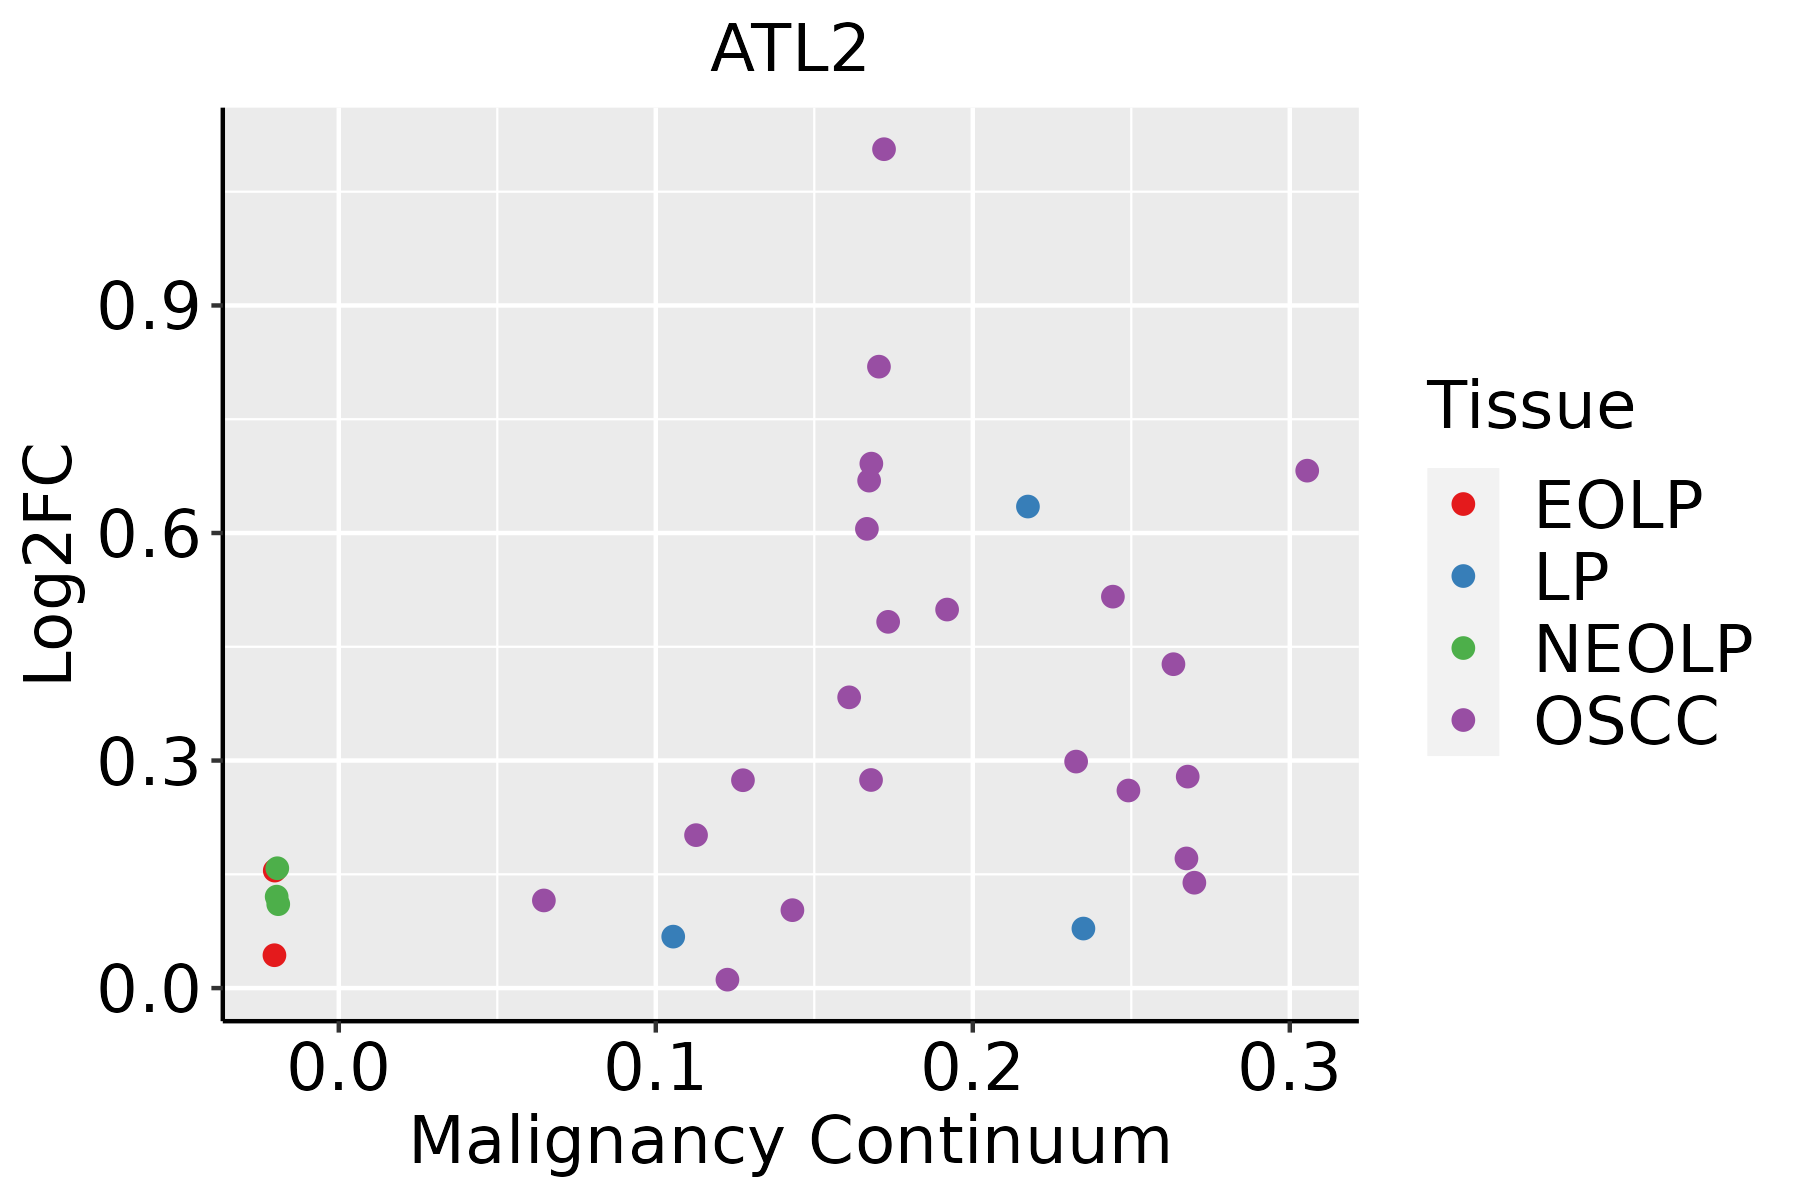
EOLP: Erosive Oral lichen planus
LP: leukoplakia
NEOLP: Non-erosive oral lichen planus
OSCC: Oral squamous cell carcinoma
SkinThe image shows the transcriptomic changes along malignancy continuum.log2FC in expression of this searched gene in stem-like cells from each diseased tissue sample relative to stem-like cells in normal samples in each tissue plotted against the malignancy continuum. Samples are colored based on if they are from different disease stage.AK: Actinic keratosis
cSCC: Cutaneous squamous cell carcinoma
SCCIS:squamous cell carcinoma in situ
ThyroidThe image shows the transcriptomic changes along malignancy continuum.log2FC in expression of this searched gene in stem-like cells from each diseased tissue sample relative to stem-like cells in normal samples in each tissue plotted against the malignancy continuum. Samples are colored based on if they are from different disease stage.ATC: Anaplastic thyroid cancer
HT: Hashimoto's thyroiditis
PTC: Papillary thyroid cancer
∗log2FC in expression of this searched gene in stem-like cells from each diseased tissue sample relative to stem-like cells in normal samples in each tissue plotted against the malignancy continuum. Samples are colored based on if they are from different disease stage.

Top

Malignant transformation related pathway analysis

check buttonFind out the enriched GO biological processes and KEGG pathways involved in transition from healthy to precancer to cancer
check button Figure of enriched GO biological processes.
TissueDisease StageEnriched GO biological Processes
ColorectumADGO analysis - Figure of enriched GO biological processes: Top 15 enriched GO BP terms are showed in the bar plot of each disease state in each tissue. Each row represents a significant GO biological process which is colored according to the -log10(p.adjust).
ColorectumSERGO analysis - Figure of enriched GO biological processes: Top 15 enriched GO BP terms are showed in the bar plot of each disease state in each tissue. Each row represents a significant GO biological process which is colored according to the -log10(p.adjust).
ColorectumMSSGO analysis - Figure of enriched GO biological processes: Top 15 enriched GO BP terms are showed in the bar plot of each disease state in each tissue. Each row represents a significant GO biological process which is colored according to the -log10(p.adjust).
ColorectumMSI-HGO analysis - Figure of enriched GO biological processes: Top 15 enriched GO BP terms are showed in the bar plot of each disease state in each tissue. Each row represents a significant GO biological process which is colored according to the -log10(p.adjust).
ColorectumFAPGO analysis - Figure of enriched GO biological processes: Top 15 enriched GO BP terms are showed in the bar plot of each disease state in each tissue. Each row represents a significant GO biological process which is colored according to the -log10(p.adjust).
∗Top 15 enriched GO BP terms are showed in the bar plot of each disease state in each tissue. Each row represents a significant GO biological process which is colored according to the -log10(p.adjust).
Page: 1 2 3 4 5 6 7 8 9 

check button Enriched GO biological processes.
GO IDTissueDisease StageDescriptionGene RatioBg Ratiopvaluep.adjustCount
GO:00070304CervixCCGolgi organization32/2311157/187232.78e-031.87e-0232
GO:0007029ColorectumADendoplasmic reticulum organization31/391887/187231.08e-031.00e-0231
GO:0071786ColorectumADendoplasmic reticulum tubular network organization9/391818/187235.82e-033.67e-029
GO:00070291ColorectumSERendoplasmic reticulum organization23/289787/187235.77e-034.23e-0223
GO:00070305EndometriumAEHGolgi organization32/2100157/187235.73e-045.69e-0332
GO:000703012EndometriumEECGolgi organization32/2168157/187239.87e-048.76e-0332
GO:00070295EsophagusHGINendoplasmic reticulum organization22/258787/187233.07e-032.90e-0222
GO:000702914EsophagusESCCendoplasmic reticulum organization65/855287/187233.28e-086.08e-0765
GO:00070308EsophagusESCCGolgi organization101/8552157/187231.78e-062.10e-05101
GO:00717865EsophagusESCCendoplasmic reticulum tubular network organization15/855218/187231.20e-035.88e-0315
GO:00512592EsophagusESCCprotein complex oligomerization130/8552238/187233.29e-031.36e-02130
GO:0007030LiverNAFLDGolgi organization36/1882157/187231.76e-067.68e-0536
GO:00717863LiverNAFLDendoplasmic reticulum tubular network organization6/188218/187236.55e-034.69e-026
GO:00070301LiverCirrhoticGolgi organization68/4634157/187232.57e-076.41e-0668
GO:00070292LiverCirrhoticendoplasmic reticulum organization42/463487/187231.67e-063.22e-0542
GO:00717861LiverCirrhoticendoplasmic reticulum tubular network organization11/463418/187231.13e-037.73e-0311
GO:000702911LiverHCCendoplasmic reticulum organization64/795887/187233.92e-091.04e-0764
GO:00070302LiverHCCGolgi organization99/7958157/187231.54e-072.85e-0699
GO:00717862LiverHCCendoplasmic reticulum tubular network organization15/795818/187234.74e-043.12e-0315
GO:0090158LiverHCCendoplasmic reticulum membrane organization10/795813/187231.28e-024.61e-0210
Page: 1 2 3 

check button Enriched KEGG pathways.
Pathway IDTissueDisease StageDescriptionGene RatioBg Ratiopvaluep.adjustqvalueCount
Page: 1 

Top

Cell-cell communication analysis

check buttonIdentification of potential cell-cell interactions between two cell types and their ligand-receptor pairs for different disease states
LigandReceptorLRpairPathwayTissueDisease Stage
Page: 1 

Top

Single-cell gene regulatory network inference analysis

check buttonFind out the significant the regulons (TFs) and the target genes of each regulon across cell types for different disease states
TFCell TypeTissueDisease StageTarget GeneRSSRegulon Activity
∗The dot plots of a searched regulon are shown for all cell subpopulations in each disease state of each tissue based on the regulon specific score inferred using pySCENIC and by calculating the average expression.
Page: 1 

Top

Somatic mutation of malignant transformation related genes

check buttonAnnotation of somatic variants for genes involved in malignant transformation
Hugo SymbolVariant ClassVariant ClassificationdbSNP RSHGVScHGVSpHGVSp ShortSWISSPROTBIOTYPESIFTPolyPhenTumor Sample BarcodeTissueHistologySexAgeStageTherapy TypesDrugsOutcome
ATL2SNVMissense_Mutationc.1480N>Gp.Phe494Valp.F494VQ8NHH9protein_codingtolerated(0.08)benign(0.04)TCGA-A8-A09Z-01Breastbreast invasive carcinomaFemale>=65I/IIUnknownUnknownSD
ATL2SNVMissense_Mutationc.932N>Ap.Gly311Glup.G311EQ8NHH9protein_codingdeleterious(0)probably_damaging(0.998)TCGA-A8-A09Z-01Breastbreast invasive carcinomaFemale>=65I/IIUnknownUnknownSD
ATL2SNVMissense_Mutationrs760807574c.1659N>Cp.Leu553Phep.L553FQ8NHH9protein_codingtolerated(0.33)benign(0)TCGA-AC-A23H-01Breastbreast invasive carcinomaFemale>=65I/IIUnknownUnknownPD
ATL2SNVMissense_Mutationc.193N>Gp.Leu65Valp.L65VQ8NHH9protein_codingtolerated(0.36)benign(0.001)TCGA-AC-A23H-01Breastbreast invasive carcinomaFemale>=65I/IIUnknownUnknownPD
ATL2insertionIn_Frame_Insnovelc.516_517insAAGGGAAAAAAAAGGAAGCTATTTACATTTCTTGAGAGCp.Met172_Asp173insLysGlyLysLysArgLysLeuPheThrPheLeuGluSerp.M172_D173insKGKKRKLFTFLESQ8NHH9protein_codingTCGA-A8-A0A1-01Breastbreast invasive carcinomaFemale>=65I/IIHormone TherapytamoxiphenSD
ATL2insertionFrame_Shift_Insnovelc.1297_1298insGATTAGTCACTAAAAAACCp.Lys433ArgfsTer13p.K433Rfs*13Q8NHH9protein_codingTCGA-AR-A0U0-01Breastbreast invasive carcinomaFemale>=65I/IIUnknownUnknownSD
ATL2insertionFrame_Shift_Insnovelc.1297_1298insGATTAGTCACTAAAAAACCp.Lys433ArgfsTer13p.K433Rfs*13Q8NHH9protein_codingTCGA-AR-A0U2-01Breastbreast invasive carcinomaFemale<65III/IVHormone TherapytamoxiphenPD
ATL2SNVMissense_Mutationc.874N>Cp.Gly292Argp.G292RQ8NHH9protein_codingtolerated(0.14)benign(0.014)TCGA-EA-A1QT-01Cervixcervical & endocervical cancerFemale<65I/IIUnknownUnknownSD
ATL2SNVMissense_Mutationc.979N>Ap.Leu327Metp.L327MQ8NHH9protein_codingdeleterious(0.04)possibly_damaging(0.903)TCGA-AA-A010-01Colorectumcolon adenocarcinomaFemale<65I/IIChemotherapyfolinicCR
ATL2SNVMissense_Mutationc.1288N>Tp.Arg430Cysp.R430CQ8NHH9protein_codingtolerated(0.09)benign(0.031)TCGA-AZ-4315-01Colorectumcolon adenocarcinomaMale<65I/IIUnknownUnknownSD
Page: 1 2 3 4 5 6 

Top

Related drugs of malignant transformation related genes

check buttonIdentification of chemicals and drugs interact with genes involved in malignant transfromation
(DGIdb 4.0)
Entrez IDSymbolCategoryInteraction TypesDrug Claim NameDrug NamePMIDs
Page: 1