
|
|||||
|
 | |
| |
| |
| |
| |
| |
|
Gene: ATL1 |
Gene summary for ATL1 |
| Gene information | Species | Human | Gene symbol | ATL1 | Gene ID | 51062 |
| Gene name | atlastin GTPase 1 | |
| Gene Alias | AD-FSP | |
| Cytomap | 14q22.1 | |
| Gene Type | protein-coding | GO ID | GO:0000902 | UniProtAcc | A0A0S2Z5A2 |
Top |
Malignant transformation analysis |
| Identification of the aberrant gene expression in precancerous and cancerous lesions by comparing the gene expression of stem-like cells in diseased tissues with normal stem cells |
| Entrez ID | Symbol | Replicates | Species | Organ | Tissue | Adj P-value | Log2FC | Malignancy |
| 51062 | ATL1 | S015 | Human | Liver | HCC | 7.26e-11 | 6.60e-01 | 0.2375 |
| 51062 | ATL1 | S016 | Human | Liver | HCC | 6.69e-17 | 7.16e-01 | 0.2243 |
| 51062 | ATL1 | PTC06 | Human | Thyroid | PTC | 1.10e-05 | 1.43e-01 | 0.2057 |
| 51062 | ATL1 | ATC13 | Human | Thyroid | ATC | 1.90e-14 | 3.10e-01 | 0.34 |
| 51062 | ATL1 | ATC2 | Human | Thyroid | ATC | 3.38e-08 | 8.68e-01 | 0.34 |
| 51062 | ATL1 | ATC5 | Human | Thyroid | ATC | 2.82e-21 | 3.53e-01 | 0.34 |
| Page: 1 |
| Tissue | Expression Dynamics | Abbreviation |
| Liver |  | HCC: Hepatocellular carcinoma |
| NAFLD: Non-alcoholic fatty liver disease | ||
| Thyroid | 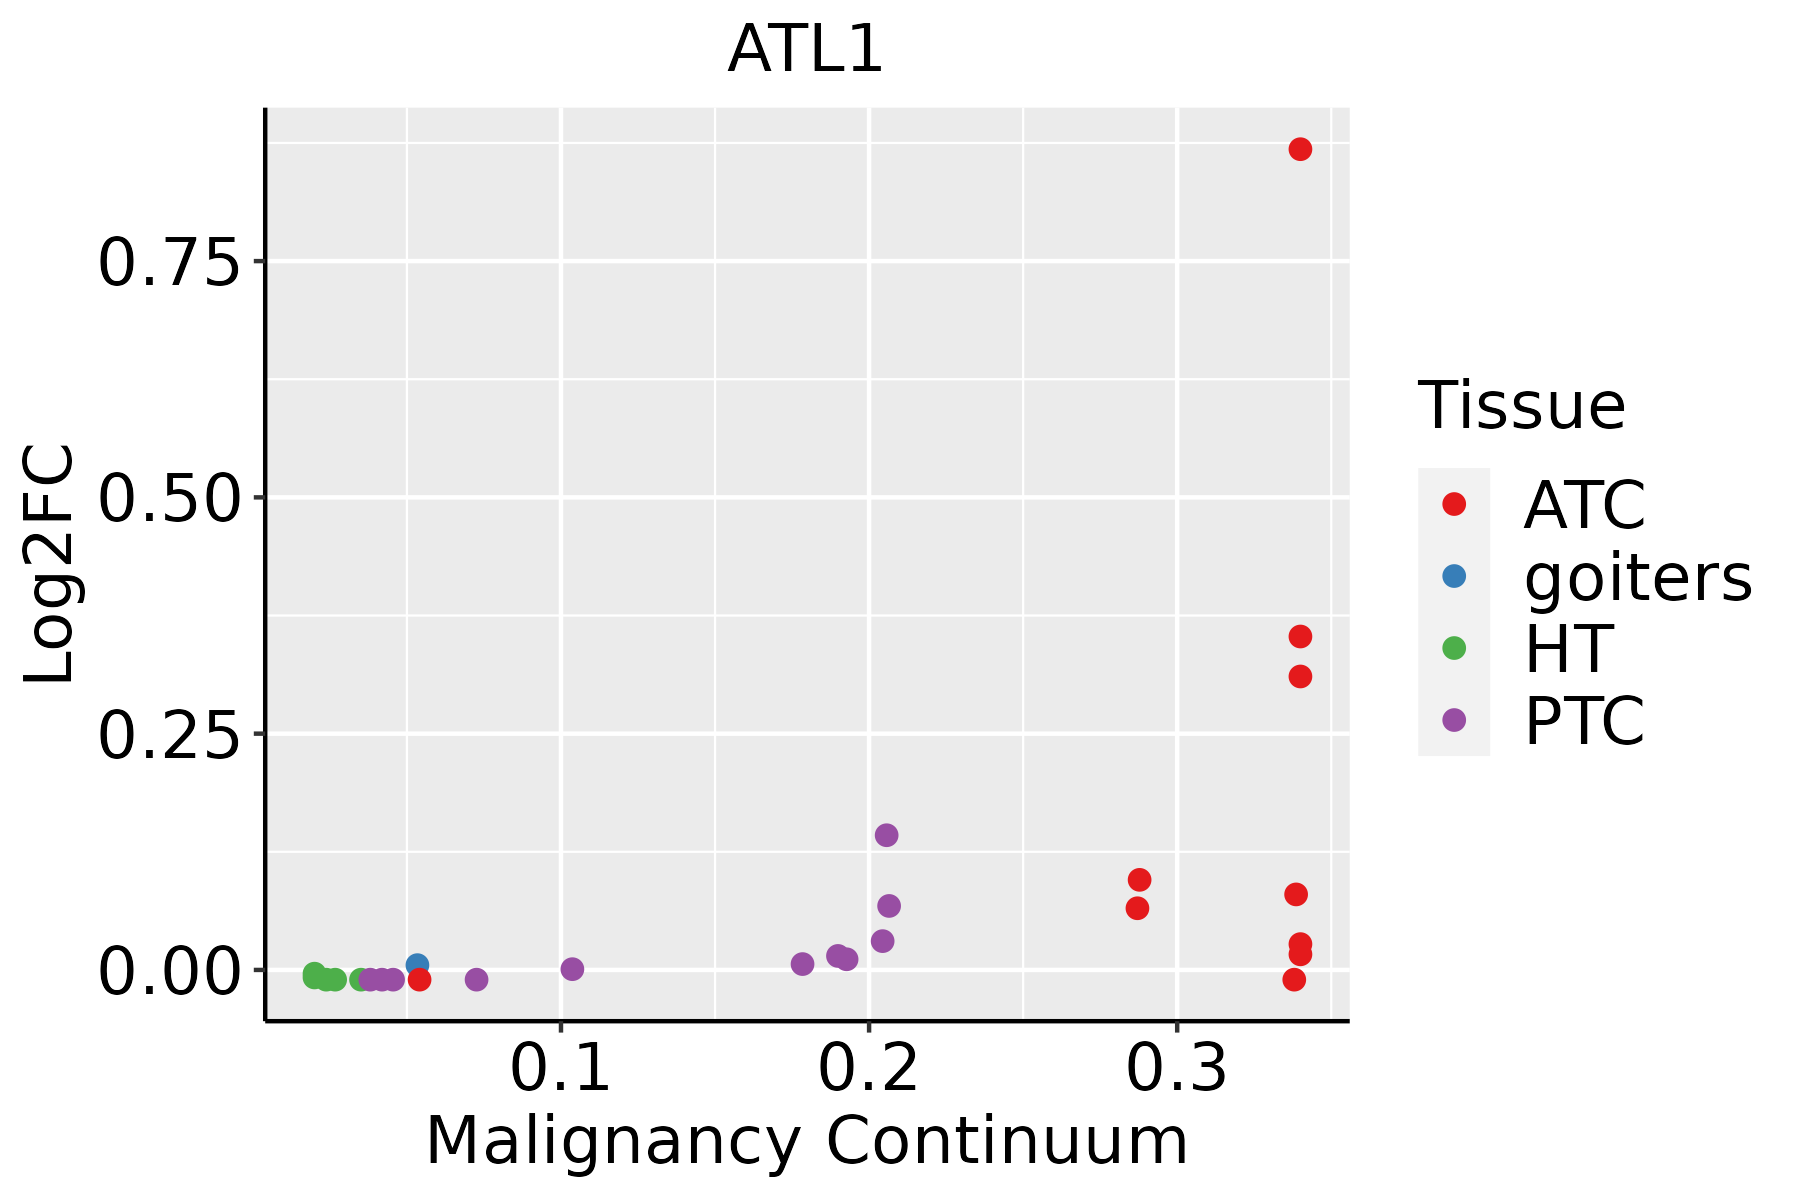 | ATC: Anaplastic thyroid cancer |
| HT: Hashimoto's thyroiditis | ||
| PTC: Papillary thyroid cancer |
| ∗log2FC in expression of this searched gene in stem-like cells from each diseased tissue sample relative to stem-like cells in normal samples in each tissue plotted against the malignancy continuum. Samples are colored based on if they are from different disease stage. |
Top |
Malignant transformation related pathway analysis |
| Find out the enriched GO biological processes and KEGG pathways involved in transition from healthy to precancer to cancer |
| Tissue | Disease Stage | Enriched GO biological Processes |
| Colorectum | AD |  |
| Colorectum | SER |  |
| Colorectum | MSS |  |
| Colorectum | MSI-H |  |
| Colorectum | FAP |  |
| ∗Top 15 enriched GO BP terms are showed in the bar plot of each disease state in each tissue. Each row represents a significant GO biological process which is colored according to the -log10(p.adjust). |
| Page: 1 2 3 4 5 6 7 8 9 |
| GO ID | Tissue | Disease Stage | Description | Gene Ratio | Bg Ratio | pvalue | p.adjust | Count |
| GO:0009896 | Colorectum | AD | positive regulation of catabolic process | 180/3918 | 492/18723 | 4.33e-16 | 1.94e-13 | 180 |
| GO:1903311 | Colorectum | AD | regulation of mRNA metabolic process | 117/3918 | 288/18723 | 1.69e-14 | 4.23e-12 | 117 |
| GO:0031331 | Colorectum | AD | positive regulation of cellular catabolic process | 156/3918 | 427/18723 | 4.68e-14 | 1.05e-11 | 156 |
| GO:0006401 | Colorectum | AD | RNA catabolic process | 102/3918 | 278/18723 | 8.64e-10 | 6.76e-08 | 102 |
| GO:0044270 | Colorectum | AD | cellular nitrogen compound catabolic process | 147/3918 | 451/18723 | 3.35e-09 | 2.23e-07 | 147 |
| GO:0046700 | Colorectum | AD | heterocycle catabolic process | 145/3918 | 445/18723 | 4.37e-09 | 2.84e-07 | 145 |
| GO:0006402 | Colorectum | AD | mRNA catabolic process | 87/3918 | 232/18723 | 4.40e-09 | 2.84e-07 | 87 |
| GO:0034655 | Colorectum | AD | nucleobase-containing compound catabolic process | 133/3918 | 407/18723 | 1.56e-08 | 9.12e-07 | 133 |
| GO:0019439 | Colorectum | AD | aromatic compound catabolic process | 146/3918 | 467/18723 | 7.48e-08 | 3.84e-06 | 146 |
| GO:1901361 | Colorectum | AD | organic cyclic compound catabolic process | 153/3918 | 495/18723 | 8.23e-08 | 4.18e-06 | 153 |
| GO:0061013 | Colorectum | AD | regulation of mRNA catabolic process | 64/3918 | 166/18723 | 1.44e-07 | 6.59e-06 | 64 |
| GO:0043487 | Colorectum | AD | regulation of RNA stability | 63/3918 | 170/18723 | 9.17e-07 | 3.12e-05 | 63 |
| GO:0006417 | Colorectum | AD | regulation of translation | 141/3918 | 468/18723 | 1.32e-06 | 4.22e-05 | 141 |
| GO:0043488 | Colorectum | AD | regulation of mRNA stability | 59/3918 | 158/18723 | 1.50e-06 | 4.66e-05 | 59 |
| GO:1903313 | Colorectum | AD | positive regulation of mRNA metabolic process | 44/3918 | 118/18723 | 3.20e-05 | 5.87e-04 | 44 |
| GO:0000956 | Colorectum | AD | nuclear-transcribed mRNA catabolic process | 40/3918 | 112/18723 | 2.11e-04 | 2.79e-03 | 40 |
| GO:0061014 | Colorectum | AD | positive regulation of mRNA catabolic process | 32/3918 | 87/18723 | 4.81e-04 | 5.27e-03 | 32 |
| GO:0061157 | Colorectum | AD | mRNA destabilization | 30/3918 | 84/18723 | 1.24e-03 | 1.09e-02 | 30 |
| GO:0033962 | Colorectum | AD | P-body assembly | 11/3918 | 21/18723 | 1.43e-03 | 1.22e-02 | 11 |
| GO:0050779 | Colorectum | AD | RNA destabilization | 30/3918 | 88/18723 | 2.83e-03 | 2.12e-02 | 30 |
| Page: 1 2 3 4 5 6 7 8 |
| Pathway ID | Tissue | Disease Stage | Description | Gene Ratio | Bg Ratio | pvalue | p.adjust | qvalue | Count |
| Page: 1 |
Top |
Cell-cell communication analysis |
| Identification of potential cell-cell interactions between two cell types and their ligand-receptor pairs for different disease states |
| Ligand | Receptor | LRpair | Pathway | Tissue | Disease Stage |
| Page: 1 |
Top |
Single-cell gene regulatory network inference analysis |
| Find out the significant the regulons (TFs) and the target genes of each regulon across cell types for different disease states |
| TF | Cell Type | Tissue | Disease Stage | Target Gene | RSS | Regulon Activity |
| ∗The dot plots of a searched regulon are shown for all cell subpopulations in each disease state of each tissue based on the regulon specific score inferred using pySCENIC and by calculating the average expression. |
| Page: 1 |
Top |
Somatic mutation of malignant transformation related genes |
| Annotation of somatic variants for genes involved in malignant transformation |
| Hugo Symbol | Variant Class | Variant Classification | dbSNP RS | HGVSc | HGVSp | HGVSp Short | SWISSPROT | BIOTYPE | SIFT | PolyPhen | Tumor Sample Barcode | Tissue | Histology | Sex | Age | Stage | Therapy Types | Drugs | Outcome |
| ATL1 | SNV | Missense_Mutation | rs763902321 | c.58G>A | p.Glu20Lys | p.E20K | Q8WXF7 | protein_coding | tolerated(0.2) | benign(0.023) | TCGA-5L-AAT1-01 | Breast | breast invasive carcinoma | Female | <65 | III/IV | Hormone Therapy | letrozol | SD |
| ATL1 | SNV | Missense_Mutation | novel | c.590N>A | p.Gly197Asp | p.G197D | Q8WXF7 | protein_coding | deleterious(0) | probably_damaging(0.997) | TCGA-AN-A0AK-01 | Breast | breast invasive carcinoma | Female | >=65 | I/II | Unknown | Unknown | SD |
| ATL1 | SNV | Missense_Mutation | rs119476046 | c.715N>T | p.Arg239Cys | p.R239C | Q8WXF7 | protein_coding | deleterious(0) | benign(0.286) | TCGA-AN-A0AK-01 | Breast | breast invasive carcinoma | Female | >=65 | I/II | Unknown | Unknown | SD |
| ATL1 | SNV | Missense_Mutation | novel | c.1608N>G | p.His536Gln | p.H536Q | Q8WXF7 | protein_coding | tolerated_low_confidence(0.55) | benign(0.001) | TCGA-2W-A8YY-01 | Cervix | cervical & endocervical cancer | Female | <65 | I/II | Chemotherapy | cisplatin | CR |
| ATL1 | SNV | Missense_Mutation | c.1309G>A | p.Asp437Asn | p.D437N | Q8WXF7 | protein_coding | tolerated(0.26) | benign(0.006) | TCGA-IR-A3LH-01 | Cervix | cervical & endocervical cancer | Female | <65 | I/II | Chemotherapy | cisplatin | CR | |
| ATL1 | SNV | Missense_Mutation | novel | c.1282N>A | p.Leu428Ile | p.L428I | Q8WXF7 | protein_coding | tolerated(0.29) | benign(0.01) | TCGA-VS-A9V5-01 | Cervix | cervical & endocervical cancer | Female | <65 | I/II | Chemotherapy | carboplatin | PD |
| ATL1 | SNV | Missense_Mutation | c.925N>G | p.Ser309Gly | p.S309G | Q8WXF7 | protein_coding | deleterious(0) | benign(0.025) | TCGA-4T-AA8H-01 | Colorectum | colon adenocarcinoma | Female | <65 | I/II | Unknown | Unknown | SD | |
| ATL1 | SNV | Missense_Mutation | c.1047G>T | p.Gln349His | p.Q349H | Q8WXF7 | protein_coding | tolerated(0.08) | possibly_damaging(0.772) | TCGA-A6-3809-01 | Colorectum | colon adenocarcinoma | Female | >=65 | I/II | Unknown | Unknown | SD | |
| ATL1 | SNV | Missense_Mutation | c.283N>A | p.Glu95Lys | p.E95K | Q8WXF7 | protein_coding | tolerated(0.78) | benign(0.017) | TCGA-AA-3510-01 | Colorectum | colon adenocarcinoma | Male | >=65 | I/II | Unknown | Unknown | SD | |
| ATL1 | SNV | Missense_Mutation | c.927C>A | p.Ser309Arg | p.S309R | Q8WXF7 | protein_coding | tolerated(0.07) | benign(0.005) | TCGA-AA-3715-01 | Colorectum | colon adenocarcinoma | Male | >=65 | I/II | Unknown | Unknown | PD |
| Page: 1 2 3 4 5 6 |
Top |
Related drugs of malignant transformation related genes |
| Identification of chemicals and drugs interact with genes involved in malignant transfromation |
| (DGIdb 4.0) |
| Entrez ID | Symbol | Category | Interaction Types | Drug Claim Name | Drug Name | PMIDs |
| Page: 1 |

Copyright 2023-Present -The University of Texas Health Science Center at Houston |