
|
|||||
|
 | |
| |
| |
| |
| |
| |
|
Gene: ATG9A |
Gene summary for ATG9A |
| Gene information | Species | Human | Gene symbol | ATG9A | Gene ID | 79065 |
| Gene name | autophagy related 9A | |
| Gene Alias | APG9L1 | |
| Cytomap | 2q35 | |
| Gene Type | protein-coding | GO ID | GO:0000045 | UniProtAcc | A0A024R438 |
Top |
Malignant transformation analysis |
| Identification of the aberrant gene expression in precancerous and cancerous lesions by comparing the gene expression of stem-like cells in diseased tissues with normal stem cells |
| Entrez ID | Symbol | Replicates | Species | Organ | Tissue | Adj P-value | Log2FC | Malignancy |
| 79065 | ATG9A | LZE4T | Human | Esophagus | ESCC | 1.52e-03 | 1.41e-01 | 0.0811 |
| 79065 | ATG9A | LZE24T | Human | Esophagus | ESCC | 3.78e-08 | 2.84e-01 | 0.0596 |
| 79065 | ATG9A | P1T-E | Human | Esophagus | ESCC | 1.31e-02 | 2.08e-01 | 0.0875 |
| 79065 | ATG9A | P2T-E | Human | Esophagus | ESCC | 1.75e-15 | 2.59e-01 | 0.1177 |
| 79065 | ATG9A | P4T-E | Human | Esophagus | ESCC | 2.90e-09 | 1.45e-01 | 0.1323 |
| 79065 | ATG9A | P5T-E | Human | Esophagus | ESCC | 1.27e-04 | 7.84e-02 | 0.1327 |
| 79065 | ATG9A | P8T-E | Human | Esophagus | ESCC | 6.02e-15 | 1.81e-01 | 0.0889 |
| 79065 | ATG9A | P9T-E | Human | Esophagus | ESCC | 3.46e-08 | 1.89e-01 | 0.1131 |
| 79065 | ATG9A | P10T-E | Human | Esophagus | ESCC | 2.65e-17 | 2.06e-01 | 0.116 |
| 79065 | ATG9A | P11T-E | Human | Esophagus | ESCC | 1.08e-16 | 5.56e-01 | 0.1426 |
| 79065 | ATG9A | P12T-E | Human | Esophagus | ESCC | 2.45e-20 | 3.74e-01 | 0.1122 |
| 79065 | ATG9A | P15T-E | Human | Esophagus | ESCC | 2.43e-19 | 4.43e-01 | 0.1149 |
| 79065 | ATG9A | P16T-E | Human | Esophagus | ESCC | 5.45e-16 | 2.96e-01 | 0.1153 |
| 79065 | ATG9A | P17T-E | Human | Esophagus | ESCC | 1.48e-05 | 3.07e-01 | 0.1278 |
| 79065 | ATG9A | P19T-E | Human | Esophagus | ESCC | 2.35e-07 | 5.20e-01 | 0.1662 |
| 79065 | ATG9A | P20T-E | Human | Esophagus | ESCC | 3.18e-16 | 3.65e-01 | 0.1124 |
| 79065 | ATG9A | P21T-E | Human | Esophagus | ESCC | 6.74e-27 | 5.47e-01 | 0.1617 |
| 79065 | ATG9A | P22T-E | Human | Esophagus | ESCC | 6.16e-16 | 1.90e-01 | 0.1236 |
| 79065 | ATG9A | P23T-E | Human | Esophagus | ESCC | 2.29e-15 | 2.85e-01 | 0.108 |
| 79065 | ATG9A | P24T-E | Human | Esophagus | ESCC | 2.11e-13 | 2.83e-01 | 0.1287 |
| Page: 1 2 3 4 5 |
| Tissue | Expression Dynamics | Abbreviation |
| Esophagus |  | ESCC: Esophageal squamous cell carcinoma |
| HGIN: High-grade intraepithelial neoplasias | ||
| LGIN: Low-grade intraepithelial neoplasias | ||
| Liver | 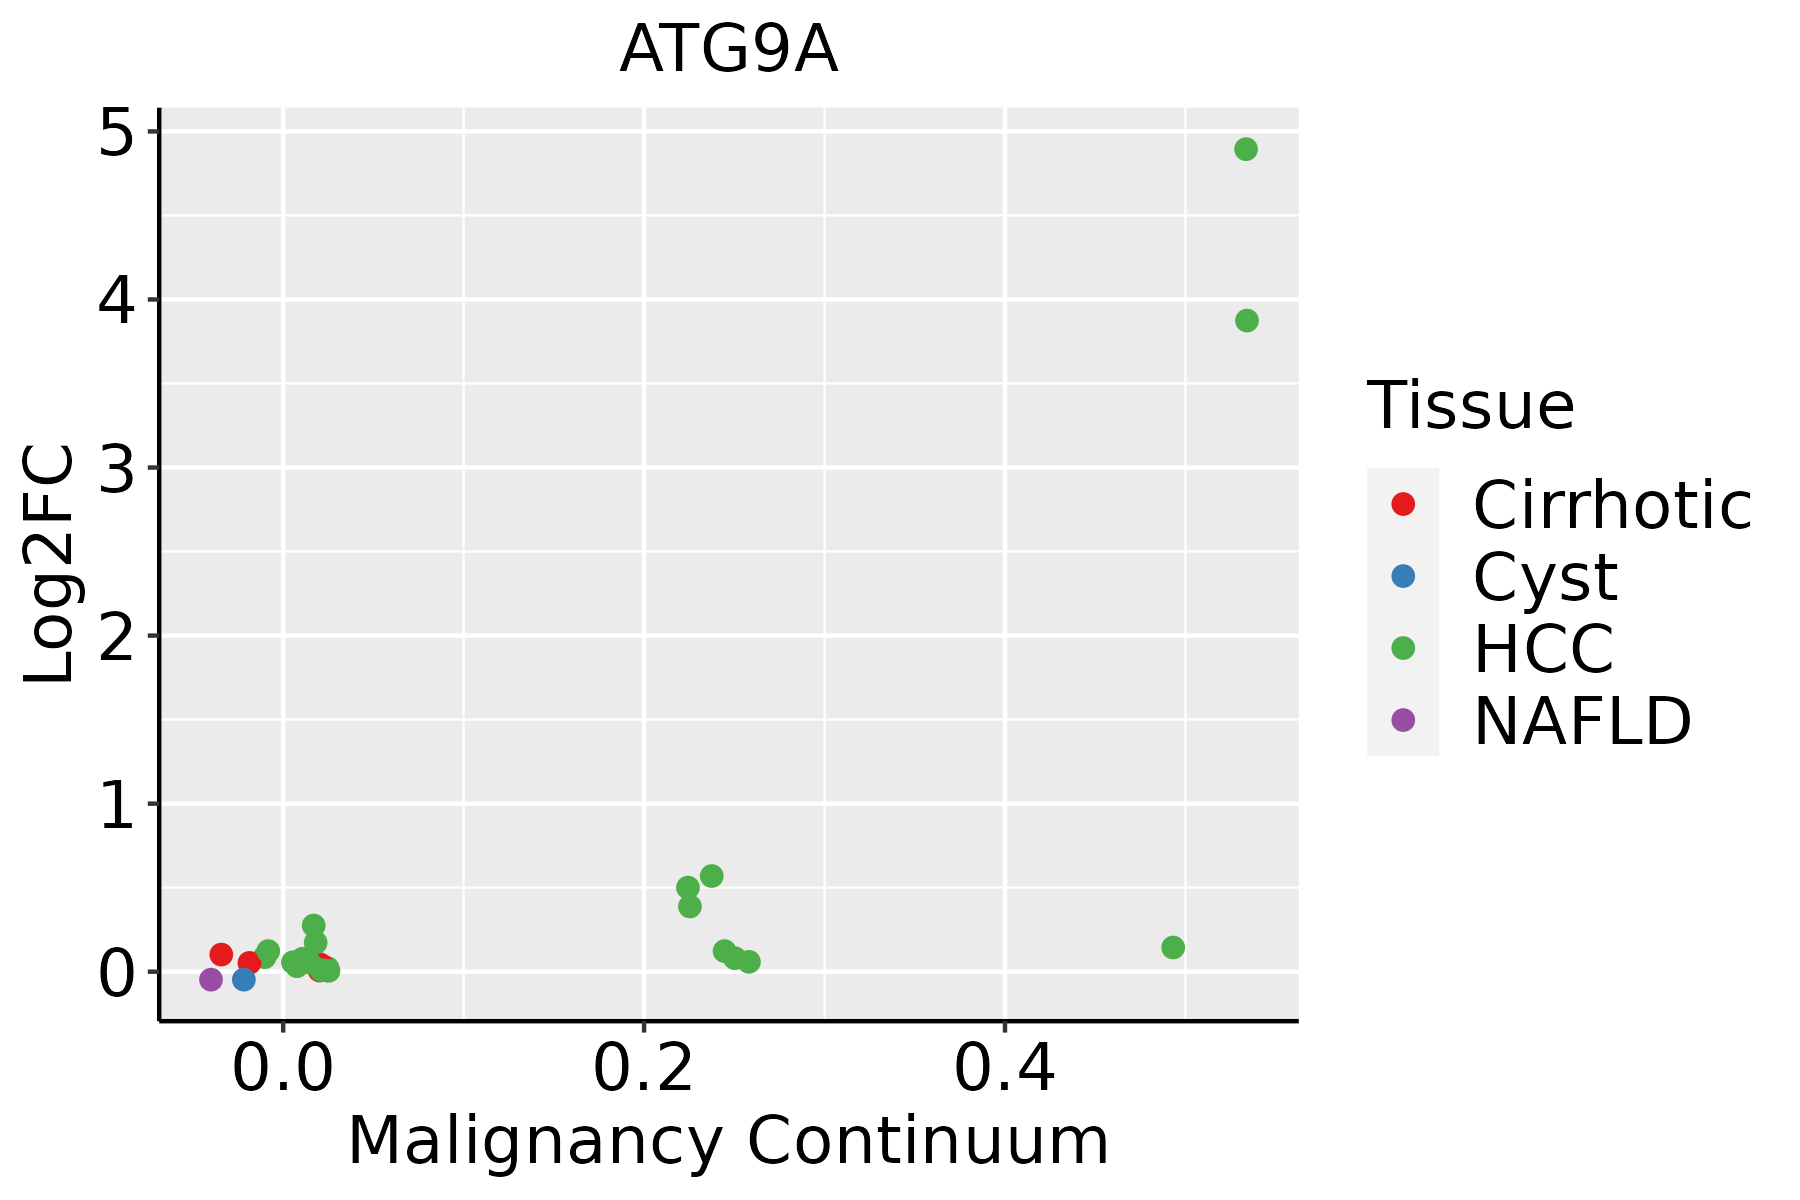 | HCC: Hepatocellular carcinoma |
| NAFLD: Non-alcoholic fatty liver disease | ||
| Oral Cavity | 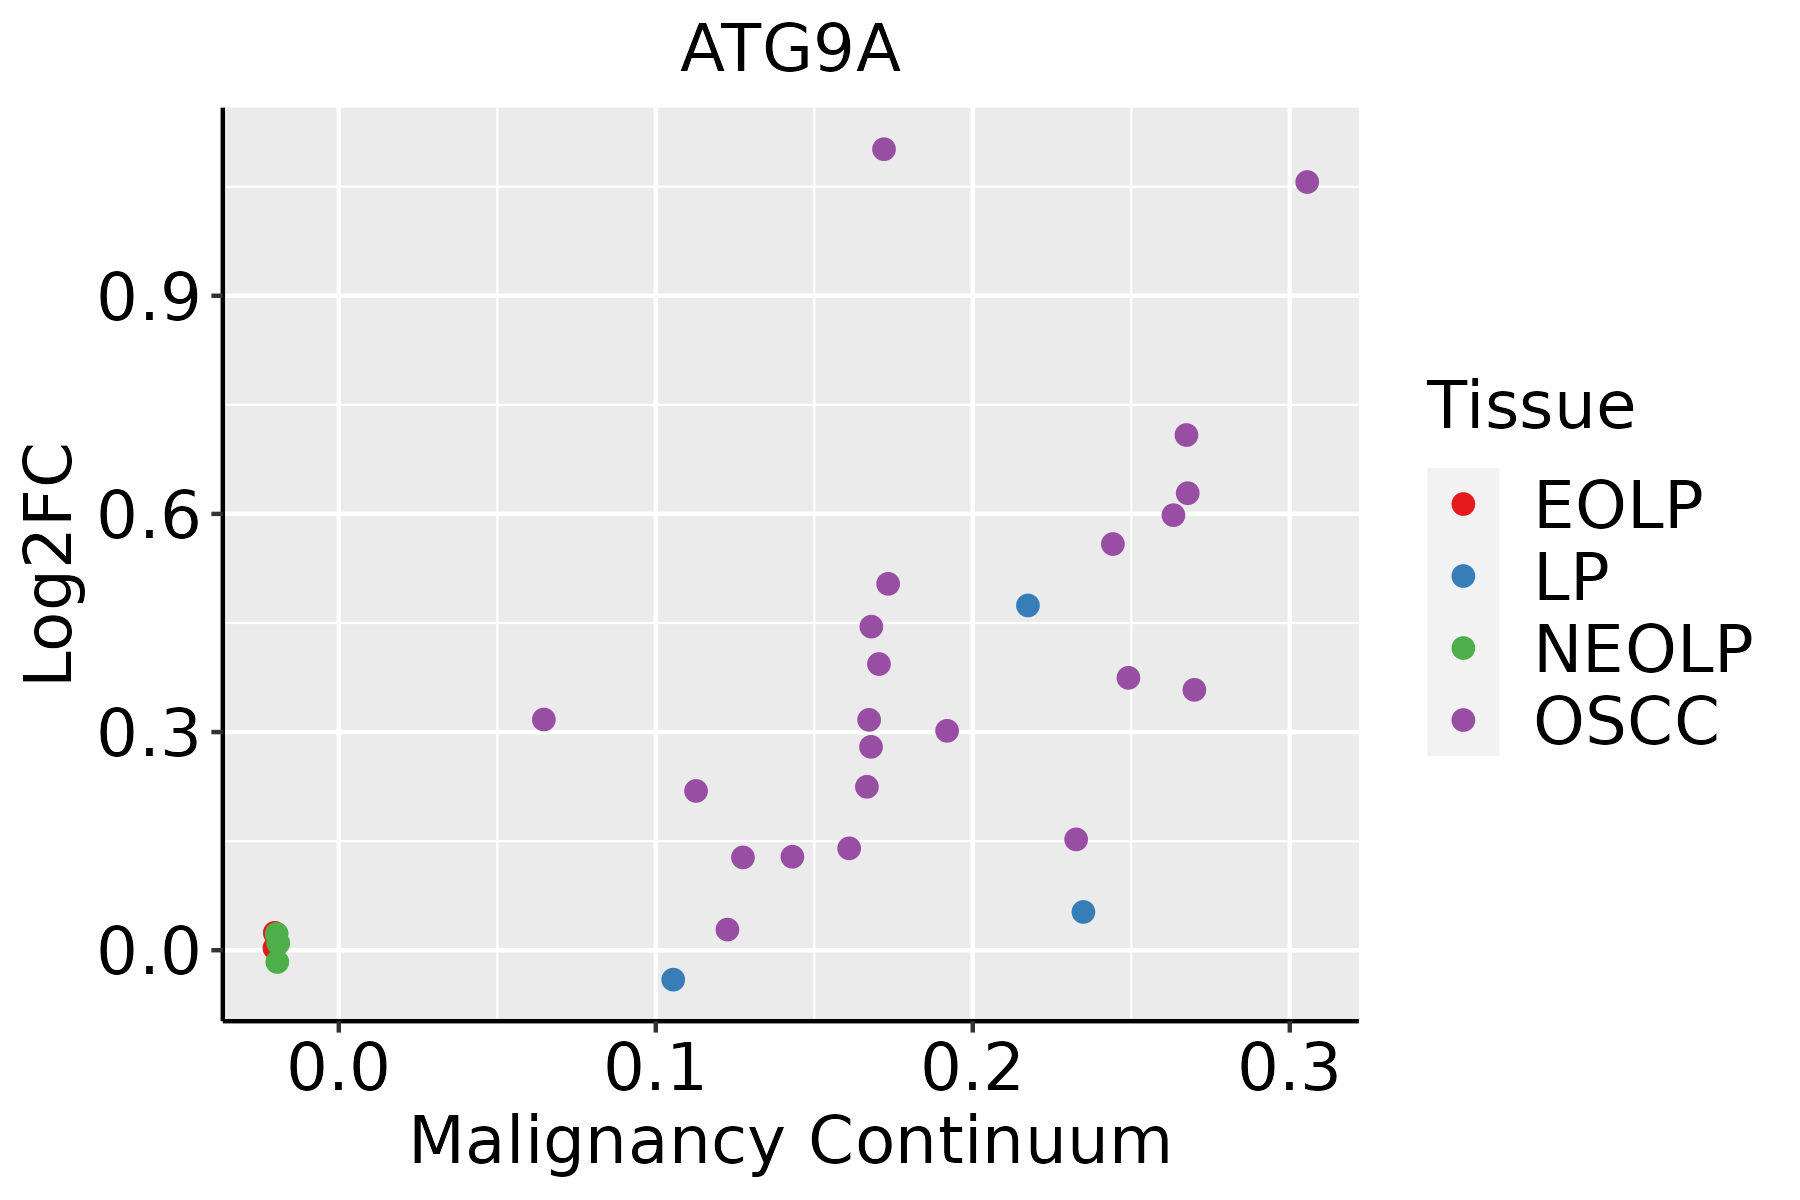 | EOLP: Erosive Oral lichen planus |
| LP: leukoplakia | ||
| NEOLP: Non-erosive oral lichen planus | ||
| OSCC: Oral squamous cell carcinoma | ||
| Skin | 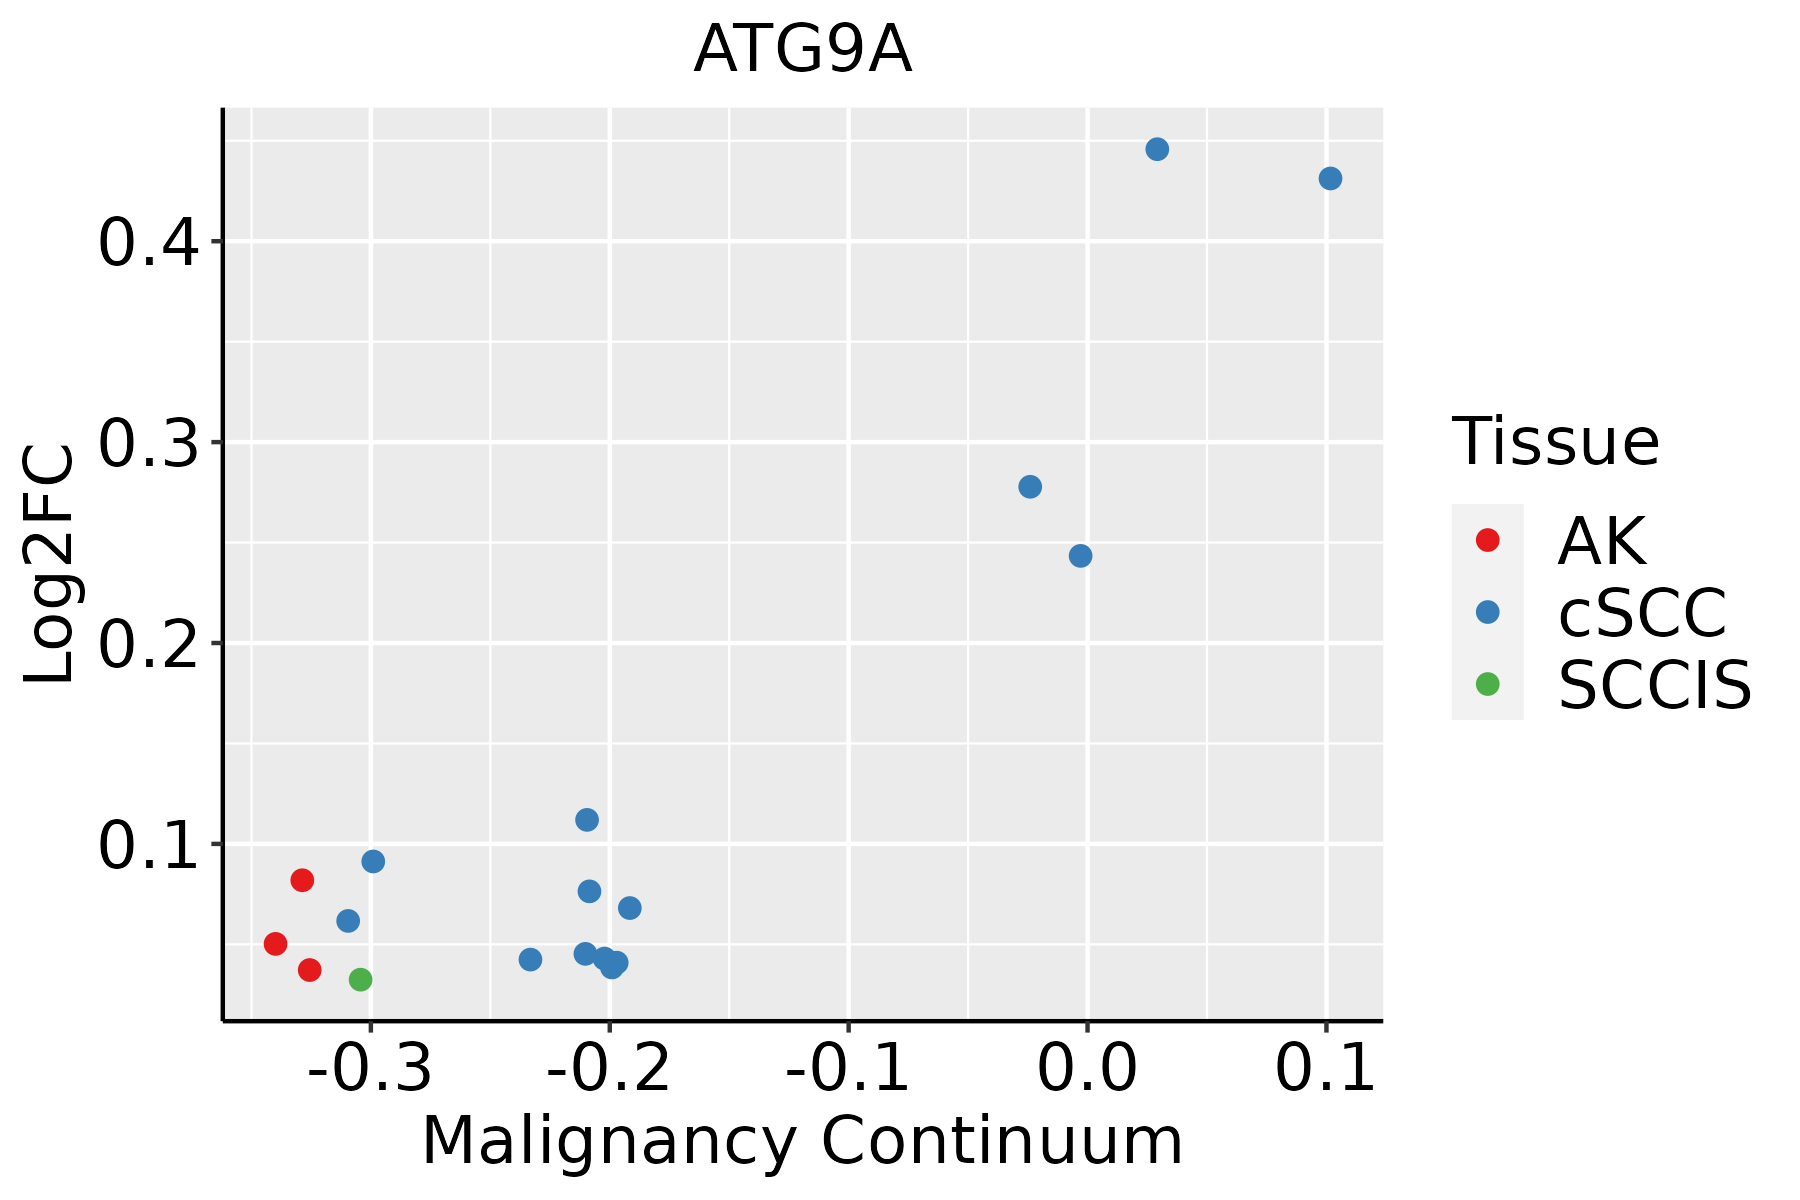 | AK: Actinic keratosis |
| cSCC: Cutaneous squamous cell carcinoma | ||
| SCCIS:squamous cell carcinoma in situ |
| ∗log2FC in expression of this searched gene in stem-like cells from each diseased tissue sample relative to stem-like cells in normal samples in each tissue plotted against the malignancy continuum. Samples are colored based on if they are from different disease stage. |
Top |
Malignant transformation related pathway analysis |
| Find out the enriched GO biological processes and KEGG pathways involved in transition from healthy to precancer to cancer |
| Tissue | Disease Stage | Enriched GO biological Processes |
| Colorectum | AD |  |
| Colorectum | SER |  |
| Colorectum | MSS |  |
| Colorectum | MSI-H |  |
| Colorectum | FAP |  |
| ∗Top 15 enriched GO BP terms are showed in the bar plot of each disease state in each tissue. Each row represents a significant GO biological process which is colored according to the -log10(p.adjust). |
| Page: 1 2 3 4 5 6 7 8 9 |
| GO ID | Tissue | Disease Stage | Description | Gene Ratio | Bg Ratio | pvalue | p.adjust | Count |
| GO:001623617 | Esophagus | ESCC | macroautophagy | 216/8552 | 291/18723 | 1.94e-23 | 4.57e-21 | 216 |
| GO:0022411111 | Esophagus | ESCC | cellular component disassembly | 305/8552 | 443/18723 | 1.94e-23 | 4.57e-21 | 305 |
| GO:190300816 | Esophagus | ESCC | organelle disassembly | 89/8552 | 114/18723 | 1.36e-12 | 5.80e-11 | 89 |
| GO:000703314 | Esophagus | ESCC | vacuole organization | 127/8552 | 180/18723 | 1.04e-11 | 3.85e-10 | 127 |
| GO:000042217 | Esophagus | ESCC | autophagy of mitochondrion | 63/8552 | 81/18723 | 3.41e-09 | 7.24e-08 | 63 |
| GO:006172617 | Esophagus | ESCC | mitochondrion disassembly | 63/8552 | 81/18723 | 3.41e-09 | 7.24e-08 | 63 |
| GO:190503712 | Esophagus | ESCC | autophagosome organization | 73/8552 | 103/18723 | 1.88e-07 | 2.93e-06 | 73 |
| GO:000004513 | Esophagus | ESCC | autophagosome assembly | 69/8552 | 99/18723 | 1.10e-06 | 1.38e-05 | 69 |
| GO:001623621 | Liver | HCC | macroautophagy | 204/7958 | 291/18723 | 8.66e-22 | 1.41e-19 | 204 |
| GO:002241112 | Liver | HCC | cellular component disassembly | 282/7958 | 443/18723 | 1.02e-19 | 1.38e-17 | 282 |
| GO:190300811 | Liver | HCC | organelle disassembly | 89/7958 | 114/18723 | 8.68e-15 | 5.73e-13 | 89 |
| GO:000042211 | Liver | HCC | autophagy of mitochondrion | 64/7958 | 81/18723 | 1.96e-11 | 7.72e-10 | 64 |
| GO:006172611 | Liver | HCC | mitochondrion disassembly | 64/7958 | 81/18723 | 1.96e-11 | 7.72e-10 | 64 |
| GO:000703311 | Liver | HCC | vacuole organization | 119/7958 | 180/18723 | 1.22e-10 | 4.25e-09 | 119 |
| GO:19050371 | Liver | HCC | autophagosome organization | 70/7958 | 103/18723 | 1.52e-07 | 2.82e-06 | 70 |
| GO:00000451 | Liver | HCC | autophagosome assembly | 67/7958 | 99/18723 | 3.56e-07 | 6.07e-06 | 67 |
| GO:0044804 | Liver | HCC | autophagy of nucleus | 12/7958 | 16/18723 | 8.74e-03 | 3.40e-02 | 12 |
| GO:0034497 | Liver | HCC | protein localization to phagophore assembly site | 10/7958 | 13/18723 | 1.28e-02 | 4.61e-02 | 10 |
| GO:002241119 | Oral cavity | OSCC | cellular component disassembly | 283/7305 | 443/18723 | 9.57e-27 | 3.37e-24 | 283 |
| GO:001623610 | Oral cavity | OSCC | macroautophagy | 192/7305 | 291/18723 | 7.01e-21 | 1.14e-18 | 192 |
| Page: 1 2 |
| Pathway ID | Tissue | Disease Stage | Description | Gene Ratio | Bg Ratio | pvalue | p.adjust | qvalue | Count |
| hsa0414010 | Esophagus | ESCC | Autophagy - animal | 101/4205 | 141/8465 | 7.60e-08 | 6.21e-07 | 3.18e-07 | 101 |
| hsa04137210 | Esophagus | ESCC | Mitophagy - animal | 54/4205 | 72/8465 | 9.33e-06 | 4.96e-05 | 2.54e-05 | 54 |
| hsa041362 | Esophagus | ESCC | Autophagy - other | 23/4205 | 32/8465 | 8.99e-03 | 2.14e-02 | 1.09e-02 | 23 |
| hsa0414015 | Esophagus | ESCC | Autophagy - animal | 101/4205 | 141/8465 | 7.60e-08 | 6.21e-07 | 3.18e-07 | 101 |
| hsa0413738 | Esophagus | ESCC | Mitophagy - animal | 54/4205 | 72/8465 | 9.33e-06 | 4.96e-05 | 2.54e-05 | 54 |
| hsa0413611 | Esophagus | ESCC | Autophagy - other | 23/4205 | 32/8465 | 8.99e-03 | 2.14e-02 | 1.09e-02 | 23 |
| hsa0414021 | Liver | HCC | Autophagy - animal | 99/4020 | 141/8465 | 3.08e-08 | 4.70e-07 | 2.61e-07 | 99 |
| hsa0413741 | Liver | HCC | Mitophagy - animal | 53/4020 | 72/8465 | 5.49e-06 | 4.59e-05 | 2.56e-05 | 53 |
| hsa0414031 | Liver | HCC | Autophagy - animal | 99/4020 | 141/8465 | 3.08e-08 | 4.70e-07 | 2.61e-07 | 99 |
| hsa0413751 | Liver | HCC | Mitophagy - animal | 53/4020 | 72/8465 | 5.49e-06 | 4.59e-05 | 2.56e-05 | 53 |
| hsa0413728 | Oral cavity | OSCC | Mitophagy - animal | 58/3704 | 72/8465 | 1.48e-10 | 2.07e-09 | 1.05e-09 | 58 |
| hsa041409 | Oral cavity | OSCC | Autophagy - animal | 94/3704 | 141/8465 | 2.73e-08 | 2.38e-07 | 1.21e-07 | 94 |
| hsa04137112 | Oral cavity | OSCC | Mitophagy - animal | 58/3704 | 72/8465 | 1.48e-10 | 2.07e-09 | 1.05e-09 | 58 |
| hsa0414014 | Oral cavity | OSCC | Autophagy - animal | 94/3704 | 141/8465 | 2.73e-08 | 2.38e-07 | 1.21e-07 | 94 |
| Page: 1 |
Top |
Cell-cell communication analysis |
| Identification of potential cell-cell interactions between two cell types and their ligand-receptor pairs for different disease states |
| Ligand | Receptor | LRpair | Pathway | Tissue | Disease Stage |
| Page: 1 |
Top |
Single-cell gene regulatory network inference analysis |
| Find out the significant the regulons (TFs) and the target genes of each regulon across cell types for different disease states |
| TF | Cell Type | Tissue | Disease Stage | Target Gene | RSS | Regulon Activity |
| ∗The dot plots of a searched regulon are shown for all cell subpopulations in each disease state of each tissue based on the regulon specific score inferred using pySCENIC and by calculating the average expression. |
| Page: 1 |
Top |
Somatic mutation of malignant transformation related genes |
| Annotation of somatic variants for genes involved in malignant transformation |
| Hugo Symbol | Variant Class | Variant Classification | dbSNP RS | HGVSc | HGVSp | HGVSp Short | SWISSPROT | BIOTYPE | SIFT | PolyPhen | Tumor Sample Barcode | Tissue | Histology | Sex | Age | Stage | Therapy Types | Drugs | Outcome |
| ATG9A | SNV | Missense_Mutation | c.851N>G | p.Gln284Arg | p.Q284R | Q7Z3C6 | protein_coding | tolerated(0.44) | benign(0.046) | TCGA-AO-A128-01 | Breast | breast invasive carcinoma | Female | <65 | I/II | Chemotherapy | doxorubicin | SD | |
| ATG9A | SNV | Missense_Mutation | c.1501N>C | p.Ile501Leu | p.I501L | Q7Z3C6 | protein_coding | tolerated(0.15) | possibly_damaging(0.465) | TCGA-GM-A2DH-01 | Breast | breast invasive carcinoma | Female | <65 | I/II | Chemotherapy | taxol | CR | |
| ATG9A | SNV | Missense_Mutation | novel | c.1792N>A | p.Leu598Met | p.L598M | Q7Z3C6 | protein_coding | tolerated(0.12) | benign(0.048) | TCGA-GM-A4E0-01 | Breast | breast invasive carcinoma | Female | >=65 | III/IV | Chemotherapy | xeloda | CR |
| ATG9A | insertion | Nonsense_Mutation | novel | c.1091_1092insAAAAAAAGG | p.Tyr364delinsTer | p.Y364delins* | Q7Z3C6 | protein_coding | TCGA-A8-A07J-01 | Breast | breast invasive carcinoma | Female | <65 | I/II | Chemotherapy | 5-fluorouracil | CR | ||
| ATG9A | deletion | Frame_Shift_Del | novel | c.2420delN | p.Gly807GlufsTer37 | p.G807Efs*37 | Q7Z3C6 | protein_coding | TCGA-EW-A2FV-01 | Breast | breast invasive carcinoma | Female | <65 | III/IV | Chemotherapy | docetaxel | SD | ||
| ATG9A | SNV | Missense_Mutation | novel | c.1022G>A | p.Arg341His | p.R341H | Q7Z3C6 | protein_coding | deleterious(0) | probably_damaging(0.922) | TCGA-2W-A8YY-01 | Cervix | cervical & endocervical cancer | Female | <65 | I/II | Chemotherapy | cisplatin | CR |
| ATG9A | SNV | Missense_Mutation | c.1883N>T | p.Ser628Leu | p.S628L | Q7Z3C6 | protein_coding | tolerated(0.18) | benign(0) | TCGA-EK-A2RJ-01 | Cervix | cervical & endocervical cancer | Female | <65 | I/II | Unknown | Unknown | SD | |
| ATG9A | SNV | Missense_Mutation | novel | c.547G>A | p.Val183Met | p.V183M | Q7Z3C6 | protein_coding | deleterious(0) | possibly_damaging(0.855) | TCGA-IR-A3LL-01 | Cervix | cervical & endocervical cancer | Female | <65 | I/II | Chemotherapy | cisplatin | CR |
| ATG9A | SNV | Missense_Mutation | c.1384C>T | p.Arg462Trp | p.R462W | Q7Z3C6 | protein_coding | deleterious(0) | probably_damaging(0.996) | TCGA-Q1-A5R2-01 | Cervix | cervical & endocervical cancer | Female | <65 | I/II | Chemotherapy | cisplatin | PR | |
| ATG9A | SNV | Missense_Mutation | c.659T>C | p.Val220Ala | p.V220A | Q7Z3C6 | protein_coding | deleterious(0) | benign(0.14) | TCGA-AA-3815-01 | Colorectum | colon adenocarcinoma | Female | >=65 | I/II | Unknown | Unknown | SD |
| Page: 1 2 3 4 5 6 7 8 |
Top |
Related drugs of malignant transformation related genes |
| Identification of chemicals and drugs interact with genes involved in malignant transfromation |
| (DGIdb 4.0) |
| Entrez ID | Symbol | Category | Interaction Types | Drug Claim Name | Drug Name | PMIDs |
| Page: 1 |

Copyright 2023-Present -The University of Texas Health Science Center at Houston |