
|
|||||
|
 | |
| |
| |
| |
| |
| |
|
Gene: ATG4D |
Gene summary for ATG4D |
| Gene information | Species | Human | Gene symbol | ATG4D | Gene ID | 84971 |
| Gene name | autophagy related 4D cysteine peptidase | |
| Gene Alias | APG4-D | |
| Cytomap | 19p13.2 | |
| Gene Type | protein-coding | GO ID | GO:0006508 | UniProtAcc | B4DGM8 |
Top |
Malignant transformation analysis |
| Identification of the aberrant gene expression in precancerous and cancerous lesions by comparing the gene expression of stem-like cells in diseased tissues with normal stem cells |
| Entrez ID | Symbol | Replicates | Species | Organ | Tissue | Adj P-value | Log2FC | Malignancy |
| 84971 | ATG4D | LZE20T | Human | Esophagus | ESCC | 4.60e-03 | 1.60e-01 | 0.0662 |
| 84971 | ATG4D | LZE22T | Human | Esophagus | ESCC | 2.39e-04 | 5.01e-01 | 0.068 |
| 84971 | ATG4D | LZE24T | Human | Esophagus | ESCC | 1.52e-16 | 4.47e-01 | 0.0596 |
| 84971 | ATG4D | LZE21T | Human | Esophagus | ESCC | 7.50e-05 | 3.07e-01 | 0.0655 |
| 84971 | ATG4D | P1T-E | Human | Esophagus | ESCC | 3.30e-13 | 6.33e-01 | 0.0875 |
| 84971 | ATG4D | P2T-E | Human | Esophagus | ESCC | 9.88e-22 | 3.25e-01 | 0.1177 |
| 84971 | ATG4D | P4T-E | Human | Esophagus | ESCC | 1.44e-23 | 5.83e-01 | 0.1323 |
| 84971 | ATG4D | P5T-E | Human | Esophagus | ESCC | 3.08e-21 | 4.06e-01 | 0.1327 |
| 84971 | ATG4D | P8T-E | Human | Esophagus | ESCC | 1.95e-21 | 4.22e-01 | 0.0889 |
| 84971 | ATG4D | P9T-E | Human | Esophagus | ESCC | 8.82e-23 | 5.85e-01 | 0.1131 |
| 84971 | ATG4D | P10T-E | Human | Esophagus | ESCC | 2.90e-34 | 5.98e-01 | 0.116 |
| 84971 | ATG4D | P11T-E | Human | Esophagus | ESCC | 5.00e-08 | 3.78e-01 | 0.1426 |
| 84971 | ATG4D | P12T-E | Human | Esophagus | ESCC | 3.10e-24 | 5.72e-01 | 0.1122 |
| 84971 | ATG4D | P15T-E | Human | Esophagus | ESCC | 1.55e-31 | 6.65e-01 | 0.1149 |
| 84971 | ATG4D | P16T-E | Human | Esophagus | ESCC | 2.28e-15 | 3.01e-01 | 0.1153 |
| 84971 | ATG4D | P17T-E | Human | Esophagus | ESCC | 1.08e-06 | 3.50e-01 | 0.1278 |
| 84971 | ATG4D | P19T-E | Human | Esophagus | ESCC | 6.41e-03 | 2.13e-01 | 0.1662 |
| 84971 | ATG4D | P20T-E | Human | Esophagus | ESCC | 1.45e-21 | 5.48e-01 | 0.1124 |
| 84971 | ATG4D | P21T-E | Human | Esophagus | ESCC | 2.55e-25 | 4.35e-01 | 0.1617 |
| 84971 | ATG4D | P22T-E | Human | Esophagus | ESCC | 2.18e-24 | 3.31e-01 | 0.1236 |
| Page: 1 2 3 4 |
| Tissue | Expression Dynamics | Abbreviation |
| Esophagus | 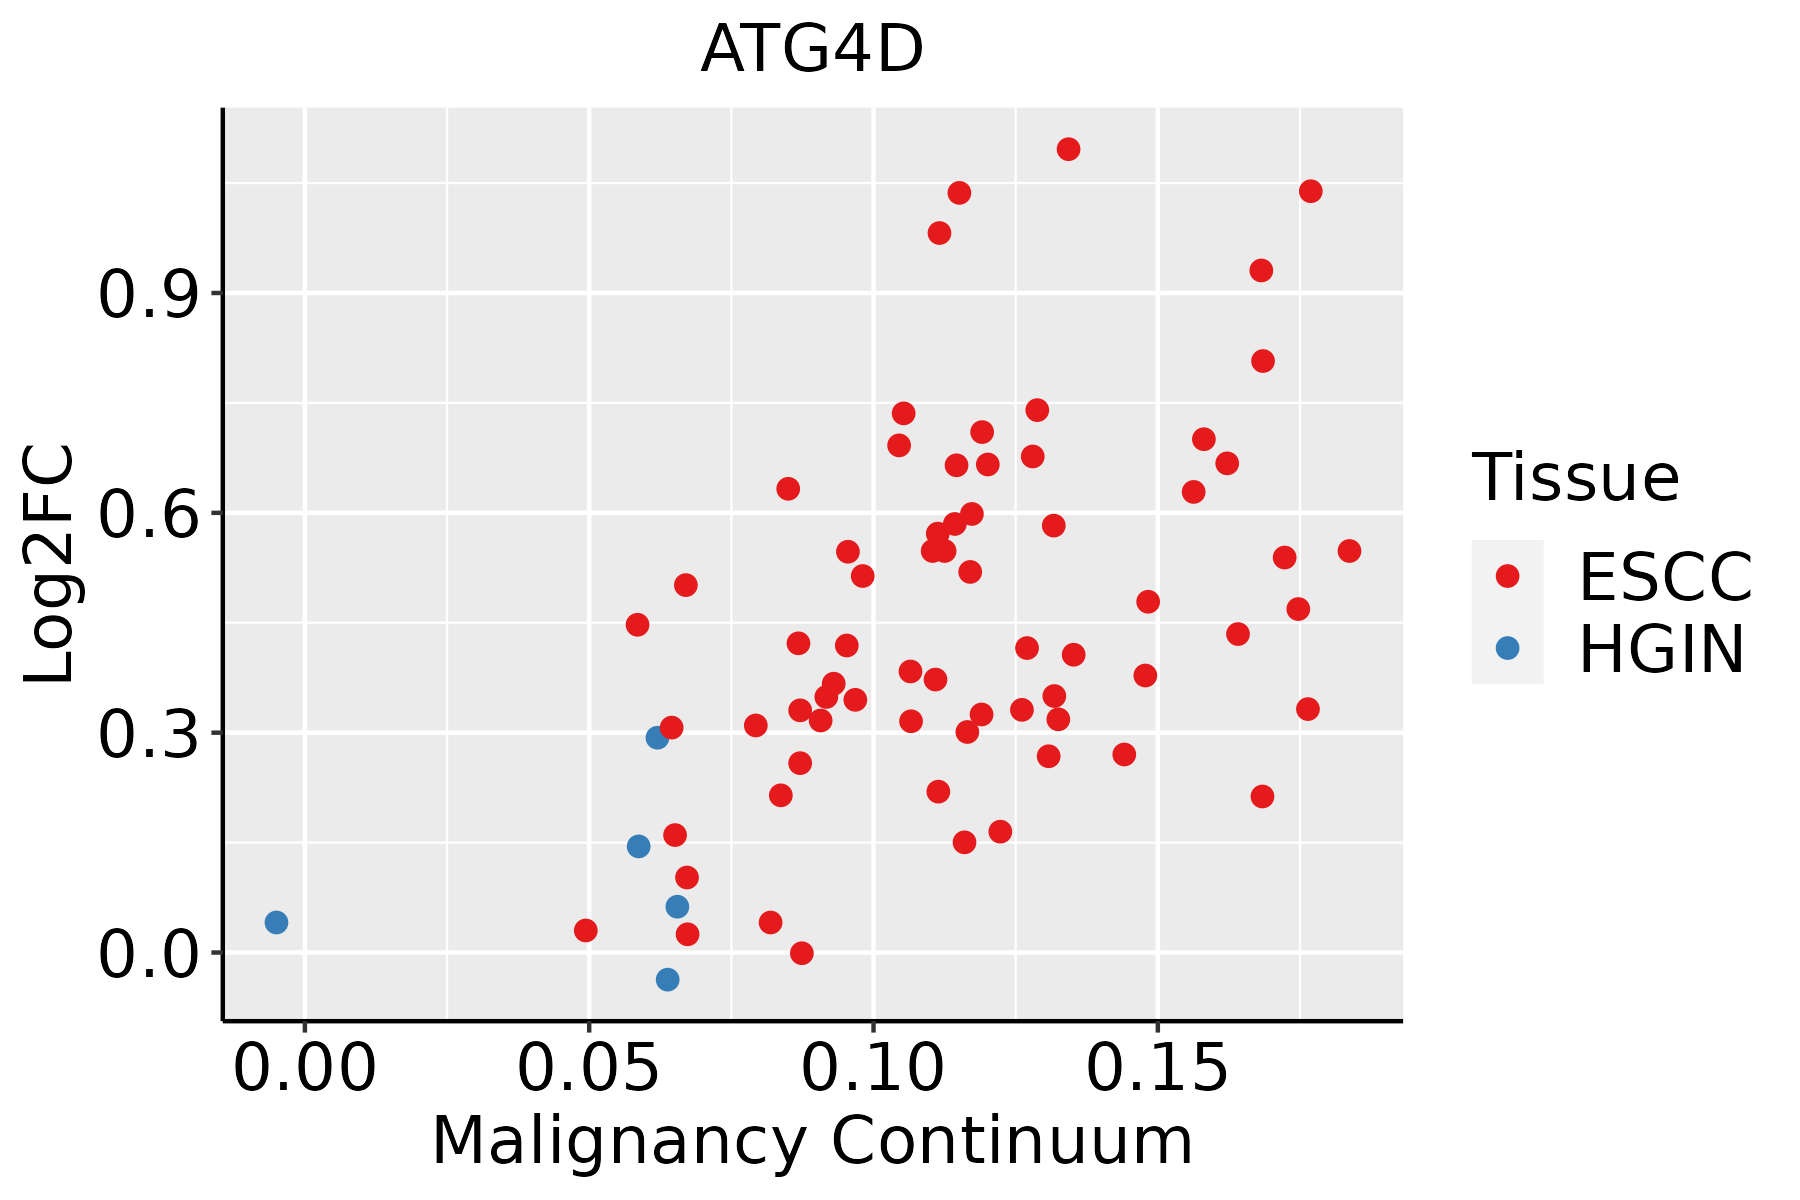 | ESCC: Esophageal squamous cell carcinoma |
| HGIN: High-grade intraepithelial neoplasias | ||
| LGIN: Low-grade intraepithelial neoplasias | ||
| Oral Cavity | 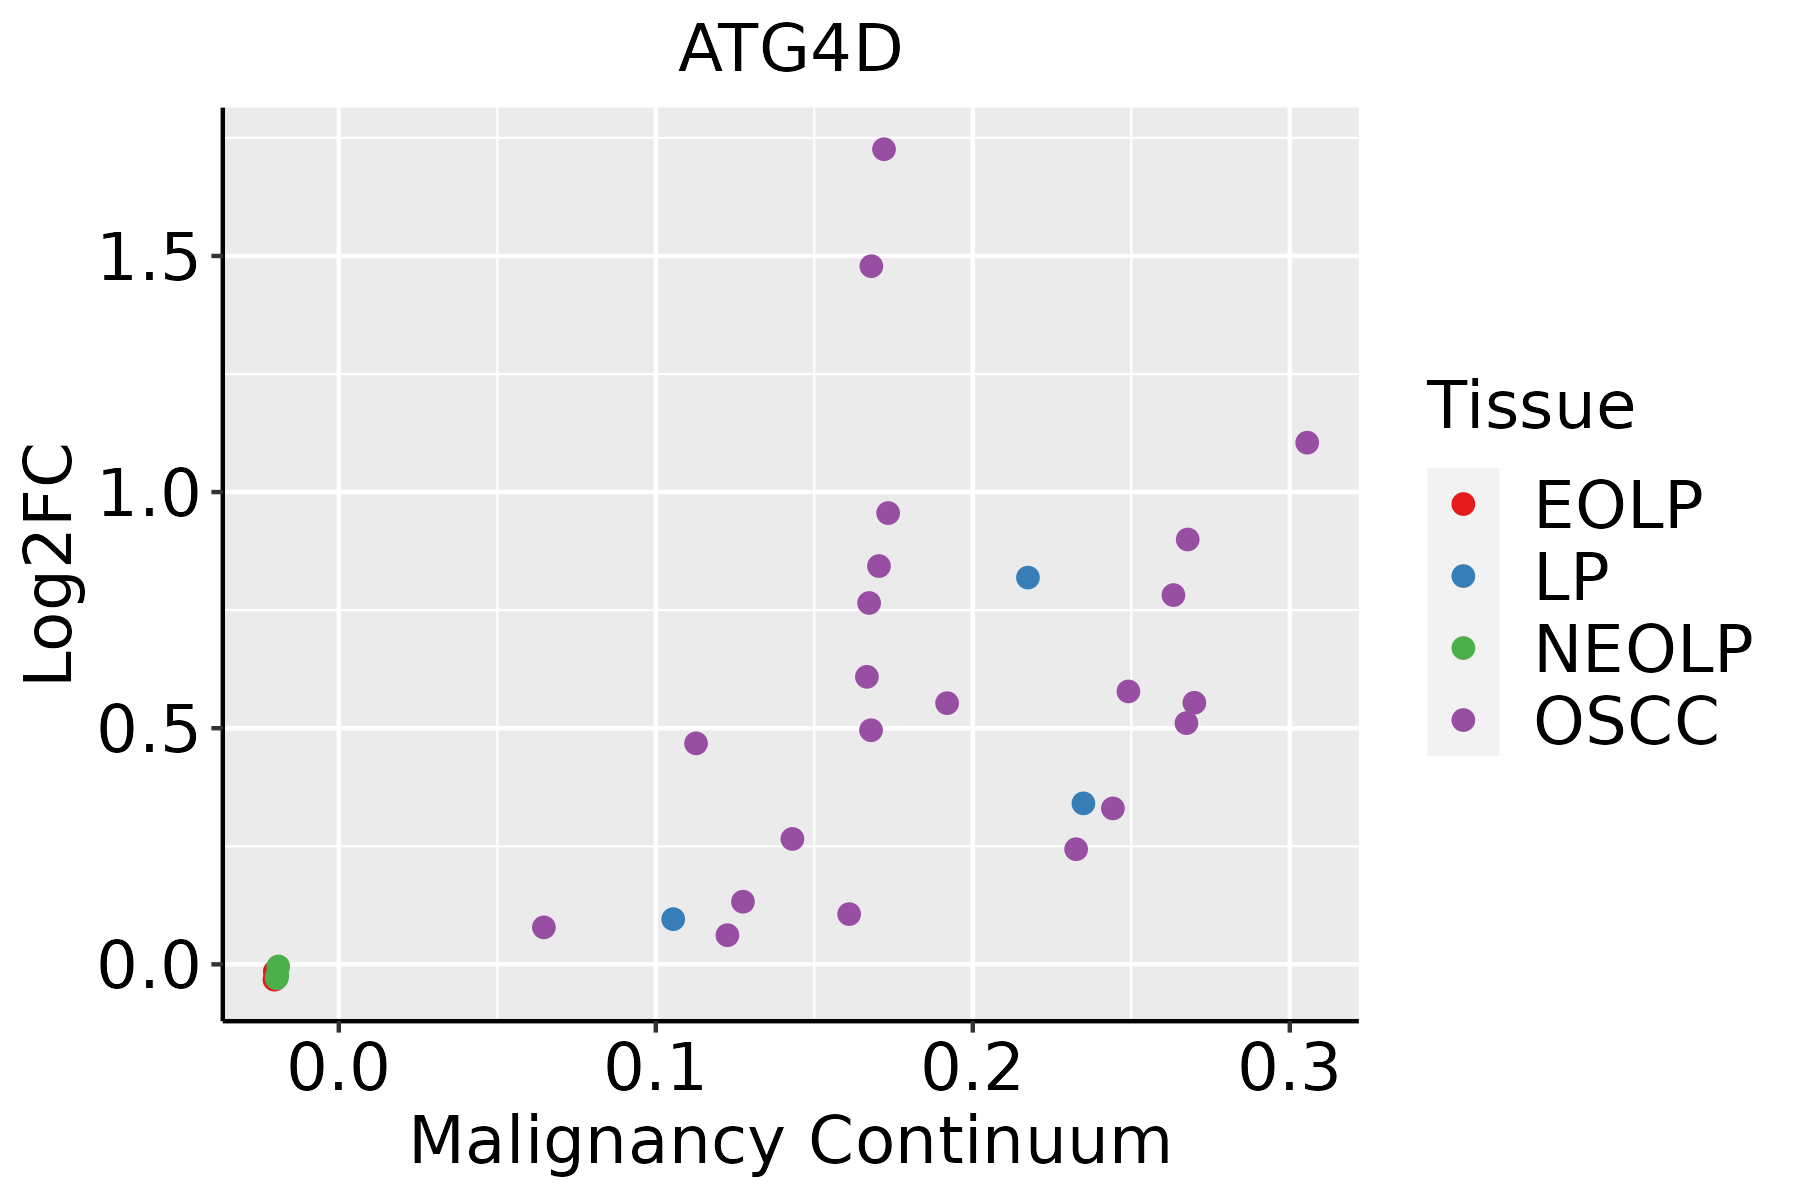 | EOLP: Erosive Oral lichen planus |
| LP: leukoplakia | ||
| NEOLP: Non-erosive oral lichen planus | ||
| OSCC: Oral squamous cell carcinoma |
| ∗log2FC in expression of this searched gene in stem-like cells from each diseased tissue sample relative to stem-like cells in normal samples in each tissue plotted against the malignancy continuum. Samples are colored based on if they are from different disease stage. |
Top |
Malignant transformation related pathway analysis |
| Find out the enriched GO biological processes and KEGG pathways involved in transition from healthy to precancer to cancer |
| Tissue | Disease Stage | Enriched GO biological Processes |
| Colorectum | AD |  |
| Colorectum | SER |  |
| Colorectum | MSS |  |
| Colorectum | MSI-H |  |
| Colorectum | FAP |  |
| ∗Top 15 enriched GO BP terms are showed in the bar plot of each disease state in each tissue. Each row represents a significant GO biological process which is colored according to the -log10(p.adjust). |
| Page: 1 2 3 4 5 6 7 8 9 |
| GO ID | Tissue | Disease Stage | Description | Gene Ratio | Bg Ratio | pvalue | p.adjust | Count |
| Page: 1 |
| Pathway ID | Tissue | Disease Stage | Description | Gene Ratio | Bg Ratio | pvalue | p.adjust | qvalue | Count |
| hsa0414010 | Esophagus | ESCC | Autophagy - animal | 101/4205 | 141/8465 | 7.60e-08 | 6.21e-07 | 3.18e-07 | 101 |
| hsa0414015 | Esophagus | ESCC | Autophagy - animal | 101/4205 | 141/8465 | 7.60e-08 | 6.21e-07 | 3.18e-07 | 101 |
| hsa041409 | Oral cavity | OSCC | Autophagy - animal | 94/3704 | 141/8465 | 2.73e-08 | 2.38e-07 | 1.21e-07 | 94 |
| hsa0414014 | Oral cavity | OSCC | Autophagy - animal | 94/3704 | 141/8465 | 2.73e-08 | 2.38e-07 | 1.21e-07 | 94 |
| hsa0414024 | Oral cavity | LP | Autophagy - animal | 55/2418 | 141/8465 | 4.54e-03 | 1.87e-02 | 1.20e-02 | 55 |
| hsa04136 | Oral cavity | LP | Autophagy - other | 16/2418 | 32/8465 | 8.31e-03 | 3.08e-02 | 1.98e-02 | 16 |
| hsa0414034 | Oral cavity | LP | Autophagy - animal | 55/2418 | 141/8465 | 4.54e-03 | 1.87e-02 | 1.20e-02 | 55 |
| hsa041361 | Oral cavity | LP | Autophagy - other | 16/2418 | 32/8465 | 8.31e-03 | 3.08e-02 | 1.98e-02 | 16 |
| Page: 1 |
Top |
Cell-cell communication analysis |
| Identification of potential cell-cell interactions between two cell types and their ligand-receptor pairs for different disease states |
| Ligand | Receptor | LRpair | Pathway | Tissue | Disease Stage |
| Page: 1 |
Top |
Single-cell gene regulatory network inference analysis |
| Find out the significant the regulons (TFs) and the target genes of each regulon across cell types for different disease states |
| TF | Cell Type | Tissue | Disease Stage | Target Gene | RSS | Regulon Activity |
| ∗The dot plots of a searched regulon are shown for all cell subpopulations in each disease state of each tissue based on the regulon specific score inferred using pySCENIC and by calculating the average expression. |
| Page: 1 |
Top |
Somatic mutation of malignant transformation related genes |
| Annotation of somatic variants for genes involved in malignant transformation |
| Hugo Symbol | Variant Class | Variant Classification | dbSNP RS | HGVSc | HGVSp | HGVSp Short | SWISSPROT | BIOTYPE | SIFT | PolyPhen | Tumor Sample Barcode | Tissue | Histology | Sex | Age | Stage | Therapy Types | Drugs | Outcome |
| ATG4D | SNV | Missense_Mutation | rs765478983 | c.1357N>T | p.Arg453Trp | p.R453W | Q86TL0 | protein_coding | tolerated(0.08) | possibly_damaging(0.719) | TCGA-A8-A07P-01 | Breast | breast invasive carcinoma | Female | >=65 | I/II | Chemotherapy | 5-fluorouracil | SD |
| ATG4D | SNV | Missense_Mutation | c.417N>A | p.Asp139Glu | p.D139E | Q86TL0 | protein_coding | deleterious(0) | probably_damaging(0.972) | TCGA-A8-A08L-01 | Breast | breast invasive carcinoma | Female | >=65 | III/IV | Unknown | Unknown | SD | |
| ATG4D | SNV | Missense_Mutation | c.1218G>C | p.Glu406Asp | p.E406D | Q86TL0 | protein_coding | tolerated(0.11) | possibly_damaging(0.449) | TCGA-C8-A12K-01 | Breast | breast invasive carcinoma | Female | >=65 | I/II | Unknown | Unknown | SD | |
| ATG4D | SNV | Missense_Mutation | novel | c.902T>G | p.Val301Gly | p.V301G | Q86TL0 | protein_coding | deleterious(0) | possibly_damaging(0.77) | TCGA-C8-A1HJ-01 | Breast | breast invasive carcinoma | Female | <65 | I/II | Unknown | Unknown | SD |
| ATG4D | SNV | Missense_Mutation | c.875N>T | p.Asp292Val | p.D292V | Q86TL0 | protein_coding | tolerated(0.12) | benign(0.115) | TCGA-D8-A1XL-01 | Breast | breast invasive carcinoma | Female | <65 | I/II | Chemotherapy | doxorubicine+cyclophosphamide+tamoxifen | SD | |
| ATG4D | SNV | Missense_Mutation | rs775975025 | c.1342N>A | p.Ala448Thr | p.A448T | Q86TL0 | protein_coding | tolerated(0.56) | benign(0) | TCGA-2W-A8YY-01 | Cervix | cervical & endocervical cancer | Female | <65 | I/II | Chemotherapy | cisplatin | CR |
| ATG4D | SNV | Missense_Mutation | c.413C>T | p.Ser138Leu | p.S138L | Q86TL0 | protein_coding | deleterious(0.03) | benign(0.103) | TCGA-EA-A43B-01 | Cervix | cervical & endocervical cancer | Female | <65 | I/II | Chemotherapy | cisplatin | CR | |
| ATG4D | SNV | Missense_Mutation | c.1122N>T | p.Glu374Asp | p.E374D | Q86TL0 | protein_coding | deleterious(0.04) | benign(0.261) | TCGA-AA-3492-01 | Colorectum | colon adenocarcinoma | Female | >=65 | I/II | Unknown | Unknown | SD | |
| ATG4D | SNV | Missense_Mutation | c.1262N>A | p.Ala421Asp | p.A421D | Q86TL0 | protein_coding | tolerated(0.12) | benign(0.03) | TCGA-AA-3664-01 | Colorectum | colon adenocarcinoma | Female | >=65 | I/II | Unknown | Unknown | SD | |
| ATG4D | SNV | Missense_Mutation | c.359N>G | p.Leu120Arg | p.L120R | Q86TL0 | protein_coding | deleterious(0) | probably_damaging(0.986) | TCGA-AA-3713-01 | Colorectum | colon adenocarcinoma | Male | >=65 | III/IV | Chemotherapy | 5-fluorouracil | PR |
| Page: 1 2 3 4 5 |
Top |
Related drugs of malignant transformation related genes |
| Identification of chemicals and drugs interact with genes involved in malignant transfromation |
| (DGIdb 4.0) |
| Entrez ID | Symbol | Category | Interaction Types | Drug Claim Name | Drug Name | PMIDs |
| Page: 1 |

Copyright 2023-Present -The University of Texas Health Science Center at Houston |