
|
|||||
|
 | |
| |
| |
| |
| |
| |
|
Gene: ATG4B |
Gene summary for ATG4B |
| Gene information | Species | Human | Gene symbol | ATG4B | Gene ID | 23192 |
| Gene name | autophagy related 4B cysteine peptidase | |
| Gene Alias | APG4B | |
| Cytomap | 2q37.3 | |
| Gene Type | protein-coding | GO ID | GO:0006464 | UniProtAcc | B3KVU2 |
Top |
Malignant transformation analysis |
| Identification of the aberrant gene expression in precancerous and cancerous lesions by comparing the gene expression of stem-like cells in diseased tissues with normal stem cells |
| Entrez ID | Symbol | Replicates | Species | Organ | Tissue | Adj P-value | Log2FC | Malignancy |
| 23192 | ATG4B | HTA11_1938_2000001011 | Human | Colorectum | AD | 2.59e-02 | 3.53e-01 | -0.0811 |
| 23192 | ATG4B | HTA11_347_2000001011 | Human | Colorectum | AD | 7.29e-14 | 5.09e-01 | -0.1954 |
| 23192 | ATG4B | HTA11_411_2000001011 | Human | Colorectum | SER | 4.88e-05 | 8.58e-01 | -0.2602 |
| 23192 | ATG4B | HTA11_696_2000001011 | Human | Colorectum | AD | 3.84e-04 | 3.92e-01 | -0.1464 |
| 23192 | ATG4B | HTA11_1391_2000001011 | Human | Colorectum | AD | 3.96e-06 | 5.08e-01 | -0.059 |
| 23192 | ATG4B | HTA11_99999971662_82457 | Human | Colorectum | MSS | 2.01e-04 | 3.89e-01 | 0.3859 |
| 23192 | ATG4B | A015-C-203 | Human | Colorectum | FAP | 7.47e-06 | -3.08e-02 | -0.1294 |
| 23192 | ATG4B | A001-C-108 | Human | Colorectum | FAP | 6.76e-07 | -1.66e-01 | -0.0272 |
| 23192 | ATG4B | A002-C-205 | Human | Colorectum | FAP | 1.28e-05 | -2.12e-01 | -0.1236 |
| 23192 | ATG4B | A015-C-006 | Human | Colorectum | FAP | 7.42e-03 | -7.88e-02 | -0.0994 |
| 23192 | ATG4B | A002-C-114 | Human | Colorectum | FAP | 1.41e-04 | -1.43e-01 | -0.1561 |
| 23192 | ATG4B | A015-C-104 | Human | Colorectum | FAP | 1.73e-06 | -1.26e-01 | -0.1899 |
| 23192 | ATG4B | A002-C-016 | Human | Colorectum | FAP | 1.72e-03 | -1.90e-01 | 0.0521 |
| 23192 | ATG4B | A002-C-116 | Human | Colorectum | FAP | 1.48e-06 | -2.30e-01 | -0.0452 |
| 23192 | ATG4B | A014-C-008 | Human | Colorectum | FAP | 7.52e-03 | -1.87e-01 | -0.191 |
| 23192 | ATG4B | A018-E-020 | Human | Colorectum | FAP | 5.44e-05 | -1.75e-01 | -0.2034 |
| 23192 | ATG4B | F034 | Human | Colorectum | FAP | 3.89e-02 | -1.57e-01 | -0.0665 |
| 23192 | ATG4B | LZE4T | Human | Esophagus | ESCC | 3.25e-10 | 2.95e-01 | 0.0811 |
| 23192 | ATG4B | LZE7T | Human | Esophagus | ESCC | 1.60e-08 | 3.74e-01 | 0.0667 |
| 23192 | ATG4B | LZE8T | Human | Esophagus | ESCC | 5.95e-10 | 2.64e-01 | 0.067 |
| Page: 1 2 3 4 5 6 7 |
| Tissue | Expression Dynamics | Abbreviation |
| Colorectum (GSE201348) |  | FAP: Familial adenomatous polyposis |
| CRC: Colorectal cancer | ||
| Colorectum (HTA11) |  | AD: Adenomas |
| SER: Sessile serrated lesions | ||
| MSI-H: Microsatellite-high colorectal cancer | ||
| MSS: Microsatellite stable colorectal cancer | ||
| Esophagus | 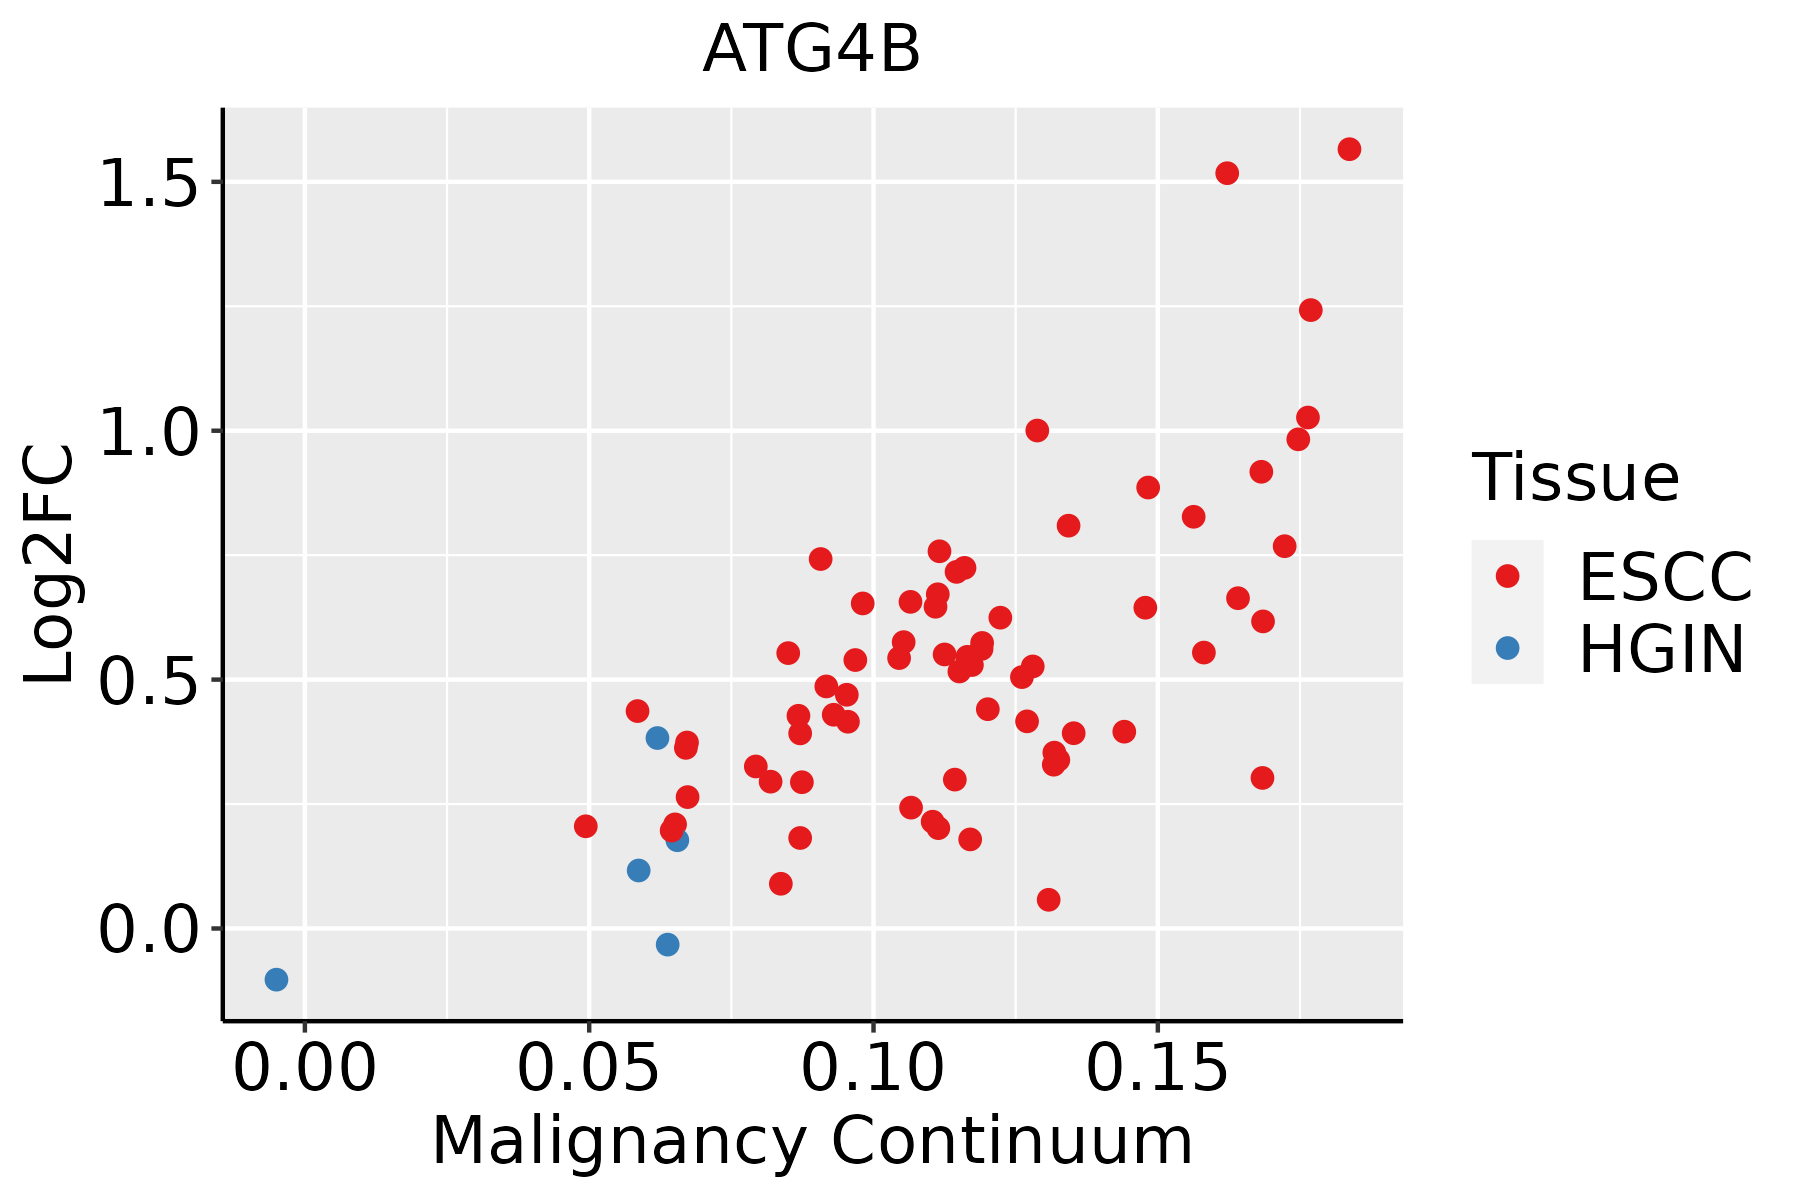 | ESCC: Esophageal squamous cell carcinoma |
| HGIN: High-grade intraepithelial neoplasias | ||
| LGIN: Low-grade intraepithelial neoplasias | ||
| Liver | 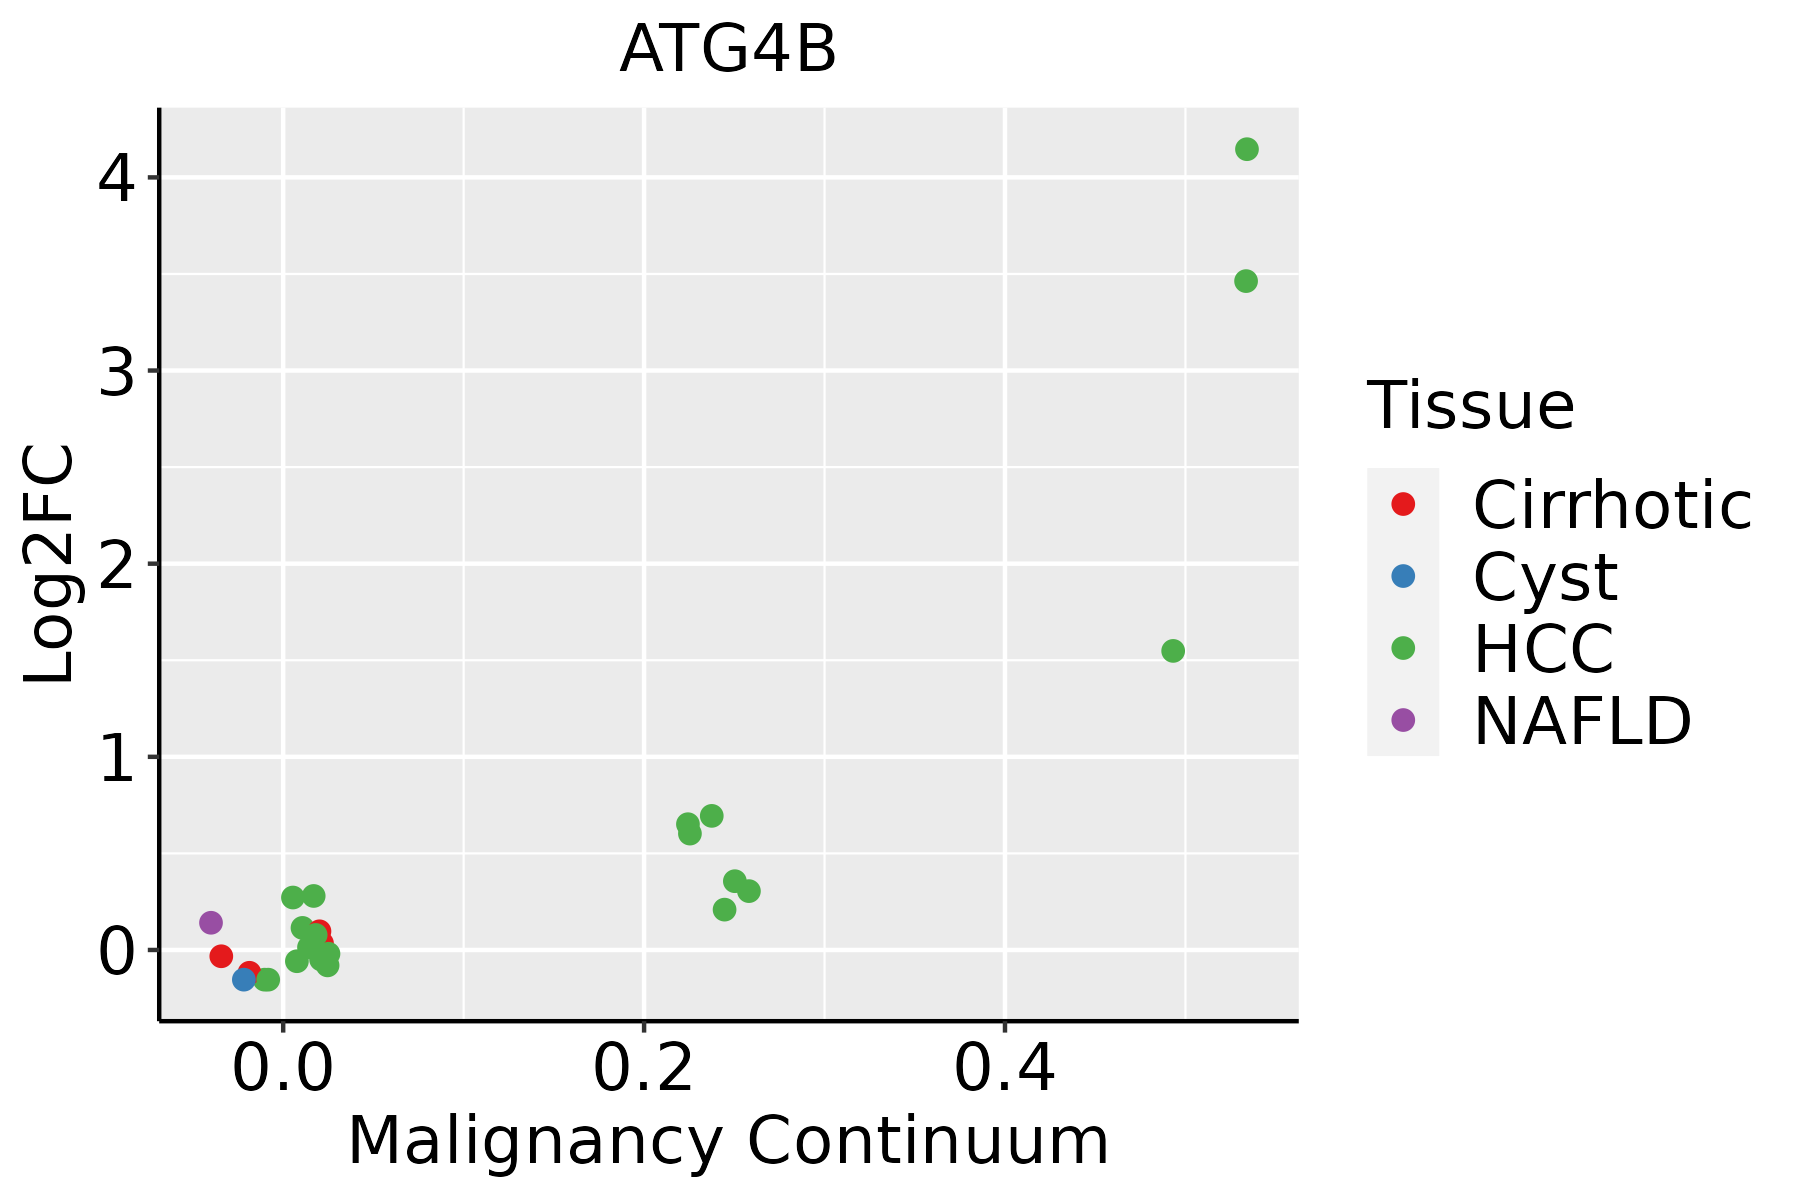 | HCC: Hepatocellular carcinoma |
| NAFLD: Non-alcoholic fatty liver disease | ||
| Oral Cavity | 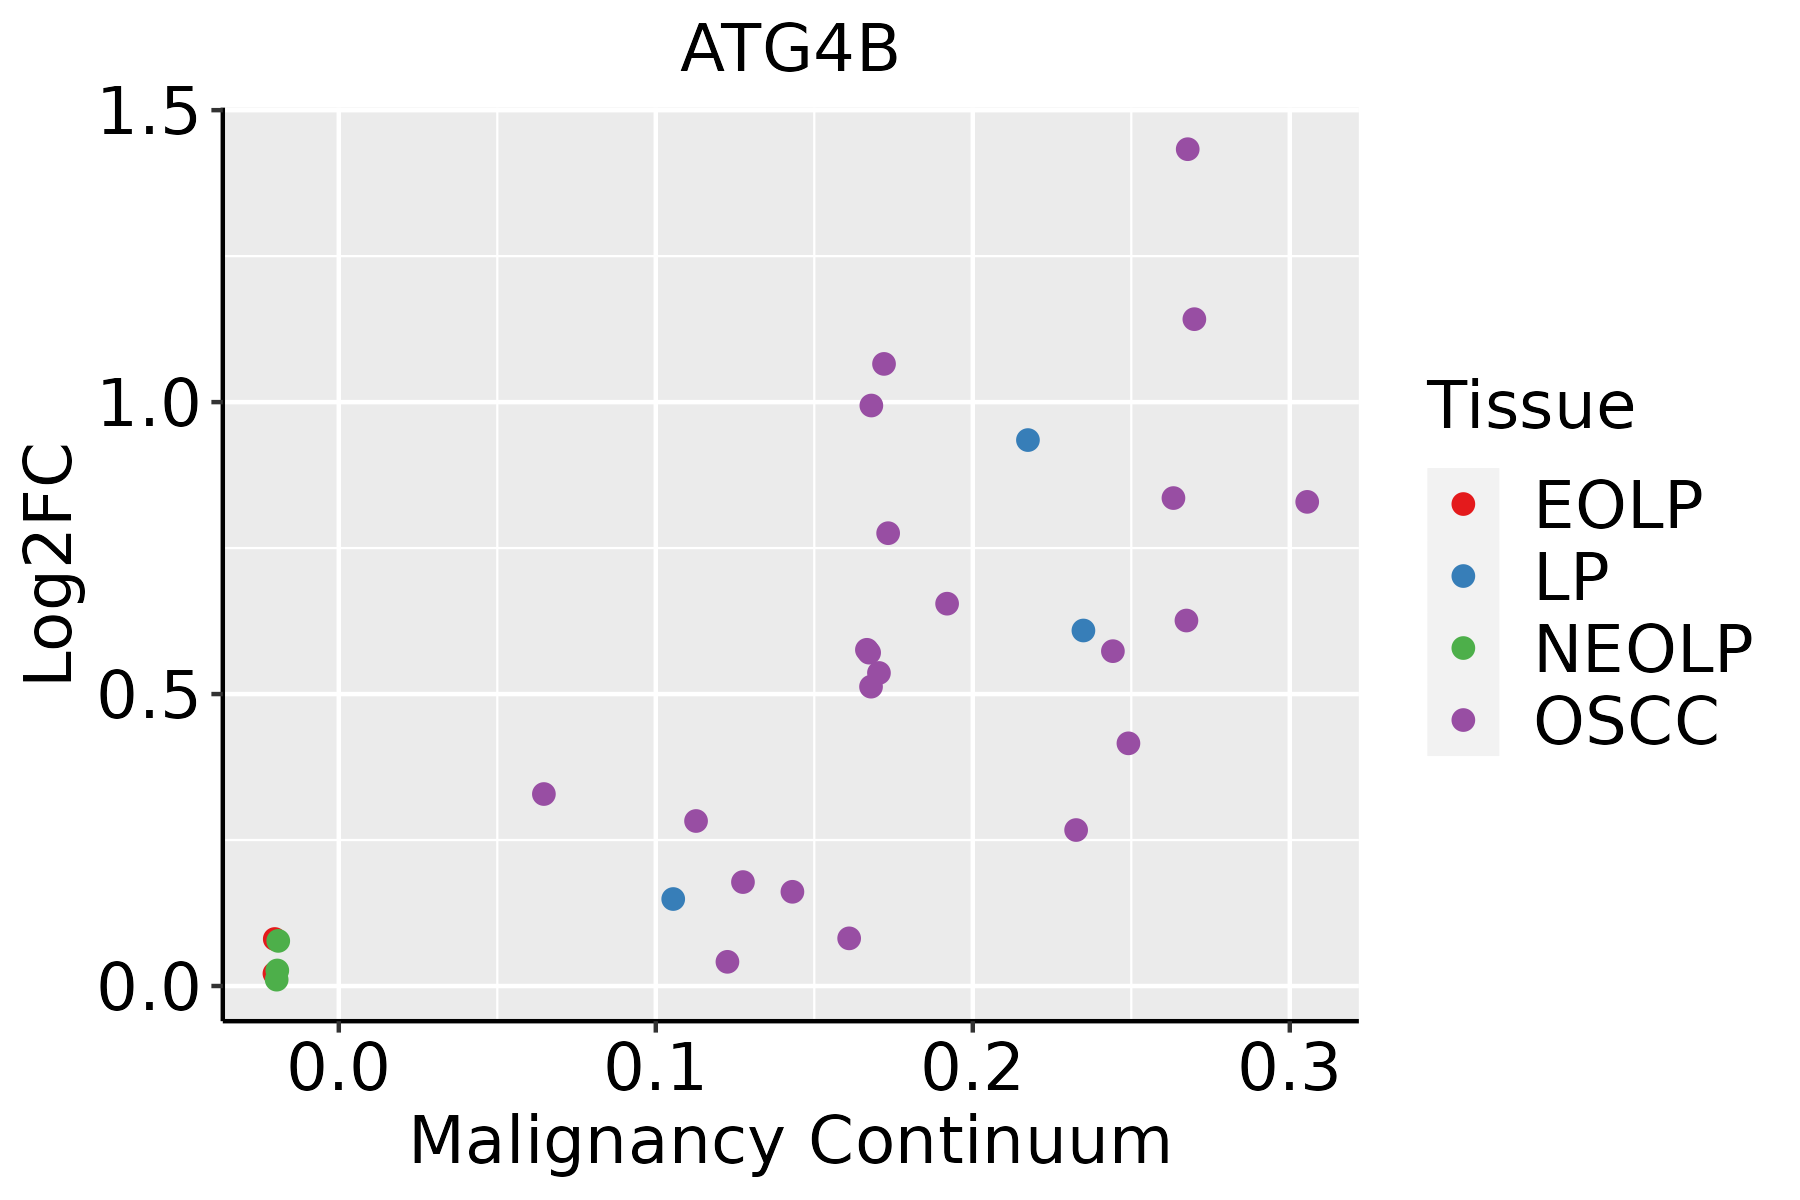 | EOLP: Erosive Oral lichen planus |
| LP: leukoplakia | ||
| NEOLP: Non-erosive oral lichen planus | ||
| OSCC: Oral squamous cell carcinoma | ||
| Skin | 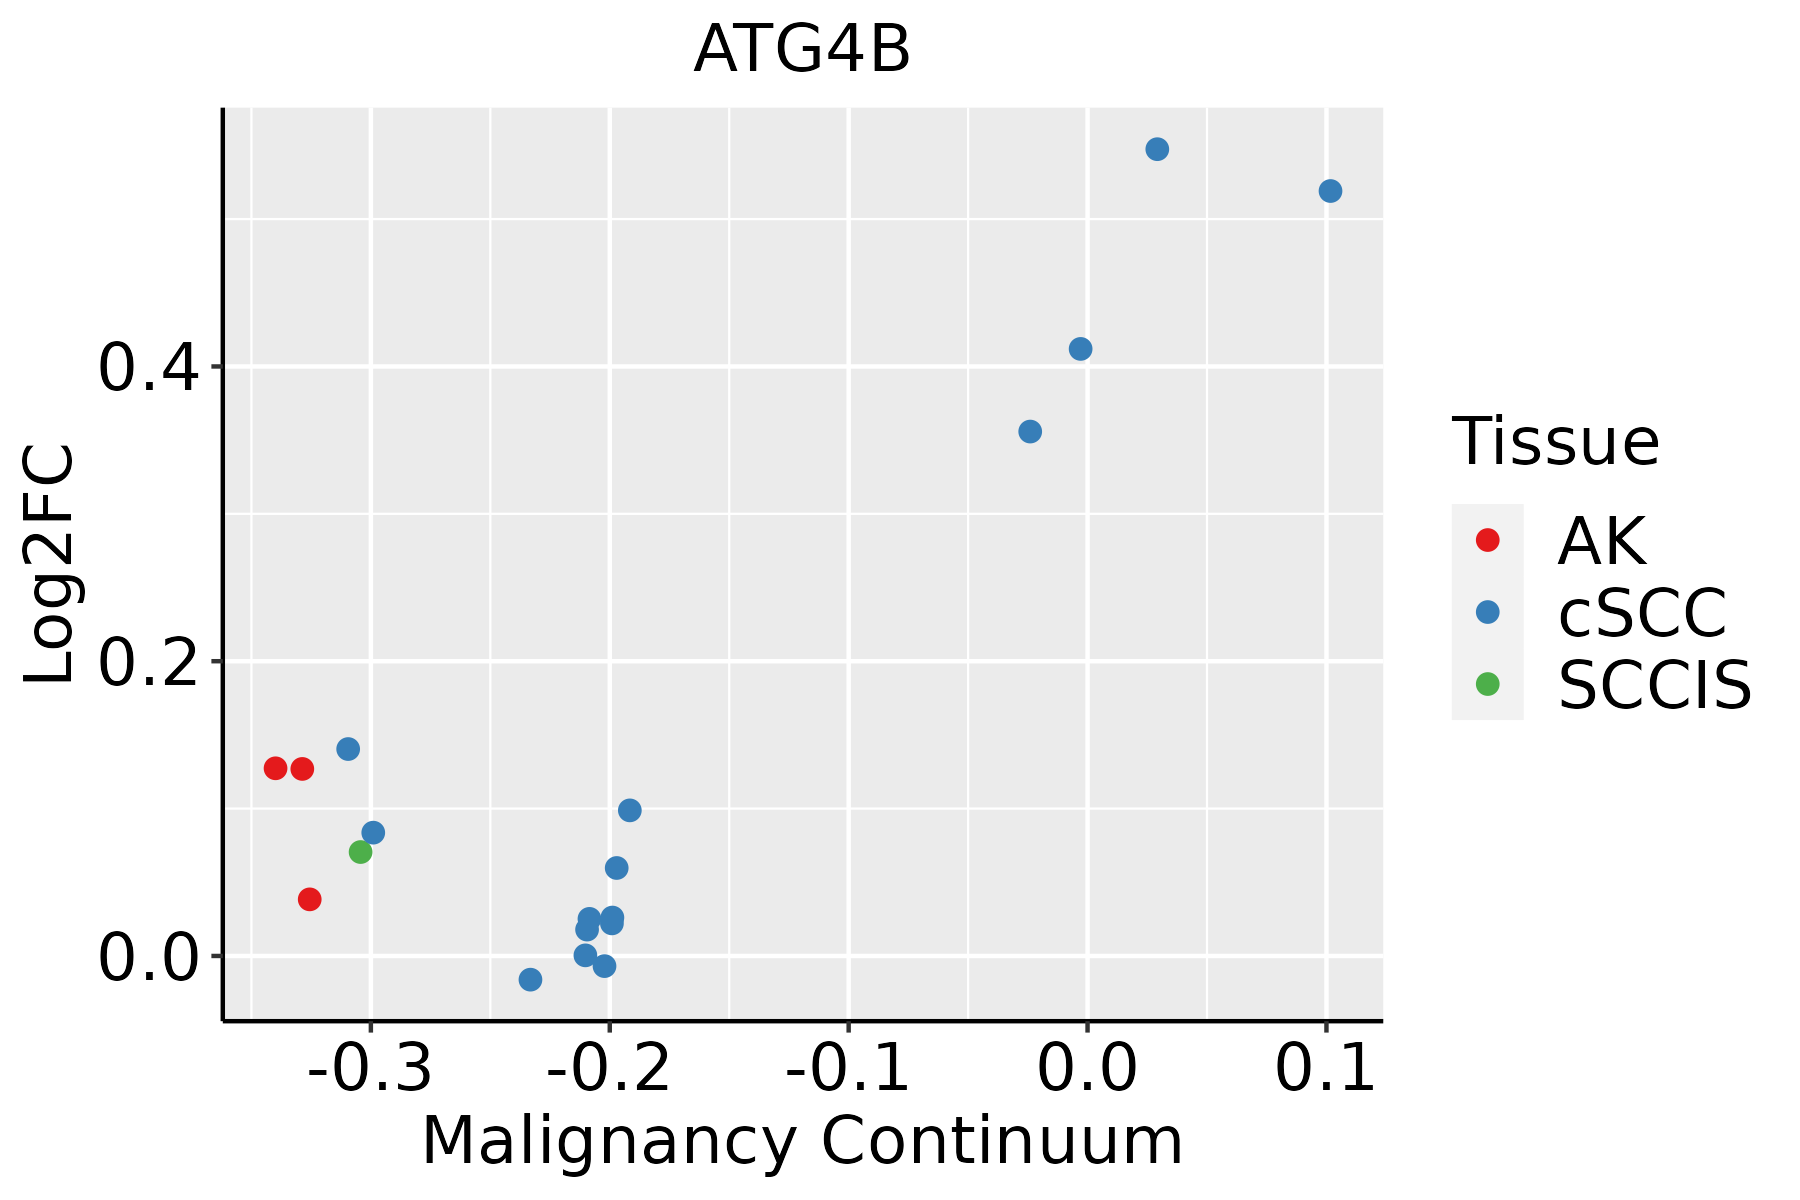 | AK: Actinic keratosis |
| cSCC: Cutaneous squamous cell carcinoma | ||
| SCCIS:squamous cell carcinoma in situ | ||
| Thyroid |  | ATC: Anaplastic thyroid cancer |
| HT: Hashimoto's thyroiditis | ||
| PTC: Papillary thyroid cancer |
| ∗log2FC in expression of this searched gene in stem-like cells from each diseased tissue sample relative to stem-like cells in normal samples in each tissue plotted against the malignancy continuum. Samples are colored based on if they are from different disease stage. |
Top |
Malignant transformation related pathway analysis |
| Find out the enriched GO biological processes and KEGG pathways involved in transition from healthy to precancer to cancer |
| Tissue | Disease Stage | Enriched GO biological Processes |
| Colorectum | AD |  |
| Colorectum | SER |  |
| Colorectum | MSS |  |
| Colorectum | MSI-H |  |
| Colorectum | FAP |  |
| ∗Top 15 enriched GO BP terms are showed in the bar plot of each disease state in each tissue. Each row represents a significant GO biological process which is colored according to the -log10(p.adjust). |
| Page: 1 2 3 4 5 6 7 8 9 |
| GO ID | Tissue | Disease Stage | Description | Gene Ratio | Bg Ratio | pvalue | p.adjust | Count |
| GO:0042176 | Colorectum | AD | regulation of protein catabolic process | 160/3918 | 391/18723 | 1.06e-19 | 7.34e-17 | 160 |
| GO:0009896 | Colorectum | AD | positive regulation of catabolic process | 180/3918 | 492/18723 | 4.33e-16 | 1.94e-13 | 180 |
| GO:0045732 | Colorectum | AD | positive regulation of protein catabolic process | 92/3918 | 231/18723 | 3.85e-11 | 4.47e-09 | 92 |
| GO:0016236 | Colorectum | AD | macroautophagy | 103/3918 | 291/18723 | 6.76e-09 | 4.15e-07 | 103 |
| GO:00421761 | Colorectum | SER | regulation of protein catabolic process | 126/2897 | 391/18723 | 5.33e-17 | 2.52e-14 | 126 |
| GO:00457321 | Colorectum | SER | positive regulation of protein catabolic process | 77/2897 | 231/18723 | 9.91e-12 | 1.90e-09 | 77 |
| GO:00098961 | Colorectum | SER | positive regulation of catabolic process | 132/2897 | 492/18723 | 4.16e-11 | 6.72e-09 | 132 |
| GO:00162361 | Colorectum | SER | macroautophagy | 79/2897 | 291/18723 | 1.97e-07 | 1.10e-05 | 79 |
| GO:00421762 | Colorectum | MSS | regulation of protein catabolic process | 145/3467 | 391/18723 | 2.03e-18 | 1.17e-15 | 145 |
| GO:00098962 | Colorectum | MSS | positive regulation of catabolic process | 163/3467 | 492/18723 | 3.10e-15 | 9.22e-13 | 163 |
| GO:00457322 | Colorectum | MSS | positive regulation of protein catabolic process | 85/3467 | 231/18723 | 3.66e-11 | 4.57e-09 | 85 |
| GO:00162362 | Colorectum | MSS | macroautophagy | 93/3467 | 291/18723 | 2.08e-08 | 1.17e-06 | 93 |
| GO:00098964 | Colorectum | FAP | positive regulation of catabolic process | 126/2622 | 492/18723 | 3.76e-12 | 2.56e-09 | 126 |
| GO:00421764 | Colorectum | FAP | regulation of protein catabolic process | 106/2622 | 391/18723 | 5.00e-12 | 3.06e-09 | 106 |
| GO:00457324 | Colorectum | FAP | positive regulation of protein catabolic process | 61/2622 | 231/18723 | 4.38e-07 | 2.35e-05 | 61 |
| GO:00162363 | Colorectum | FAP | macroautophagy | 70/2622 | 291/18723 | 2.73e-06 | 1.02e-04 | 70 |
| GO:0042176111 | Esophagus | ESCC | regulation of protein catabolic process | 280/8552 | 391/18723 | 8.65e-26 | 2.39e-23 | 280 |
| GO:001623617 | Esophagus | ESCC | macroautophagy | 216/8552 | 291/18723 | 1.94e-23 | 4.57e-21 | 216 |
| GO:0009896111 | Esophagus | ESCC | positive regulation of catabolic process | 332/8552 | 492/18723 | 4.36e-23 | 9.22e-21 | 332 |
| GO:0045732111 | Esophagus | ESCC | positive regulation of protein catabolic process | 167/8552 | 231/18723 | 1.47e-16 | 1.14e-14 | 167 |
| Page: 1 2 3 |
| Pathway ID | Tissue | Disease Stage | Description | Gene Ratio | Bg Ratio | pvalue | p.adjust | qvalue | Count |
| hsa04140 | Colorectum | AD | Autophagy - animal | 49/2092 | 141/8465 | 4.58e-03 | 2.20e-02 | 1.40e-02 | 49 |
| hsa041401 | Colorectum | AD | Autophagy - animal | 49/2092 | 141/8465 | 4.58e-03 | 2.20e-02 | 1.40e-02 | 49 |
| hsa041402 | Colorectum | SER | Autophagy - animal | 39/1580 | 141/8465 | 5.43e-03 | 3.28e-02 | 2.38e-02 | 39 |
| hsa041403 | Colorectum | SER | Autophagy - animal | 39/1580 | 141/8465 | 5.43e-03 | 3.28e-02 | 2.38e-02 | 39 |
| hsa041404 | Colorectum | MSS | Autophagy - animal | 45/1875 | 141/8465 | 4.42e-03 | 1.90e-02 | 1.16e-02 | 45 |
| hsa041405 | Colorectum | MSS | Autophagy - animal | 45/1875 | 141/8465 | 4.42e-03 | 1.90e-02 | 1.16e-02 | 45 |
| hsa0414010 | Esophagus | ESCC | Autophagy - animal | 101/4205 | 141/8465 | 7.60e-08 | 6.21e-07 | 3.18e-07 | 101 |
| hsa041362 | Esophagus | ESCC | Autophagy - other | 23/4205 | 32/8465 | 8.99e-03 | 2.14e-02 | 1.09e-02 | 23 |
| hsa0414015 | Esophagus | ESCC | Autophagy - animal | 101/4205 | 141/8465 | 7.60e-08 | 6.21e-07 | 3.18e-07 | 101 |
| hsa0413611 | Esophagus | ESCC | Autophagy - other | 23/4205 | 32/8465 | 8.99e-03 | 2.14e-02 | 1.09e-02 | 23 |
| hsa0414021 | Liver | HCC | Autophagy - animal | 99/4020 | 141/8465 | 3.08e-08 | 4.70e-07 | 2.61e-07 | 99 |
| hsa0414031 | Liver | HCC | Autophagy - animal | 99/4020 | 141/8465 | 3.08e-08 | 4.70e-07 | 2.61e-07 | 99 |
| hsa041409 | Oral cavity | OSCC | Autophagy - animal | 94/3704 | 141/8465 | 2.73e-08 | 2.38e-07 | 1.21e-07 | 94 |
| hsa0414014 | Oral cavity | OSCC | Autophagy - animal | 94/3704 | 141/8465 | 2.73e-08 | 2.38e-07 | 1.21e-07 | 94 |
| hsa0414024 | Oral cavity | LP | Autophagy - animal | 55/2418 | 141/8465 | 4.54e-03 | 1.87e-02 | 1.20e-02 | 55 |
| hsa04136 | Oral cavity | LP | Autophagy - other | 16/2418 | 32/8465 | 8.31e-03 | 3.08e-02 | 1.98e-02 | 16 |
| hsa0414034 | Oral cavity | LP | Autophagy - animal | 55/2418 | 141/8465 | 4.54e-03 | 1.87e-02 | 1.20e-02 | 55 |
| hsa041361 | Oral cavity | LP | Autophagy - other | 16/2418 | 32/8465 | 8.31e-03 | 3.08e-02 | 1.98e-02 | 16 |
| Page: 1 |
Top |
Cell-cell communication analysis |
| Identification of potential cell-cell interactions between two cell types and their ligand-receptor pairs for different disease states |
| Ligand | Receptor | LRpair | Pathway | Tissue | Disease Stage |
| Page: 1 |
Top |
Single-cell gene regulatory network inference analysis |
| Find out the significant the regulons (TFs) and the target genes of each regulon across cell types for different disease states |
| TF | Cell Type | Tissue | Disease Stage | Target Gene | RSS | Regulon Activity |
| ∗The dot plots of a searched regulon are shown for all cell subpopulations in each disease state of each tissue based on the regulon specific score inferred using pySCENIC and by calculating the average expression. |
| Page: 1 |
Top |
Somatic mutation of malignant transformation related genes |
| Annotation of somatic variants for genes involved in malignant transformation |
| Hugo Symbol | Variant Class | Variant Classification | dbSNP RS | HGVSc | HGVSp | HGVSp Short | SWISSPROT | BIOTYPE | SIFT | PolyPhen | Tumor Sample Barcode | Tissue | Histology | Sex | Age | Stage | Therapy Types | Drugs | Outcome |
| ATG4B | SNV | Missense_Mutation | c.293N>T | p.Trp98Leu | p.W98L | Q9Y4P1 | protein_coding | deleterious(0) | possibly_damaging(0.644) | TCGA-A7-A0DB-01 | Breast | breast invasive carcinoma | Female | <65 | I/II | Hormone Therapy | arimidex | SD | |
| ATG4B | SNV | Missense_Mutation | c.1112N>T | p.Ser371Phe | p.S371F | Q9Y4P1 | protein_coding | tolerated(0.25) | benign(0.001) | TCGA-D8-A1JN-01 | Breast | breast invasive carcinoma | Female | >=65 | III/IV | Hormone Therapy | anastrozolum | SD | |
| ATG4B | SNV | Missense_Mutation | rs745479816 | c.365A>G | p.Tyr122Cys | p.Y122C | Q9Y4P1 | protein_coding | tolerated(0.18) | benign(0.001) | TCGA-AA-3864-01 | Colorectum | colon adenocarcinoma | Male | >=65 | I/II | Unknown | Unknown | SD |
| ATG4B | SNV | Missense_Mutation | c.97N>C | p.Tyr33His | p.Y33H | Q9Y4P1 | protein_coding | tolerated(0.14) | benign(0.178) | TCGA-AZ-6608-01 | Colorectum | colon adenocarcinoma | Female | <65 | III/IV | Unknown | Unknown | SD | |
| ATG4B | SNV | Missense_Mutation | rs771274919 | c.808N>A | p.Val270Ile | p.V270I | Q9Y4P1 | protein_coding | tolerated(0.09) | benign(0.149) | TCGA-CM-5861-01 | Colorectum | colon adenocarcinoma | Female | <65 | I/II | Unknown | Unknown | PD |
| ATG4B | SNV | Missense_Mutation | c.966N>A | p.Phe322Leu | p.F322L | Q9Y4P1 | protein_coding | tolerated(0.12) | benign(0.088) | TCGA-G4-6588-01 | Colorectum | colon adenocarcinoma | Female | <65 | I/II | Unknown | Unknown | SD | |
| ATG4B | SNV | Missense_Mutation | novel | c.485N>A | p.Ser162Asn | p.S162N | Q9Y4P1 | protein_coding | tolerated(0.36) | benign(0.306) | TCGA-A5-A0G2-01 | Endometrium | uterine corpus endometrioid carcinoma | Female | <65 | III/IV | Unknown | Unknown | SD |
| ATG4B | SNV | Missense_Mutation | novel | c.1136N>T | p.Arg379Ile | p.R379I | Q9Y4P1 | protein_coding | deleterious(0.01) | probably_damaging(0.986) | TCGA-AJ-A3EL-01 | Endometrium | uterine corpus endometrioid carcinoma | Female | <65 | I/II | Unknown | Unknown | SD |
| ATG4B | SNV | Missense_Mutation | c.418G>T | p.Gly140Cys | p.G140C | Q9Y4P1 | protein_coding | deleterious(0.02) | probably_damaging(0.996) | TCGA-AP-A059-01 | Endometrium | uterine corpus endometrioid carcinoma | Female | >=65 | I/II | Unknown | Unknown | SD | |
| ATG4B | SNV | Missense_Mutation | c.349N>A | p.Asp117Asn | p.D117N | Q9Y4P1 | protein_coding | deleterious(0) | probably_damaging(1) | TCGA-AP-A0LM-01 | Endometrium | uterine corpus endometrioid carcinoma | Female | <65 | III/IV | Chemotherapy | cisplatin | SD |
| Page: 1 2 3 |
Top |
Related drugs of malignant transformation related genes |
| Identification of chemicals and drugs interact with genes involved in malignant transfromation |
| (DGIdb 4.0) |
| Entrez ID | Symbol | Category | Interaction Types | Drug Claim Name | Drug Name | PMIDs |
| 23192 | ATG4B | ENZYME, DRUGGABLE GENOME, PROTEASE | TOLFENAMIC ACID | TOLFENAMIC ACID | ||
| 23192 | ATG4B | ENZYME, DRUGGABLE GENOME, PROTEASE | DOXYCYCLINE HYCLATE | DOXYCYCLINE HYCLATE | ||
| 23192 | ATG4B | ENZYME, DRUGGABLE GENOME, PROTEASE | GNF-PF-4085 | CHEMBL528181 | ||
| 23192 | ATG4B | ENZYME, DRUGGABLE GENOME, PROTEASE | SJ000196127 | CHEMBL605084 | ||
| 23192 | ATG4B | ENZYME, DRUGGABLE GENOME, PROTEASE | ALEXIDINE HYDROCHLORIDE | ALEXIDINE HYDROCHLORIDE | ||
| 23192 | ATG4B | ENZYME, DRUGGABLE GENOME, PROTEASE | GNF-PF-2272 | CHEMBL601757 | ||
| 23192 | ATG4B | ENZYME, DRUGGABLE GENOME, PROTEASE | NSC-95397 | CHEMBL429095 | ||
| 23192 | ATG4B | ENZYME, DRUGGABLE GENOME, PROTEASE | BIFONAZOLE | BIFONAZOLE | ||
| 23192 | ATG4B | ENZYME, DRUGGABLE GENOME, PROTEASE | 9,10-PHENANTHRENEQUINONE | 9,10-PHENANTHRENEQUINONE | ||
| 23192 | ATG4B | ENZYME, DRUGGABLE GENOME, PROTEASE | FENTICLOR | FENTICLOR |
| Page: 1 2 |

Copyright 2023-Present -The University of Texas Health Science Center at Houston |