
|
|||||
|
 | |
| |
| |
| |
| |
| |
|
Gene: ATG2B |
Gene summary for ATG2B |
| Gene information | Species | Human | Gene symbol | ATG2B | Gene ID | 55102 |
| Gene name | autophagy related 2B | |
| Gene Alias | C14orf103 | |
| Cytomap | 14q32.2 | |
| Gene Type | protein-coding | GO ID | GO:0000045 | UniProtAcc | Q96BY7 |
Top |
Malignant transformation analysis |
| Identification of the aberrant gene expression in precancerous and cancerous lesions by comparing the gene expression of stem-like cells in diseased tissues with normal stem cells |
| Entrez ID | Symbol | Replicates | Species | Organ | Tissue | Adj P-value | Log2FC | Malignancy |
| 55102 | ATG2B | LZE4T | Human | Esophagus | ESCC | 3.83e-09 | 2.80e-01 | 0.0811 |
| 55102 | ATG2B | LZE20T | Human | Esophagus | ESCC | 8.81e-06 | 1.62e-01 | 0.0662 |
| 55102 | ATG2B | LZE24T | Human | Esophagus | ESCC | 1.41e-04 | 1.86e-01 | 0.0596 |
| 55102 | ATG2B | P2T-E | Human | Esophagus | ESCC | 1.85e-18 | 1.52e-01 | 0.1177 |
| 55102 | ATG2B | P5T-E | Human | Esophagus | ESCC | 1.14e-02 | 3.35e-02 | 0.1327 |
| 55102 | ATG2B | P8T-E | Human | Esophagus | ESCC | 1.49e-10 | 1.79e-01 | 0.0889 |
| 55102 | ATG2B | P10T-E | Human | Esophagus | ESCC | 6.41e-10 | 2.66e-01 | 0.116 |
| 55102 | ATG2B | P11T-E | Human | Esophagus | ESCC | 5.01e-08 | 2.62e-01 | 0.1426 |
| 55102 | ATG2B | P12T-E | Human | Esophagus | ESCC | 1.01e-17 | 3.46e-01 | 0.1122 |
| 55102 | ATG2B | P15T-E | Human | Esophagus | ESCC | 1.33e-15 | 3.29e-01 | 0.1149 |
| 55102 | ATG2B | P16T-E | Human | Esophagus | ESCC | 3.72e-09 | 1.22e-01 | 0.1153 |
| 55102 | ATG2B | P19T-E | Human | Esophagus | ESCC | 2.12e-02 | 3.29e-01 | 0.1662 |
| 55102 | ATG2B | P20T-E | Human | Esophagus | ESCC | 2.54e-06 | 7.43e-02 | 0.1124 |
| 55102 | ATG2B | P21T-E | Human | Esophagus | ESCC | 3.29e-05 | 1.10e-01 | 0.1617 |
| 55102 | ATG2B | P22T-E | Human | Esophagus | ESCC | 1.26e-05 | 8.97e-02 | 0.1236 |
| 55102 | ATG2B | P23T-E | Human | Esophagus | ESCC | 4.47e-02 | 1.17e-01 | 0.108 |
| 55102 | ATG2B | P24T-E | Human | Esophagus | ESCC | 8.43e-04 | 9.95e-02 | 0.1287 |
| 55102 | ATG2B | P26T-E | Human | Esophagus | ESCC | 2.18e-06 | 1.47e-01 | 0.1276 |
| 55102 | ATG2B | P27T-E | Human | Esophagus | ESCC | 2.07e-17 | 2.96e-01 | 0.1055 |
| 55102 | ATG2B | P28T-E | Human | Esophagus | ESCC | 5.80e-15 | 1.88e-01 | 0.1149 |
| Page: 1 2 3 |
| Tissue | Expression Dynamics | Abbreviation |
| Esophagus | 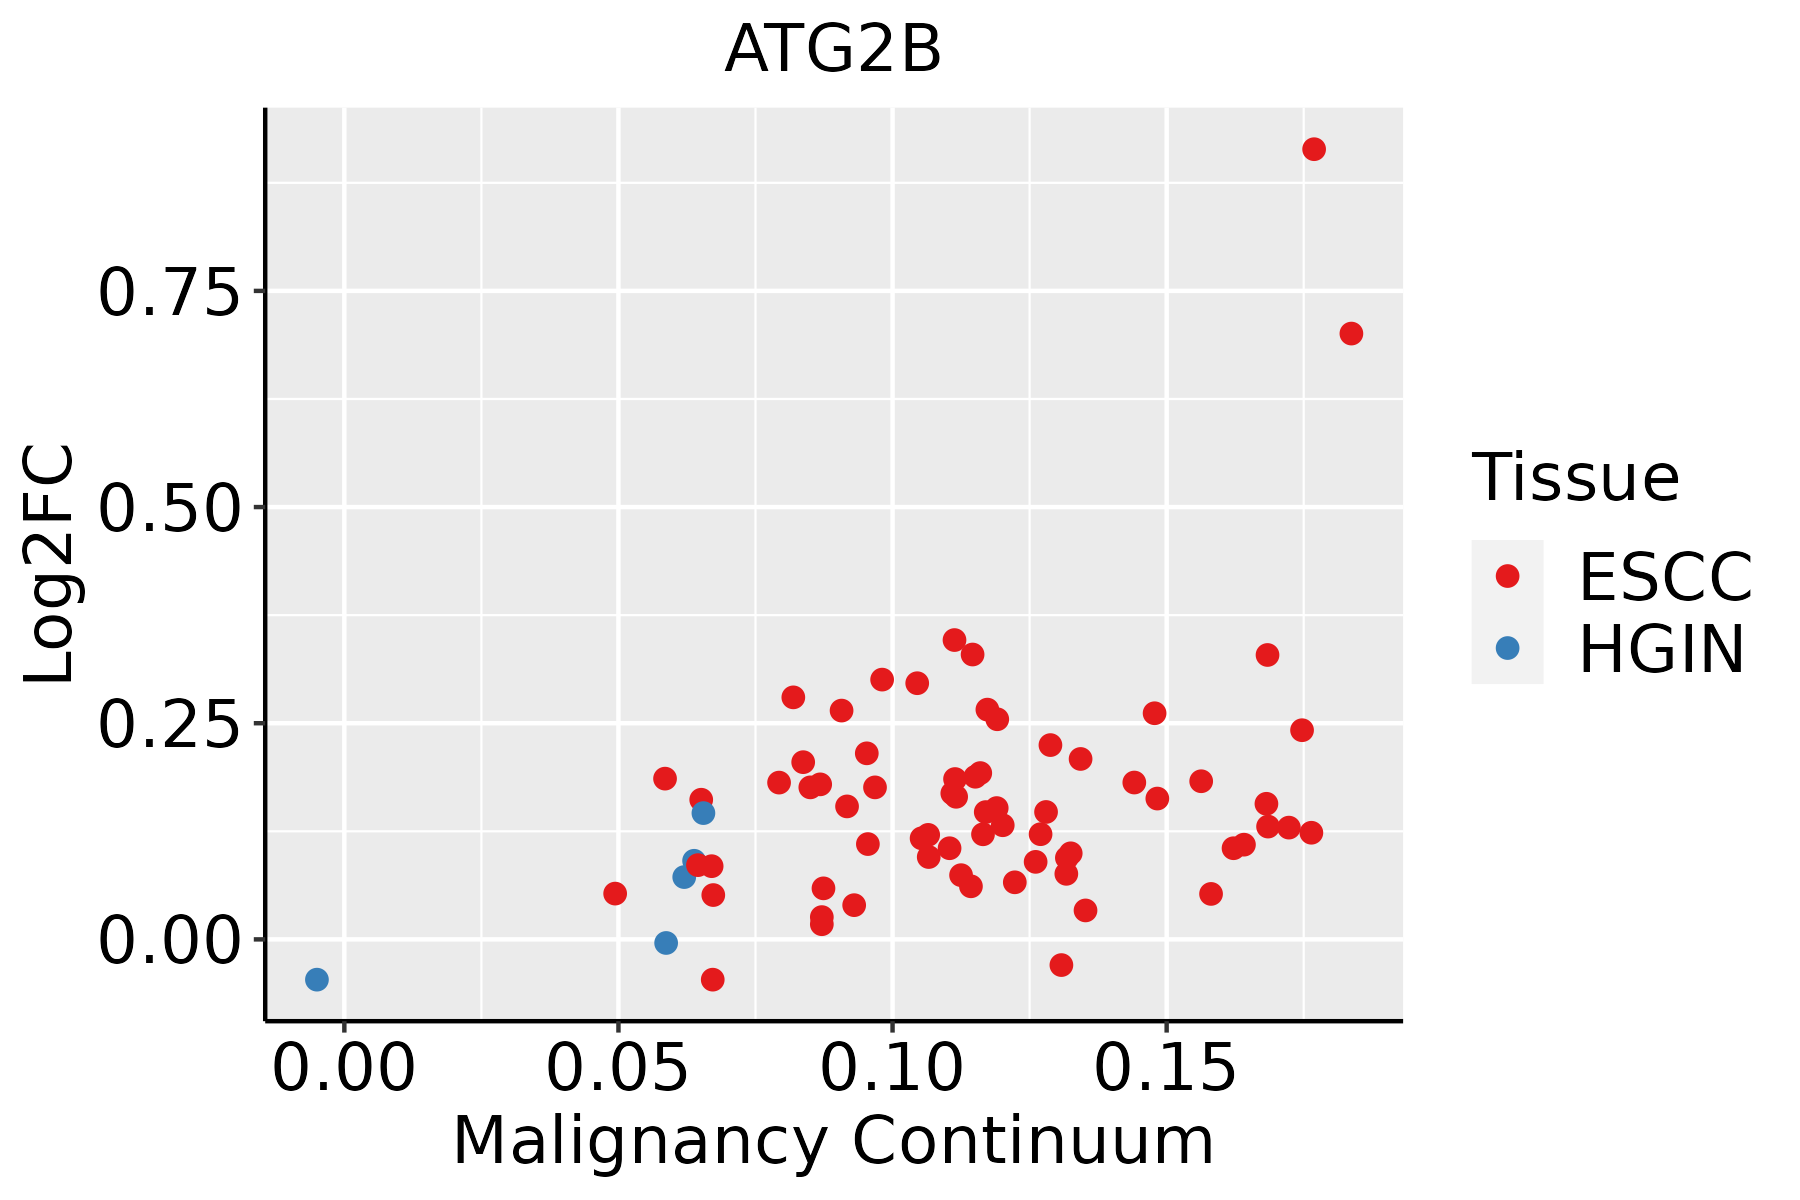 | ESCC: Esophageal squamous cell carcinoma |
| HGIN: High-grade intraepithelial neoplasias | ||
| LGIN: Low-grade intraepithelial neoplasias |
| ∗log2FC in expression of this searched gene in stem-like cells from each diseased tissue sample relative to stem-like cells in normal samples in each tissue plotted against the malignancy continuum. Samples are colored based on if they are from different disease stage. |
Top |
Malignant transformation related pathway analysis |
| Find out the enriched GO biological processes and KEGG pathways involved in transition from healthy to precancer to cancer |
| Tissue | Disease Stage | Enriched GO biological Processes |
| Colorectum | AD |  |
| Colorectum | SER |  |
| Colorectum | MSS |  |
| Colorectum | MSI-H |  |
| Colorectum | FAP |  |
| ∗Top 15 enriched GO BP terms are showed in the bar plot of each disease state in each tissue. Each row represents a significant GO biological process which is colored according to the -log10(p.adjust). |
| Page: 1 2 3 4 5 6 7 8 9 |
| GO ID | Tissue | Disease Stage | Description | Gene Ratio | Bg Ratio | pvalue | p.adjust | Count |
| GO:001623617 | Esophagus | ESCC | macroautophagy | 216/8552 | 291/18723 | 1.94e-23 | 4.57e-21 | 216 |
| GO:0022411111 | Esophagus | ESCC | cellular component disassembly | 305/8552 | 443/18723 | 1.94e-23 | 4.57e-21 | 305 |
| GO:190300816 | Esophagus | ESCC | organelle disassembly | 89/8552 | 114/18723 | 1.36e-12 | 5.80e-11 | 89 |
| GO:000703314 | Esophagus | ESCC | vacuole organization | 127/8552 | 180/18723 | 1.04e-11 | 3.85e-10 | 127 |
| GO:000042217 | Esophagus | ESCC | autophagy of mitochondrion | 63/8552 | 81/18723 | 3.41e-09 | 7.24e-08 | 63 |
| GO:006172617 | Esophagus | ESCC | mitochondrion disassembly | 63/8552 | 81/18723 | 3.41e-09 | 7.24e-08 | 63 |
| GO:190503712 | Esophagus | ESCC | autophagosome organization | 73/8552 | 103/18723 | 1.88e-07 | 2.93e-06 | 73 |
| GO:000004513 | Esophagus | ESCC | autophagosome assembly | 69/8552 | 99/18723 | 1.10e-06 | 1.38e-05 | 69 |
| GO:006191215 | Esophagus | ESCC | selective autophagy | 47/8552 | 68/18723 | 7.81e-05 | 5.80e-04 | 47 |
| Page: 1 |
| Pathway ID | Tissue | Disease Stage | Description | Gene Ratio | Bg Ratio | pvalue | p.adjust | qvalue | Count |
| hsa05014210 | Esophagus | ESCC | Amyotrophic lateral sclerosis | 266/4205 | 364/8465 | 1.31e-20 | 2.20e-18 | 1.13e-18 | 266 |
| hsa05016210 | Esophagus | ESCC | Huntington disease | 226/4205 | 306/8465 | 1.38e-18 | 8.72e-17 | 4.46e-17 | 226 |
| hsa05022210 | Esophagus | ESCC | Pathways of neurodegeneration - multiple diseases | 318/4205 | 476/8465 | 6.10e-15 | 2.04e-13 | 1.05e-13 | 318 |
| hsa05010210 | Esophagus | ESCC | Alzheimer disease | 263/4205 | 384/8465 | 1.80e-14 | 5.47e-13 | 2.80e-13 | 263 |
| hsa0414010 | Esophagus | ESCC | Autophagy - animal | 101/4205 | 141/8465 | 7.60e-08 | 6.21e-07 | 3.18e-07 | 101 |
| hsa0501728 | Esophagus | ESCC | Spinocerebellar ataxia | 94/4205 | 143/8465 | 6.77e-05 | 2.90e-04 | 1.48e-04 | 94 |
| hsa041362 | Esophagus | ESCC | Autophagy - other | 23/4205 | 32/8465 | 8.99e-03 | 2.14e-02 | 1.09e-02 | 23 |
| hsa0501438 | Esophagus | ESCC | Amyotrophic lateral sclerosis | 266/4205 | 364/8465 | 1.31e-20 | 2.20e-18 | 1.13e-18 | 266 |
| hsa0501638 | Esophagus | ESCC | Huntington disease | 226/4205 | 306/8465 | 1.38e-18 | 8.72e-17 | 4.46e-17 | 226 |
| hsa0502238 | Esophagus | ESCC | Pathways of neurodegeneration - multiple diseases | 318/4205 | 476/8465 | 6.10e-15 | 2.04e-13 | 1.05e-13 | 318 |
| hsa0501038 | Esophagus | ESCC | Alzheimer disease | 263/4205 | 384/8465 | 1.80e-14 | 5.47e-13 | 2.80e-13 | 263 |
| hsa0414015 | Esophagus | ESCC | Autophagy - animal | 101/4205 | 141/8465 | 7.60e-08 | 6.21e-07 | 3.18e-07 | 101 |
| hsa0501736 | Esophagus | ESCC | Spinocerebellar ataxia | 94/4205 | 143/8465 | 6.77e-05 | 2.90e-04 | 1.48e-04 | 94 |
| hsa0413611 | Esophagus | ESCC | Autophagy - other | 23/4205 | 32/8465 | 8.99e-03 | 2.14e-02 | 1.09e-02 | 23 |
| Page: 1 |
Top |
Cell-cell communication analysis |
| Identification of potential cell-cell interactions between two cell types and their ligand-receptor pairs for different disease states |
| Ligand | Receptor | LRpair | Pathway | Tissue | Disease Stage |
| Page: 1 |
Top |
Single-cell gene regulatory network inference analysis |
| Find out the significant the regulons (TFs) and the target genes of each regulon across cell types for different disease states |
| TF | Cell Type | Tissue | Disease Stage | Target Gene | RSS | Regulon Activity |
| ∗The dot plots of a searched regulon are shown for all cell subpopulations in each disease state of each tissue based on the regulon specific score inferred using pySCENIC and by calculating the average expression. |
| Page: 1 |
Top |
Somatic mutation of malignant transformation related genes |
| Annotation of somatic variants for genes involved in malignant transformation |
| Hugo Symbol | Variant Class | Variant Classification | dbSNP RS | HGVSc | HGVSp | HGVSp Short | SWISSPROT | BIOTYPE | SIFT | PolyPhen | Tumor Sample Barcode | Tissue | Histology | Sex | Age | Stage | Therapy Types | Drugs | Outcome |
| ATG2B | SNV | Missense_Mutation | c.1594N>G | p.Asn532Asp | p.N532D | Q96BY7 | protein_coding | tolerated(0.42) | benign(0.034) | TCGA-A2-A0CS-01 | Breast | breast invasive carcinoma | Female | >=65 | III/IV | Hormone Therapy | anastrozole | SD | |
| ATG2B | SNV | Missense_Mutation | rs781516992 | c.3064N>T | p.Thr1022Ser | p.T1022S | Q96BY7 | protein_coding | tolerated(0.6) | benign(0.182) | TCGA-A8-A07Z-01 | Breast | breast invasive carcinoma | Female | >=65 | I/II | Unspecific | Exemestane | SD |
| ATG2B | SNV | Missense_Mutation | rs771625294 | c.770G>C | p.Ser257Thr | p.S257T | Q96BY7 | protein_coding | deleterious(0.04) | probably_damaging(0.98) | TCGA-A8-A096-01 | Breast | breast invasive carcinoma | Female | >=65 | I/II | Unknown | Unknown | SD |
| ATG2B | SNV | Missense_Mutation | c.4369N>A | p.Glu1457Lys | p.E1457K | Q96BY7 | protein_coding | deleterious(0) | possibly_damaging(0.771) | TCGA-AN-A0FZ-01 | Breast | breast invasive carcinoma | Female | <65 | III/IV | Unknown | Unknown | SD | |
| ATG2B | SNV | Missense_Mutation | rs375023828 | c.319N>T | p.Arg107Cys | p.R107C | Q96BY7 | protein_coding | tolerated(0.12) | probably_damaging(0.999) | TCGA-AO-A128-01 | Breast | breast invasive carcinoma | Female | <65 | I/II | Chemotherapy | doxorubicin | SD |
| ATG2B | SNV | Missense_Mutation | c.3736N>T | p.Ala1246Ser | p.A1246S | Q96BY7 | protein_coding | tolerated(0.21) | benign(0.191) | TCGA-AR-A1AQ-01 | Breast | breast invasive carcinoma | Female | <65 | I/II | Chemotherapy | doxorubicin | SD | |
| ATG2B | SNV | Missense_Mutation | c.2310N>C | p.Trp770Cys | p.W770C | Q96BY7 | protein_coding | deleterious(0.01) | probably_damaging(0.997) | TCGA-BH-A18L-01 | Breast | breast invasive carcinoma | Female | <65 | III/IV | Unknown | Unknown | SD | |
| ATG2B | SNV | Missense_Mutation | c.2617G>A | p.Asp873Asn | p.D873N | Q96BY7 | protein_coding | tolerated(0.19) | benign(0.101) | TCGA-D8-A27G-01 | Breast | breast invasive carcinoma | Female | >=65 | I/II | Unknown | Unknown | SD | |
| ATG2B | SNV | Missense_Mutation | novel | c.4833N>C | p.Gln1611His | p.Q1611H | Q96BY7 | protein_coding | deleterious(0.01) | probably_damaging(0.993) | TCGA-S3-AA15-01 | Breast | breast invasive carcinoma | Female | <65 | I/II | Chemotherapy | adriamycin | CR |
| ATG2B | SNV | Missense_Mutation | novel | c.2870N>G | p.Leu957Arg | p.L957R | Q96BY7 | protein_coding | deleterious(0) | possibly_damaging(0.786) | TCGA-2W-A8YY-01 | Cervix | cervical & endocervical cancer | Female | <65 | I/II | Chemotherapy | cisplatin | CR |
| Page: 1 2 3 4 5 6 7 8 9 10 11 12 13 14 15 16 17 18 19 20 21 22 |
Top |
Related drugs of malignant transformation related genes |
| Identification of chemicals and drugs interact with genes involved in malignant transfromation |
| (DGIdb 4.0) |
| Entrez ID | Symbol | Category | Interaction Types | Drug Claim Name | Drug Name | PMIDs |
| Page: 1 |

Copyright 2023-Present -The University of Texas Health Science Center at Houston |