
|
|||||
|
 | |
| |
| |
| |
| |
| |
|
Gene: ATG2A |
Gene summary for ATG2A |
| Gene information | Species | Human | Gene symbol | ATG2A | Gene ID | 23130 |
| Gene name | autophagy related 2A | |
| Gene Alias | ATG2A | |
| Cytomap | 11q13.1 | |
| Gene Type | protein-coding | GO ID | GO:0000045 | UniProtAcc | Q2TAZ0 |
Top |
Malignant transformation analysis |
| Identification of the aberrant gene expression in precancerous and cancerous lesions by comparing the gene expression of stem-like cells in diseased tissues with normal stem cells |
| Entrez ID | Symbol | Replicates | Species | Organ | Tissue | Adj P-value | Log2FC | Malignancy |
| 23130 | ATG2A | LZE4T | Human | Esophagus | ESCC | 6.36e-10 | 2.89e-01 | 0.0811 |
| 23130 | ATG2A | LZE7T | Human | Esophagus | ESCC | 4.98e-10 | 3.93e-01 | 0.0667 |
| 23130 | ATG2A | LZE8T | Human | Esophagus | ESCC | 2.40e-05 | 2.59e-01 | 0.067 |
| 23130 | ATG2A | LZE20T | Human | Esophagus | ESCC | 1.23e-04 | 1.92e-01 | 0.0662 |
| 23130 | ATG2A | LZE24T | Human | Esophagus | ESCC | 1.69e-14 | 3.41e-01 | 0.0596 |
| 23130 | ATG2A | P1T-E | Human | Esophagus | ESCC | 1.10e-10 | 4.88e-01 | 0.0875 |
| 23130 | ATG2A | P2T-E | Human | Esophagus | ESCC | 4.50e-15 | 2.11e-01 | 0.1177 |
| 23130 | ATG2A | P4T-E | Human | Esophagus | ESCC | 7.06e-06 | 2.42e-01 | 0.1323 |
| 23130 | ATG2A | P5T-E | Human | Esophagus | ESCC | 5.22e-07 | 1.25e-01 | 0.1327 |
| 23130 | ATG2A | P8T-E | Human | Esophagus | ESCC | 1.99e-15 | 3.46e-01 | 0.0889 |
| 23130 | ATG2A | P9T-E | Human | Esophagus | ESCC | 4.89e-09 | 1.45e-01 | 0.1131 |
| 23130 | ATG2A | P10T-E | Human | Esophagus | ESCC | 6.00e-06 | 1.21e-01 | 0.116 |
| 23130 | ATG2A | P11T-E | Human | Esophagus | ESCC | 1.22e-07 | 5.01e-01 | 0.1426 |
| 23130 | ATG2A | P12T-E | Human | Esophagus | ESCC | 2.49e-12 | 2.44e-01 | 0.1122 |
| 23130 | ATG2A | P15T-E | Human | Esophagus | ESCC | 1.61e-06 | 1.03e-01 | 0.1149 |
| 23130 | ATG2A | P16T-E | Human | Esophagus | ESCC | 1.14e-12 | 1.69e-01 | 0.1153 |
| 23130 | ATG2A | P20T-E | Human | Esophagus | ESCC | 6.67e-10 | 1.46e-01 | 0.1124 |
| 23130 | ATG2A | P21T-E | Human | Esophagus | ESCC | 1.16e-13 | 2.92e-01 | 0.1617 |
| 23130 | ATG2A | P22T-E | Human | Esophagus | ESCC | 1.13e-07 | 8.17e-02 | 0.1236 |
| 23130 | ATG2A | P23T-E | Human | Esophagus | ESCC | 4.30e-07 | 2.92e-01 | 0.108 |
| Page: 1 2 3 4 5 |
| Tissue | Expression Dynamics | Abbreviation |
| Esophagus | 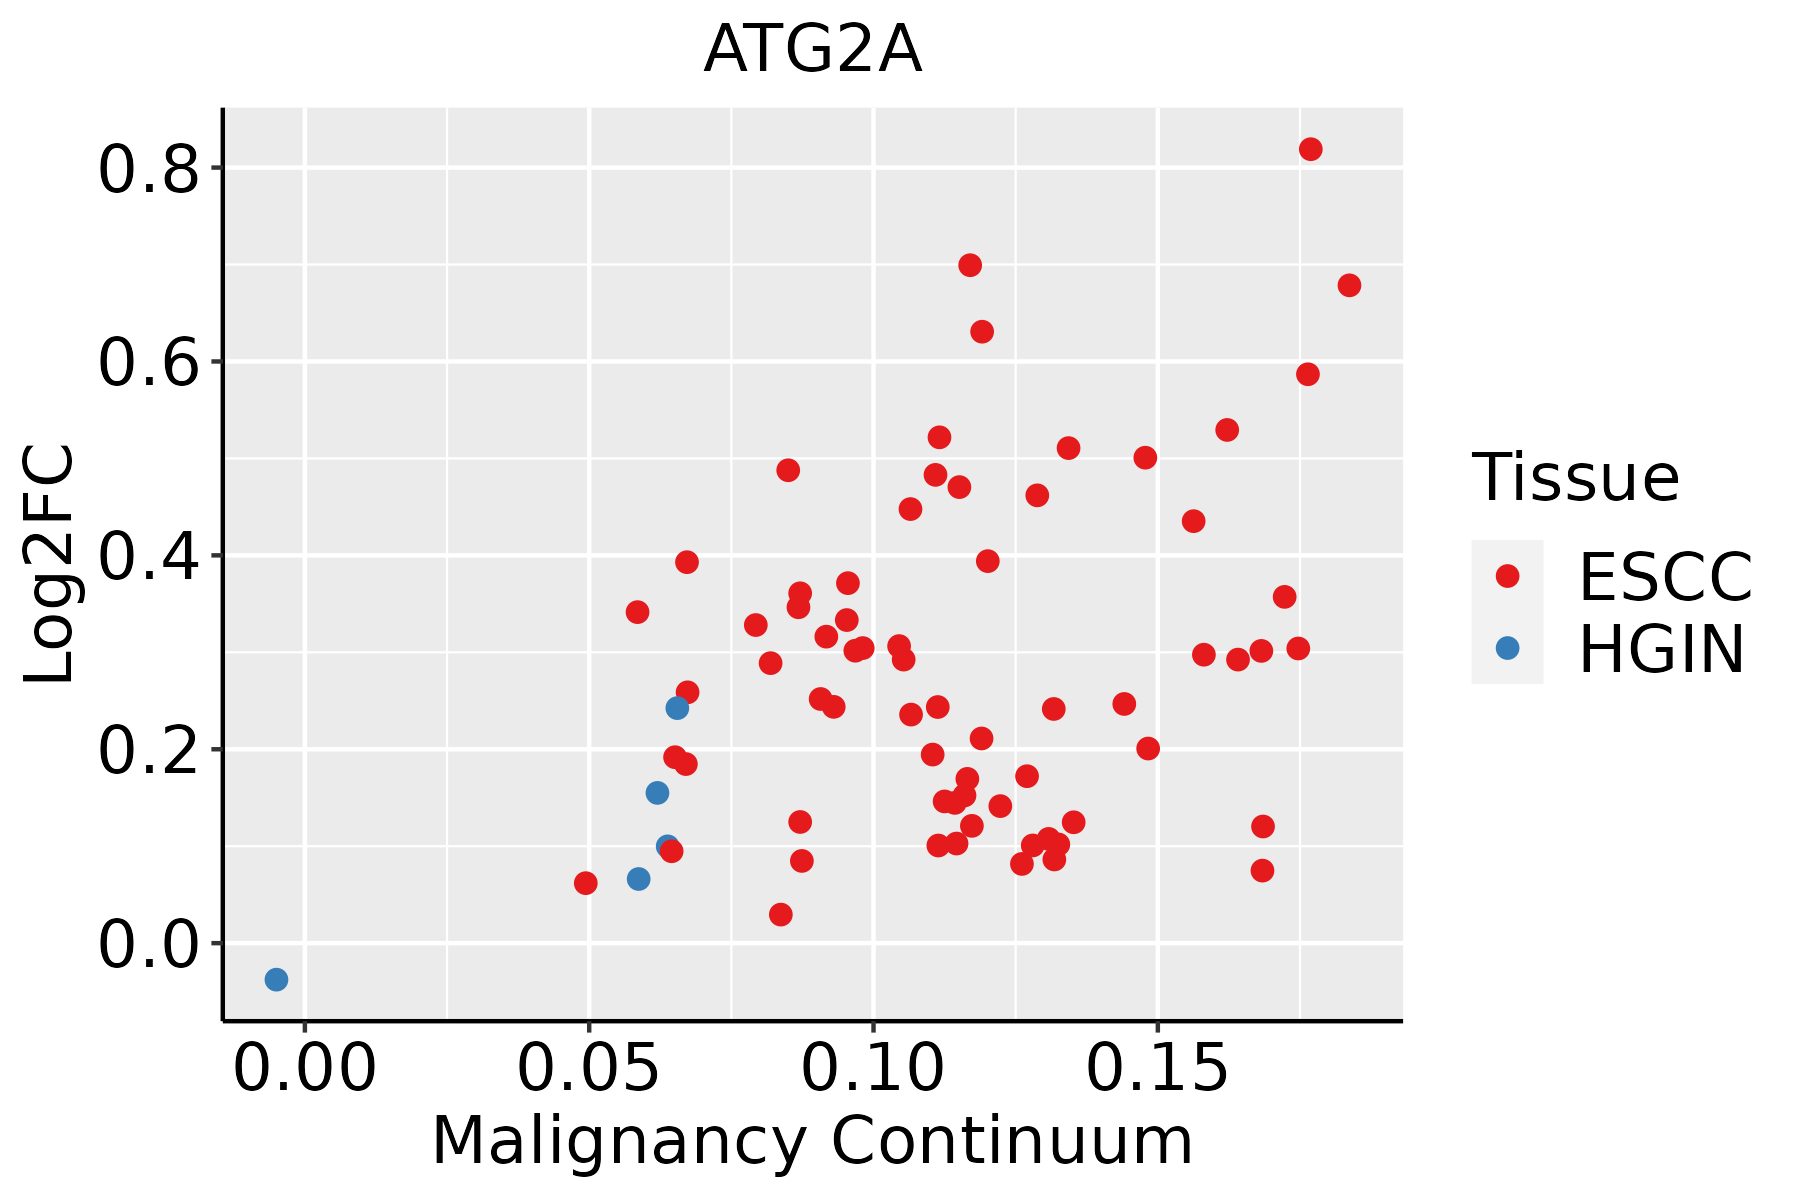 | ESCC: Esophageal squamous cell carcinoma |
| HGIN: High-grade intraepithelial neoplasias | ||
| LGIN: Low-grade intraepithelial neoplasias | ||
| Liver | 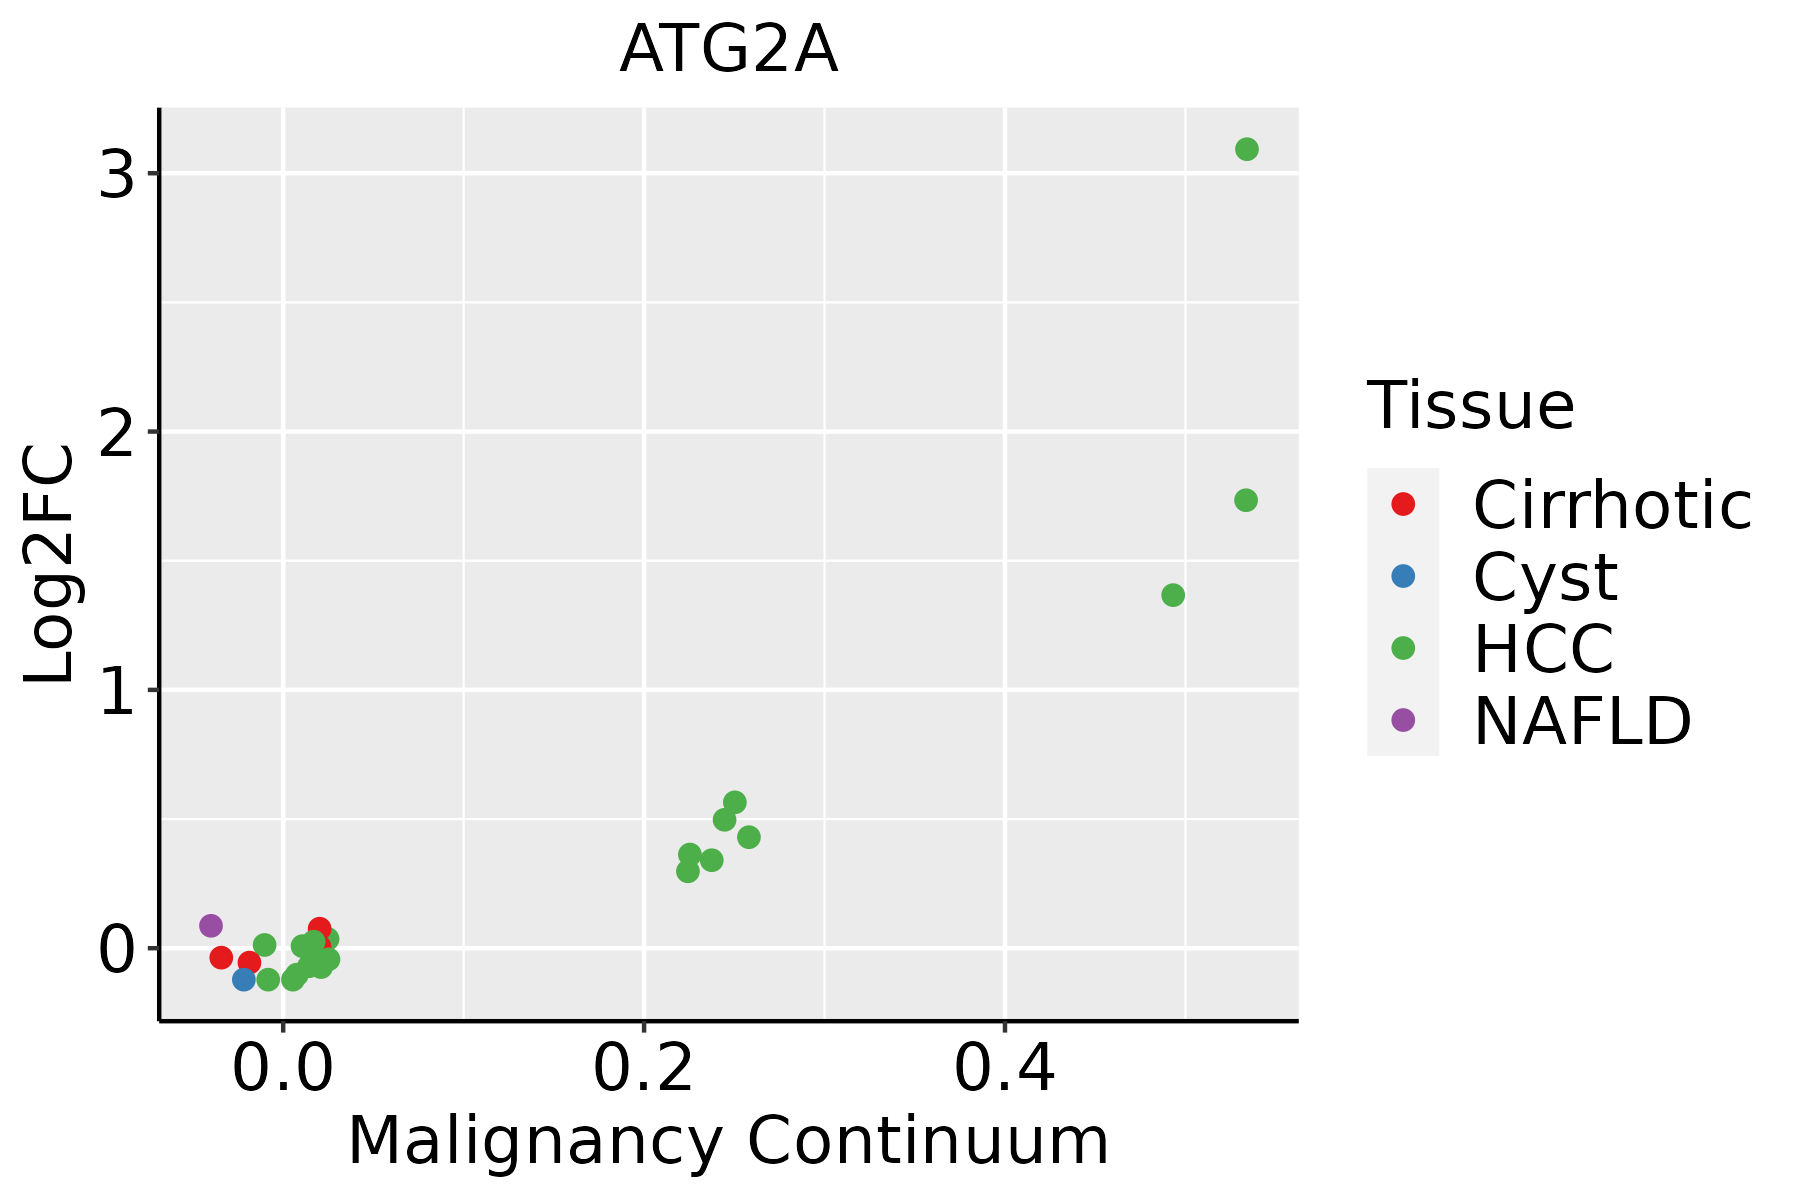 | HCC: Hepatocellular carcinoma |
| NAFLD: Non-alcoholic fatty liver disease | ||
| Oral Cavity | 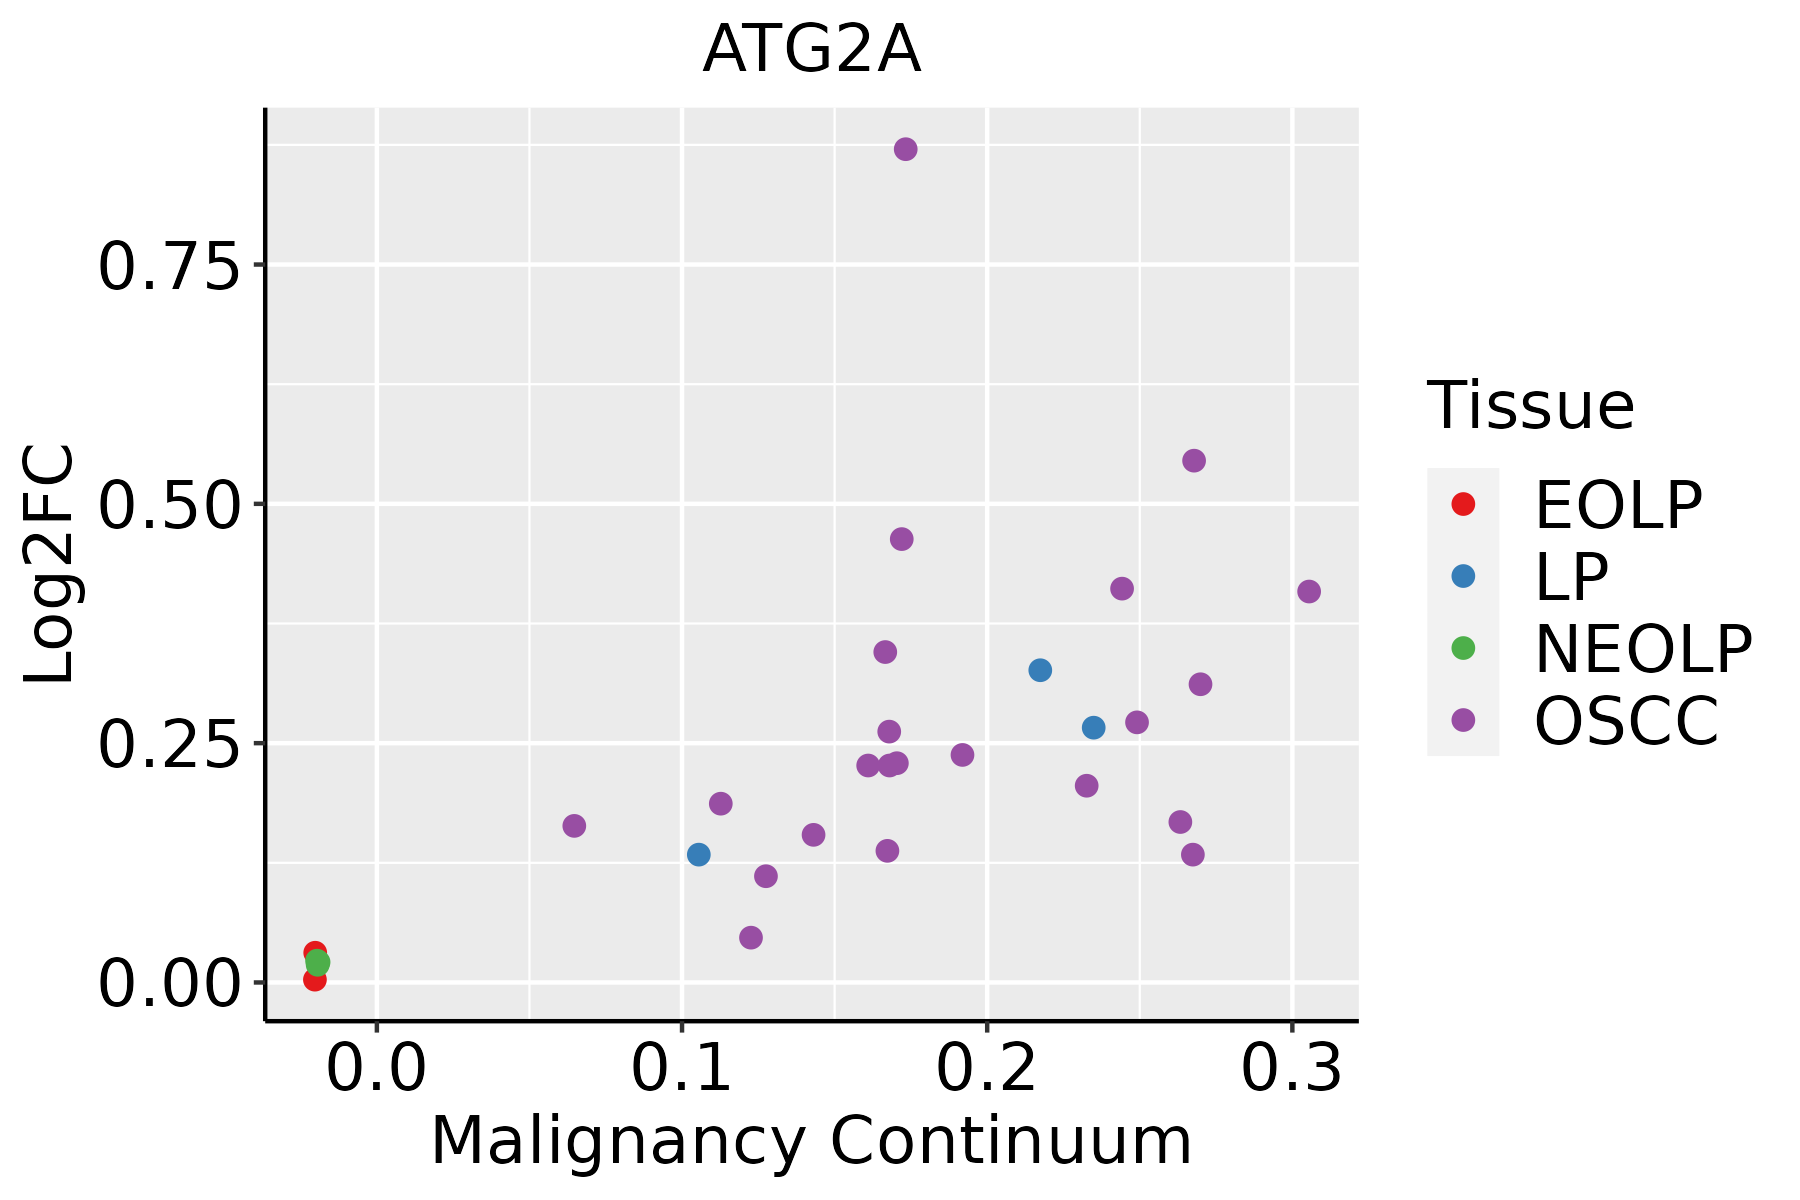 | EOLP: Erosive Oral lichen planus |
| LP: leukoplakia | ||
| NEOLP: Non-erosive oral lichen planus | ||
| OSCC: Oral squamous cell carcinoma |
| ∗log2FC in expression of this searched gene in stem-like cells from each diseased tissue sample relative to stem-like cells in normal samples in each tissue plotted against the malignancy continuum. Samples are colored based on if they are from different disease stage. |
Top |
Malignant transformation related pathway analysis |
| Find out the enriched GO biological processes and KEGG pathways involved in transition from healthy to precancer to cancer |
| Tissue | Disease Stage | Enriched GO biological Processes |
| Colorectum | AD |  |
| Colorectum | SER |  |
| Colorectum | MSS |  |
| Colorectum | MSI-H |  |
| Colorectum | FAP |  |
| ∗Top 15 enriched GO BP terms are showed in the bar plot of each disease state in each tissue. Each row represents a significant GO biological process which is colored according to the -log10(p.adjust). |
| Page: 1 2 3 4 5 6 7 8 9 |
| GO ID | Tissue | Disease Stage | Description | Gene Ratio | Bg Ratio | pvalue | p.adjust | Count |
| GO:001623617 | Esophagus | ESCC | macroautophagy | 216/8552 | 291/18723 | 1.94e-23 | 4.57e-21 | 216 |
| GO:0022411111 | Esophagus | ESCC | cellular component disassembly | 305/8552 | 443/18723 | 1.94e-23 | 4.57e-21 | 305 |
| GO:190300816 | Esophagus | ESCC | organelle disassembly | 89/8552 | 114/18723 | 1.36e-12 | 5.80e-11 | 89 |
| GO:000703314 | Esophagus | ESCC | vacuole organization | 127/8552 | 180/18723 | 1.04e-11 | 3.85e-10 | 127 |
| GO:000042217 | Esophagus | ESCC | autophagy of mitochondrion | 63/8552 | 81/18723 | 3.41e-09 | 7.24e-08 | 63 |
| GO:006172617 | Esophagus | ESCC | mitochondrion disassembly | 63/8552 | 81/18723 | 3.41e-09 | 7.24e-08 | 63 |
| GO:190503712 | Esophagus | ESCC | autophagosome organization | 73/8552 | 103/18723 | 1.88e-07 | 2.93e-06 | 73 |
| GO:000004513 | Esophagus | ESCC | autophagosome assembly | 69/8552 | 99/18723 | 1.10e-06 | 1.38e-05 | 69 |
| GO:006191215 | Esophagus | ESCC | selective autophagy | 47/8552 | 68/18723 | 7.81e-05 | 5.80e-04 | 47 |
| GO:00224117 | Liver | Cirrhotic | cellular component disassembly | 182/4634 | 443/18723 | 1.59e-14 | 1.54e-12 | 182 |
| GO:001623611 | Liver | Cirrhotic | macroautophagy | 129/4634 | 291/18723 | 1.75e-13 | 1.41e-11 | 129 |
| GO:19030084 | Liver | Cirrhotic | organelle disassembly | 59/4634 | 114/18723 | 4.82e-10 | 2.27e-08 | 59 |
| GO:00070332 | Liver | Cirrhotic | vacuole organization | 80/4634 | 180/18723 | 5.73e-09 | 2.25e-07 | 80 |
| GO:00004225 | Liver | Cirrhotic | autophagy of mitochondrion | 43/4634 | 81/18723 | 4.02e-08 | 1.31e-06 | 43 |
| GO:00617265 | Liver | Cirrhotic | mitochondrion disassembly | 43/4634 | 81/18723 | 4.02e-08 | 1.31e-06 | 43 |
| GO:0000045 | Liver | Cirrhotic | autophagosome assembly | 43/4634 | 99/18723 | 3.56e-05 | 4.32e-04 | 43 |
| GO:1905037 | Liver | Cirrhotic | autophagosome organization | 44/4634 | 103/18723 | 4.74e-05 | 5.50e-04 | 44 |
| GO:00619124 | Liver | Cirrhotic | selective autophagy | 30/4634 | 68/18723 | 3.72e-04 | 3.12e-03 | 30 |
| GO:001623621 | Liver | HCC | macroautophagy | 204/7958 | 291/18723 | 8.66e-22 | 1.41e-19 | 204 |
| GO:002241112 | Liver | HCC | cellular component disassembly | 282/7958 | 443/18723 | 1.02e-19 | 1.38e-17 | 282 |
| Page: 1 2 3 |
| Pathway ID | Tissue | Disease Stage | Description | Gene Ratio | Bg Ratio | pvalue | p.adjust | qvalue | Count |
| hsa05014210 | Esophagus | ESCC | Amyotrophic lateral sclerosis | 266/4205 | 364/8465 | 1.31e-20 | 2.20e-18 | 1.13e-18 | 266 |
| hsa05016210 | Esophagus | ESCC | Huntington disease | 226/4205 | 306/8465 | 1.38e-18 | 8.72e-17 | 4.46e-17 | 226 |
| hsa05022210 | Esophagus | ESCC | Pathways of neurodegeneration - multiple diseases | 318/4205 | 476/8465 | 6.10e-15 | 2.04e-13 | 1.05e-13 | 318 |
| hsa05010210 | Esophagus | ESCC | Alzheimer disease | 263/4205 | 384/8465 | 1.80e-14 | 5.47e-13 | 2.80e-13 | 263 |
| hsa0414010 | Esophagus | ESCC | Autophagy - animal | 101/4205 | 141/8465 | 7.60e-08 | 6.21e-07 | 3.18e-07 | 101 |
| hsa0501728 | Esophagus | ESCC | Spinocerebellar ataxia | 94/4205 | 143/8465 | 6.77e-05 | 2.90e-04 | 1.48e-04 | 94 |
| hsa041362 | Esophagus | ESCC | Autophagy - other | 23/4205 | 32/8465 | 8.99e-03 | 2.14e-02 | 1.09e-02 | 23 |
| hsa0501438 | Esophagus | ESCC | Amyotrophic lateral sclerosis | 266/4205 | 364/8465 | 1.31e-20 | 2.20e-18 | 1.13e-18 | 266 |
| hsa0501638 | Esophagus | ESCC | Huntington disease | 226/4205 | 306/8465 | 1.38e-18 | 8.72e-17 | 4.46e-17 | 226 |
| hsa0502238 | Esophagus | ESCC | Pathways of neurodegeneration - multiple diseases | 318/4205 | 476/8465 | 6.10e-15 | 2.04e-13 | 1.05e-13 | 318 |
| hsa0501038 | Esophagus | ESCC | Alzheimer disease | 263/4205 | 384/8465 | 1.80e-14 | 5.47e-13 | 2.80e-13 | 263 |
| hsa0414015 | Esophagus | ESCC | Autophagy - animal | 101/4205 | 141/8465 | 7.60e-08 | 6.21e-07 | 3.18e-07 | 101 |
| hsa0501736 | Esophagus | ESCC | Spinocerebellar ataxia | 94/4205 | 143/8465 | 6.77e-05 | 2.90e-04 | 1.48e-04 | 94 |
| hsa0413611 | Esophagus | ESCC | Autophagy - other | 23/4205 | 32/8465 | 8.99e-03 | 2.14e-02 | 1.09e-02 | 23 |
| hsa0501614 | Liver | Cirrhotic | Huntington disease | 172/2530 | 306/8465 | 1.65e-22 | 1.10e-20 | 6.77e-21 | 172 |
| hsa0501414 | Liver | Cirrhotic | Amyotrophic lateral sclerosis | 187/2530 | 364/8465 | 1.56e-18 | 6.50e-17 | 4.01e-17 | 187 |
| hsa0502214 | Liver | Cirrhotic | Pathways of neurodegeneration - multiple diseases | 217/2530 | 476/8465 | 7.30e-14 | 2.03e-12 | 1.25e-12 | 217 |
| hsa0501014 | Liver | Cirrhotic | Alzheimer disease | 180/2530 | 384/8465 | 5.52e-13 | 1.36e-11 | 8.36e-12 | 180 |
| hsa0501710 | Liver | Cirrhotic | Spinocerebellar ataxia | 66/2530 | 143/8465 | 2.58e-05 | 2.15e-04 | 1.32e-04 | 66 |
| hsa041406 | Liver | Cirrhotic | Autophagy - animal | 65/2530 | 141/8465 | 3.10e-05 | 2.47e-04 | 1.52e-04 | 65 |
| Page: 1 2 3 4 |
Top |
Cell-cell communication analysis |
| Identification of potential cell-cell interactions between two cell types and their ligand-receptor pairs for different disease states |
| Ligand | Receptor | LRpair | Pathway | Tissue | Disease Stage |
| Page: 1 |
Top |
Single-cell gene regulatory network inference analysis |
| Find out the significant the regulons (TFs) and the target genes of each regulon across cell types for different disease states |
| TF | Cell Type | Tissue | Disease Stage | Target Gene | RSS | Regulon Activity |
| ∗The dot plots of a searched regulon are shown for all cell subpopulations in each disease state of each tissue based on the regulon specific score inferred using pySCENIC and by calculating the average expression. |
| Page: 1 |
Top |
Somatic mutation of malignant transformation related genes |
| Annotation of somatic variants for genes involved in malignant transformation |
| Hugo Symbol | Variant Class | Variant Classification | dbSNP RS | HGVSc | HGVSp | HGVSp Short | SWISSPROT | BIOTYPE | SIFT | PolyPhen | Tumor Sample Barcode | Tissue | Histology | Sex | Age | Stage | Therapy Types | Drugs | Outcome |
| ATG2A | SNV | Missense_Mutation | novel | c.5632G>A | p.Glu1878Lys | p.E1878K | Q2TAZ0 | protein_coding | deleterious(0) | probably_damaging(0.996) | TCGA-3C-AALI-01 | Breast | breast invasive carcinoma | Female | <65 | I/II | Unspecific | Poly E | Complete Response |
| ATG2A | SNV | Missense_Mutation | rs147085310 | c.5116G>A | p.Glu1706Lys | p.E1706K | Q2TAZ0 | protein_coding | deleterious(0) | probably_damaging(0.986) | TCGA-3C-AALI-01 | Breast | breast invasive carcinoma | Female | <65 | I/II | Unspecific | Poly E | Complete Response |
| ATG2A | SNV | Missense_Mutation | novel | c.2403N>G | p.Phe801Leu | p.F801L | Q2TAZ0 | protein_coding | deleterious(0) | probably_damaging(0.956) | TCGA-5L-AAT1-01 | Breast | breast invasive carcinoma | Female | <65 | III/IV | Hormone Therapy | letrozol | SD |
| ATG2A | SNV | Missense_Mutation | c.3017N>G | p.Leu1006Arg | p.L1006R | Q2TAZ0 | protein_coding | deleterious(0) | probably_damaging(0.987) | TCGA-A1-A0SK-01 | Breast | breast invasive carcinoma | Female | <65 | I/II | Unknown | Unknown | PD | |
| ATG2A | SNV | Missense_Mutation | c.4673N>C | p.Leu1558Pro | p.L1558P | Q2TAZ0 | protein_coding | deleterious(0) | probably_damaging(0.998) | TCGA-A8-A07J-01 | Breast | breast invasive carcinoma | Female | <65 | I/II | Chemotherapy | 5-fluorouracil | CR | |
| ATG2A | SNV | Missense_Mutation | rs748773349 | c.2981G>A | p.Arg994Gln | p.R994Q | Q2TAZ0 | protein_coding | tolerated(0.8) | benign(0.001) | TCGA-AC-A23H-01 | Breast | breast invasive carcinoma | Female | >=65 | I/II | Unknown | Unknown | PD |
| ATG2A | SNV | Missense_Mutation | c.2847G>T | p.Lys949Asn | p.K949N | Q2TAZ0 | protein_coding | tolerated(0.49) | benign(0.015) | TCGA-AR-A251-01 | Breast | breast invasive carcinoma | Female | <65 | III/IV | Chemotherapy | doxorubicin | SD | |
| ATG2A | SNV | Missense_Mutation | novel | c.2563C>A | p.Pro855Thr | p.P855T | Q2TAZ0 | protein_coding | tolerated(0.19) | benign(0) | TCGA-E2-A14V-01 | Breast | breast invasive carcinoma | Female | <65 | I/II | Chemotherapy | cyclophosphamide | SD |
| ATG2A | insertion | Frame_Shift_Ins | novel | c.5253_5254insGTTCTGTCCT | p.His1752ValfsTer22 | p.H1752Vfs*22 | Q2TAZ0 | protein_coding | TCGA-B6-A0I6-01 | Breast | breast invasive carcinoma | Female | <65 | I/II | Unknown | Unknown | PD | ||
| ATG2A | insertion | Frame_Shift_Ins | novel | c.3825_3826insCC | p.Ala1276ProfsTer63 | p.A1276Pfs*63 | Q2TAZ0 | protein_coding | TCGA-BH-A0HU-01 | Breast | breast invasive carcinoma | Female | <65 | I/II | Chemotherapy | docetaxel | SD |
| Page: 1 2 3 4 5 6 7 8 9 10 11 12 13 14 15 16 |
Top |
Related drugs of malignant transformation related genes |
| Identification of chemicals and drugs interact with genes involved in malignant transfromation |
| (DGIdb 4.0) |
| Entrez ID | Symbol | Category | Interaction Types | Drug Claim Name | Drug Name | PMIDs |
| Page: 1 |

Copyright 2023-Present -The University of Texas Health Science Center at Houston |