
|
|||||
|
 | |
| |
| |
| |
| |
| |
|
Gene: ATG12 |
Gene summary for ATG12 |
| Gene information | Species | Human | Gene symbol | ATG12 | Gene ID | 9140 |
| Gene name | autophagy related 12 | |
| Gene Alias | APG12 | |
| Cytomap | 5q22.3 | |
| Gene Type | protein-coding | GO ID | GO:0000045 | UniProtAcc | O94817 |
Top |
Malignant transformation analysis |
| Identification of the aberrant gene expression in precancerous and cancerous lesions by comparing the gene expression of stem-like cells in diseased tissues with normal stem cells |
| Entrez ID | Symbol | Replicates | Species | Organ | Tissue | Adj P-value | Log2FC | Malignancy |
| 9140 | ATG12 | LZE2T | Human | Esophagus | ESCC | 9.36e-06 | 6.27e-01 | 0.082 |
| 9140 | ATG12 | LZE4T | Human | Esophagus | ESCC | 1.90e-16 | 4.17e-01 | 0.0811 |
| 9140 | ATG12 | LZE7T | Human | Esophagus | ESCC | 3.81e-07 | 3.88e-01 | 0.0667 |
| 9140 | ATG12 | LZE8T | Human | Esophagus | ESCC | 1.95e-09 | 2.44e-01 | 0.067 |
| 9140 | ATG12 | LZE20T | Human | Esophagus | ESCC | 1.04e-05 | 1.22e-01 | 0.0662 |
| 9140 | ATG12 | LZE24T | Human | Esophagus | ESCC | 5.15e-24 | 7.57e-01 | 0.0596 |
| 9140 | ATG12 | LZE21T | Human | Esophagus | ESCC | 1.47e-05 | 2.38e-01 | 0.0655 |
| 9140 | ATG12 | LZE6T | Human | Esophagus | ESCC | 8.65e-09 | 4.37e-01 | 0.0845 |
| 9140 | ATG12 | P1T-E | Human | Esophagus | ESCC | 4.93e-07 | 6.36e-01 | 0.0875 |
| 9140 | ATG12 | P2T-E | Human | Esophagus | ESCC | 4.56e-29 | 5.98e-01 | 0.1177 |
| 9140 | ATG12 | P4T-E | Human | Esophagus | ESCC | 1.67e-35 | 9.01e-01 | 0.1323 |
| 9140 | ATG12 | P5T-E | Human | Esophagus | ESCC | 4.60e-24 | 3.72e-01 | 0.1327 |
| 9140 | ATG12 | P8T-E | Human | Esophagus | ESCC | 1.87e-29 | 5.97e-01 | 0.0889 |
| 9140 | ATG12 | P9T-E | Human | Esophagus | ESCC | 2.18e-24 | 5.53e-01 | 0.1131 |
| 9140 | ATG12 | P10T-E | Human | Esophagus | ESCC | 2.33e-28 | 4.72e-01 | 0.116 |
| 9140 | ATG12 | P11T-E | Human | Esophagus | ESCC | 6.93e-20 | 5.77e-01 | 0.1426 |
| 9140 | ATG12 | P12T-E | Human | Esophagus | ESCC | 1.36e-43 | 7.24e-01 | 0.1122 |
| 9140 | ATG12 | P15T-E | Human | Esophagus | ESCC | 6.13e-42 | 9.35e-01 | 0.1149 |
| 9140 | ATG12 | P16T-E | Human | Esophagus | ESCC | 8.22e-16 | 1.09e-01 | 0.1153 |
| 9140 | ATG12 | P17T-E | Human | Esophagus | ESCC | 5.75e-11 | 4.90e-01 | 0.1278 |
| Page: 1 2 3 4 5 6 7 |
| Tissue | Expression Dynamics | Abbreviation |
| Esophagus | 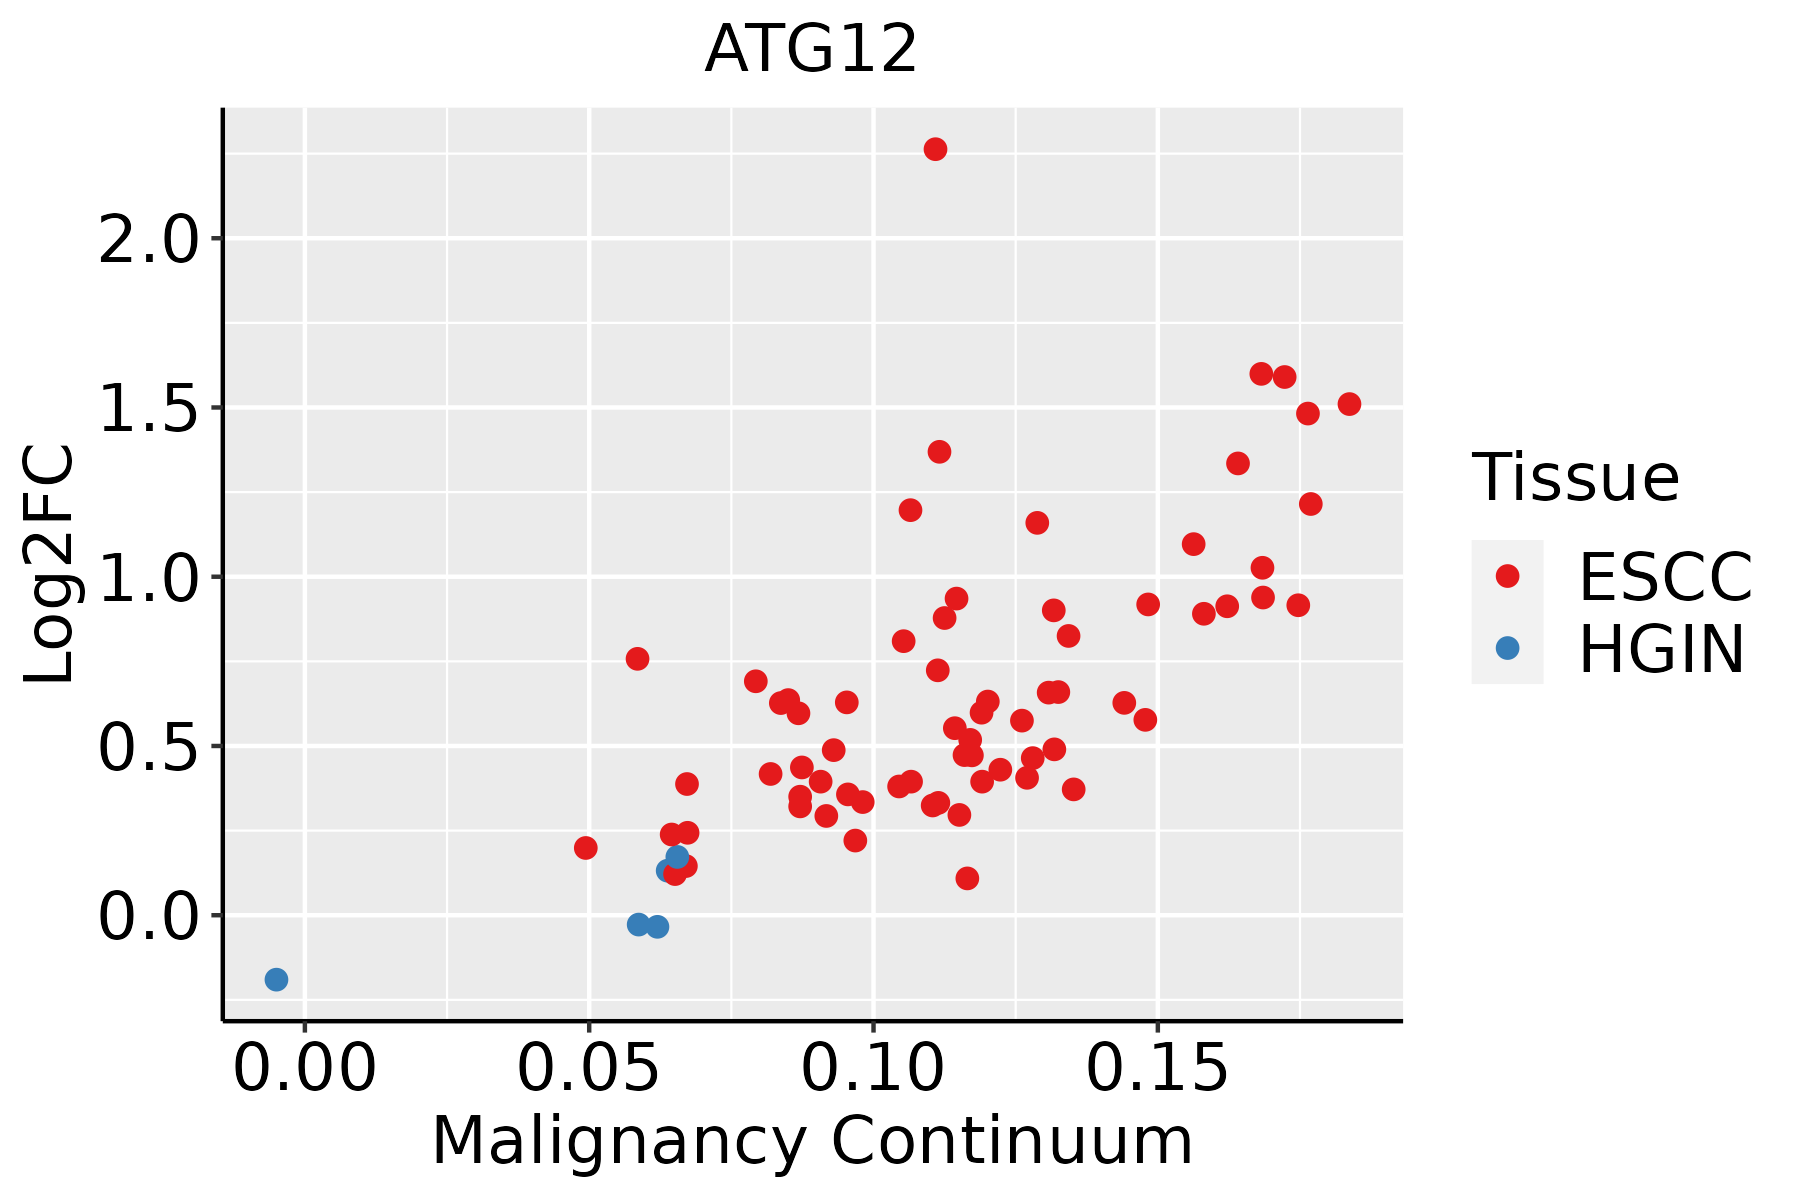 | ESCC: Esophageal squamous cell carcinoma |
| HGIN: High-grade intraepithelial neoplasias | ||
| LGIN: Low-grade intraepithelial neoplasias | ||
| Liver | 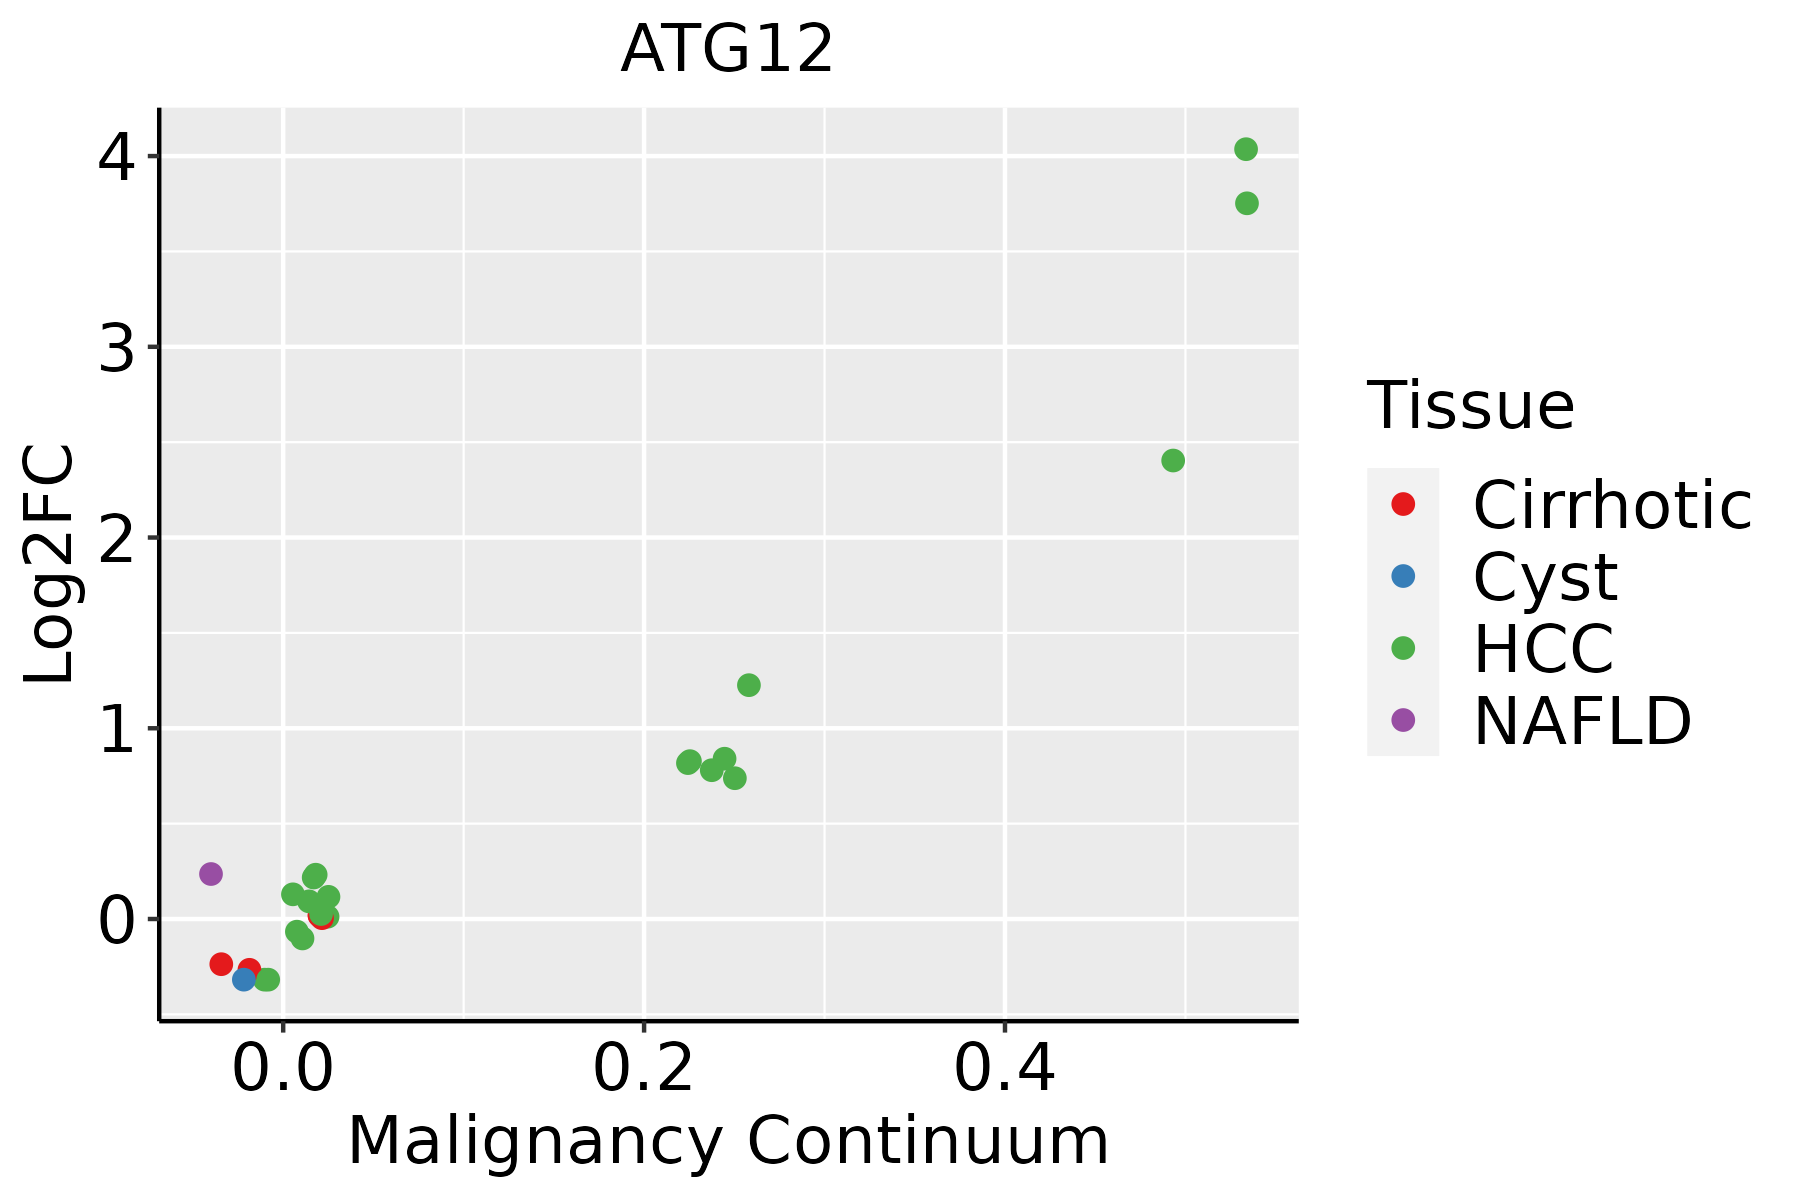 | HCC: Hepatocellular carcinoma |
| NAFLD: Non-alcoholic fatty liver disease | ||
| Oral Cavity | 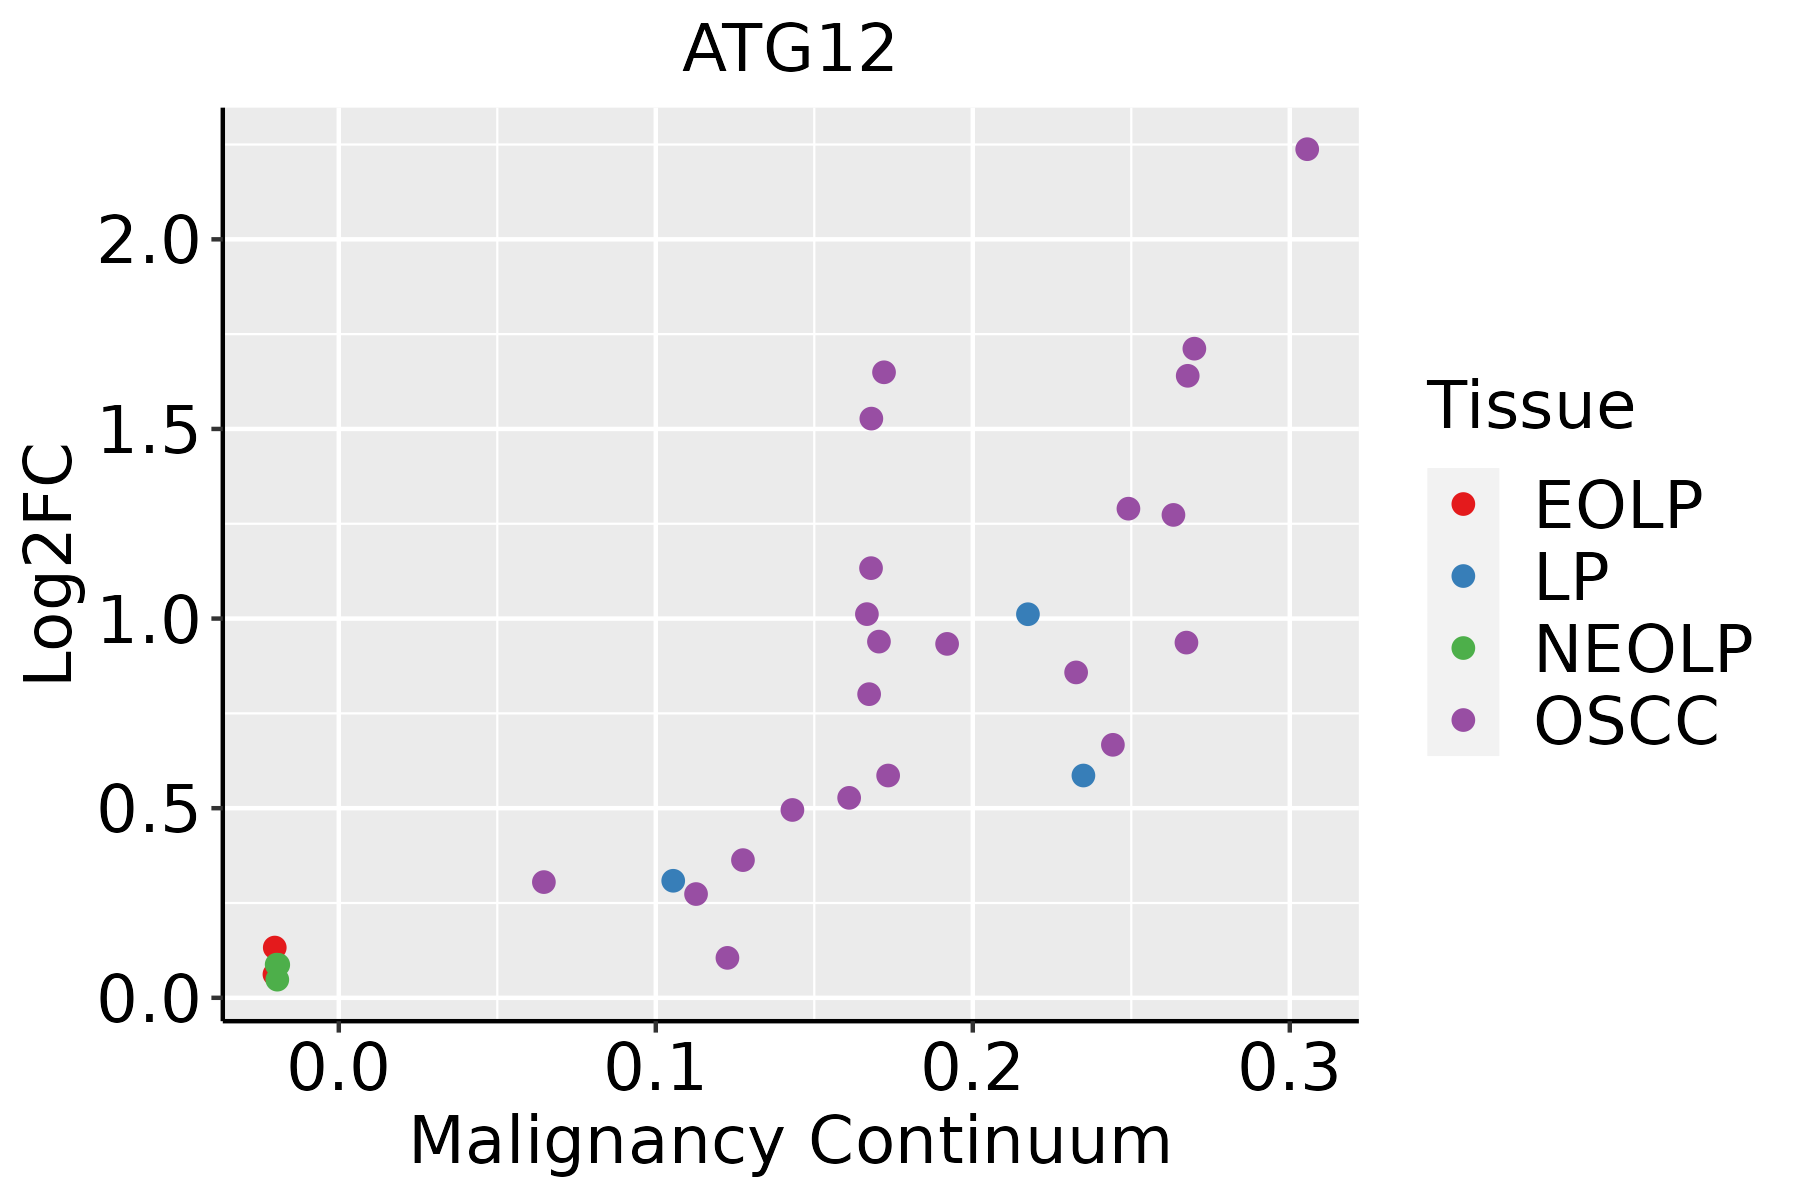 | EOLP: Erosive Oral lichen planus |
| LP: leukoplakia | ||
| NEOLP: Non-erosive oral lichen planus | ||
| OSCC: Oral squamous cell carcinoma | ||
| Skin |  | AK: Actinic keratosis |
| cSCC: Cutaneous squamous cell carcinoma | ||
| SCCIS:squamous cell carcinoma in situ | ||
| Thyroid |  | ATC: Anaplastic thyroid cancer |
| HT: Hashimoto's thyroiditis | ||
| PTC: Papillary thyroid cancer |
| ∗log2FC in expression of this searched gene in stem-like cells from each diseased tissue sample relative to stem-like cells in normal samples in each tissue plotted against the malignancy continuum. Samples are colored based on if they are from different disease stage. |
Top |
Malignant transformation related pathway analysis |
| Find out the enriched GO biological processes and KEGG pathways involved in transition from healthy to precancer to cancer |
| Tissue | Disease Stage | Enriched GO biological Processes |
| Colorectum | AD |  |
| Colorectum | SER |  |
| Colorectum | MSS |  |
| Colorectum | MSI-H |  |
| Colorectum | FAP |  |
| ∗Top 15 enriched GO BP terms are showed in the bar plot of each disease state in each tissue. Each row represents a significant GO biological process which is colored according to the -log10(p.adjust). |
| Page: 1 2 3 4 5 6 7 8 9 |
| GO ID | Tissue | Disease Stage | Description | Gene Ratio | Bg Ratio | pvalue | p.adjust | Count |
| GO:001623617 | Esophagus | ESCC | macroautophagy | 216/8552 | 291/18723 | 1.94e-23 | 4.57e-21 | 216 |
| GO:0022411111 | Esophagus | ESCC | cellular component disassembly | 305/8552 | 443/18723 | 1.94e-23 | 4.57e-21 | 305 |
| GO:190300816 | Esophagus | ESCC | organelle disassembly | 89/8552 | 114/18723 | 1.36e-12 | 5.80e-11 | 89 |
| GO:000703314 | Esophagus | ESCC | vacuole organization | 127/8552 | 180/18723 | 1.04e-11 | 3.85e-10 | 127 |
| GO:000042217 | Esophagus | ESCC | autophagy of mitochondrion | 63/8552 | 81/18723 | 3.41e-09 | 7.24e-08 | 63 |
| GO:006172617 | Esophagus | ESCC | mitochondrion disassembly | 63/8552 | 81/18723 | 3.41e-09 | 7.24e-08 | 63 |
| GO:190503712 | Esophagus | ESCC | autophagosome organization | 73/8552 | 103/18723 | 1.88e-07 | 2.93e-06 | 73 |
| GO:000004513 | Esophagus | ESCC | autophagosome assembly | 69/8552 | 99/18723 | 1.10e-06 | 1.38e-05 | 69 |
| GO:00421573 | Esophagus | ESCC | lipoprotein metabolic process | 86/8552 | 135/18723 | 1.78e-05 | 1.57e-04 | 86 |
| GO:00064973 | Esophagus | ESCC | protein lipidation | 62/8552 | 92/18723 | 2.08e-05 | 1.80e-04 | 62 |
| GO:00421583 | Esophagus | ESCC | lipoprotein biosynthetic process | 64/8552 | 96/18723 | 2.61e-05 | 2.20e-04 | 64 |
| GO:00224117 | Liver | Cirrhotic | cellular component disassembly | 182/4634 | 443/18723 | 1.59e-14 | 1.54e-12 | 182 |
| GO:001623611 | Liver | Cirrhotic | macroautophagy | 129/4634 | 291/18723 | 1.75e-13 | 1.41e-11 | 129 |
| GO:19030084 | Liver | Cirrhotic | organelle disassembly | 59/4634 | 114/18723 | 4.82e-10 | 2.27e-08 | 59 |
| GO:00070332 | Liver | Cirrhotic | vacuole organization | 80/4634 | 180/18723 | 5.73e-09 | 2.25e-07 | 80 |
| GO:00004225 | Liver | Cirrhotic | autophagy of mitochondrion | 43/4634 | 81/18723 | 4.02e-08 | 1.31e-06 | 43 |
| GO:00617265 | Liver | Cirrhotic | mitochondrion disassembly | 43/4634 | 81/18723 | 4.02e-08 | 1.31e-06 | 43 |
| GO:0000045 | Liver | Cirrhotic | autophagosome assembly | 43/4634 | 99/18723 | 3.56e-05 | 4.32e-04 | 43 |
| GO:1905037 | Liver | Cirrhotic | autophagosome organization | 44/4634 | 103/18723 | 4.74e-05 | 5.50e-04 | 44 |
| GO:0042157 | Liver | Cirrhotic | lipoprotein metabolic process | 53/4634 | 135/18723 | 1.32e-04 | 1.29e-03 | 53 |
| Page: 1 2 3 4 5 |
| Pathway ID | Tissue | Disease Stage | Description | Gene Ratio | Bg Ratio | pvalue | p.adjust | qvalue | Count |
| hsa05131211 | Esophagus | ESCC | Shigellosis | 176/4205 | 247/8465 | 2.27e-12 | 4.01e-11 | 2.05e-11 | 176 |
| hsa0414010 | Esophagus | ESCC | Autophagy - animal | 101/4205 | 141/8465 | 7.60e-08 | 6.21e-07 | 3.18e-07 | 101 |
| hsa040689 | Esophagus | ESCC | FoxO signaling pathway | 89/4205 | 131/8465 | 1.56e-05 | 7.98e-05 | 4.09e-05 | 89 |
| hsa05131310 | Esophagus | ESCC | Shigellosis | 176/4205 | 247/8465 | 2.27e-12 | 4.01e-11 | 2.05e-11 | 176 |
| hsa0414015 | Esophagus | ESCC | Autophagy - animal | 101/4205 | 141/8465 | 7.60e-08 | 6.21e-07 | 3.18e-07 | 101 |
| hsa0406814 | Esophagus | ESCC | FoxO signaling pathway | 89/4205 | 131/8465 | 1.56e-05 | 7.98e-05 | 4.09e-05 | 89 |
| hsa0513122 | Liver | Cirrhotic | Shigellosis | 105/2530 | 247/8465 | 1.31e-05 | 1.21e-04 | 7.48e-05 | 105 |
| hsa041406 | Liver | Cirrhotic | Autophagy - animal | 65/2530 | 141/8465 | 3.10e-05 | 2.47e-04 | 1.52e-04 | 65 |
| hsa040682 | Liver | Cirrhotic | FoxO signaling pathway | 52/2530 | 131/8465 | 9.98e-03 | 3.32e-02 | 2.05e-02 | 52 |
| hsa0513132 | Liver | Cirrhotic | Shigellosis | 105/2530 | 247/8465 | 1.31e-05 | 1.21e-04 | 7.48e-05 | 105 |
| hsa0414011 | Liver | Cirrhotic | Autophagy - animal | 65/2530 | 141/8465 | 3.10e-05 | 2.47e-04 | 1.52e-04 | 65 |
| hsa040683 | Liver | Cirrhotic | FoxO signaling pathway | 52/2530 | 131/8465 | 9.98e-03 | 3.32e-02 | 2.05e-02 | 52 |
| hsa0414021 | Liver | HCC | Autophagy - animal | 99/4020 | 141/8465 | 3.08e-08 | 4.70e-07 | 2.61e-07 | 99 |
| hsa0513142 | Liver | HCC | Shigellosis | 150/4020 | 247/8465 | 1.53e-05 | 1.04e-04 | 5.81e-05 | 150 |
| hsa040684 | Liver | HCC | FoxO signaling pathway | 85/4020 | 131/8465 | 3.99e-05 | 2.16e-04 | 1.20e-04 | 85 |
| hsa0414031 | Liver | HCC | Autophagy - animal | 99/4020 | 141/8465 | 3.08e-08 | 4.70e-07 | 2.61e-07 | 99 |
| hsa0513152 | Liver | HCC | Shigellosis | 150/4020 | 247/8465 | 1.53e-05 | 1.04e-04 | 5.81e-05 | 150 |
| hsa040685 | Liver | HCC | FoxO signaling pathway | 85/4020 | 131/8465 | 3.99e-05 | 2.16e-04 | 1.20e-04 | 85 |
| hsa041409 | Oral cavity | OSCC | Autophagy - animal | 94/3704 | 141/8465 | 2.73e-08 | 2.38e-07 | 1.21e-07 | 94 |
| hsa0513130 | Oral cavity | OSCC | Shigellosis | 150/3704 | 247/8465 | 3.96e-08 | 3.12e-07 | 1.59e-07 | 150 |
| Page: 1 2 |
Top |
Cell-cell communication analysis |
| Identification of potential cell-cell interactions between two cell types and their ligand-receptor pairs for different disease states |
| Ligand | Receptor | LRpair | Pathway | Tissue | Disease Stage |
| Page: 1 |
Top |
Single-cell gene regulatory network inference analysis |
| Find out the significant the regulons (TFs) and the target genes of each regulon across cell types for different disease states |
| TF | Cell Type | Tissue | Disease Stage | Target Gene | RSS | Regulon Activity |
| ∗The dot plots of a searched regulon are shown for all cell subpopulations in each disease state of each tissue based on the regulon specific score inferred using pySCENIC and by calculating the average expression. |
| Page: 1 |
Top |
Somatic mutation of malignant transformation related genes |
| Annotation of somatic variants for genes involved in malignant transformation |
| Hugo Symbol | Variant Class | Variant Classification | dbSNP RS | HGVSc | HGVSp | HGVSp Short | SWISSPROT | BIOTYPE | SIFT | PolyPhen | Tumor Sample Barcode | Tissue | Histology | Sex | Age | Stage | Therapy Types | Drugs | Outcome |
| ATG12 | SNV | Missense_Mutation | c.7N>C | p.Glu3Gln | p.E3Q | O94817 | protein_coding | deleterious_low_confidence(0.02) | probably_damaging(0.994) | TCGA-AC-A23H-01 | Breast | breast invasive carcinoma | Female | >=65 | I/II | Unknown | Unknown | PD | |
| ATG12 | insertion | Nonsense_Mutation | novel | c.45_46insCTTTAGTAGGAAGATAAAGATCATGTGTTCTAGATGC | p.Ala16LeufsTer2 | p.A16Lfs*2 | O94817 | protein_coding | TCGA-A2-A0CU-01 | Breast | breast invasive carcinoma | Female | >=65 | I/II | Hormone Therapy | tamoxiphen | SD | ||
| ATG12 | SNV | Missense_Mutation | c.187N>A | p.Gly63Arg | p.G63R | O94817 | protein_coding | deleterious(0.01) | probably_damaging(0.999) | TCGA-NH-A50U-01 | Colorectum | colon adenocarcinoma | Male | <65 | I/II | Ancillary | leucovorin | PD | |
| ATG12 | SNV | Missense_Mutation | rs372619984 | c.20N>G | p.Ser7Cys | p.S7C | O94817 | protein_coding | tolerated_low_confidence(0.06) | benign(0.343) | TCGA-DF-A2KS-01 | Endometrium | uterine corpus endometrioid carcinoma | Female | >=65 | I/II | Unknown | Unknown | PD |
| ATG12 | SNV | Missense_Mutation | novel | c.188G>A | p.Gly63Glu | p.G63E | O94817 | protein_coding | deleterious(0) | probably_damaging(0.998) | TCGA-56-A5DR-01 | Lung | lung squamous cell carcinoma | Male | >=65 | I/II | Unknown | Unknown | SD |
| ATG12 | SNV | Missense_Mutation | novel | c.235N>G | p.Arg79Gly | p.R79G | O94817 | protein_coding | deleterious(0.01) | possibly_damaging(0.601) | TCGA-94-7033-01 | Lung | lung squamous cell carcinoma | Male | >=65 | I/II | Chemotherapy | cisplatin | SD |
| ATG12 | SNV | Missense_Mutation | novel | c.55G>T | p.Gly19Trp | p.G19W | O94817 | protein_coding | deleterious(0) | probably_damaging(0.99) | TCGA-CV-7090-01 | Oral cavity | head & neck squamous cell carcinoma | Male | <65 | I/II | Unknown | Unknown | SD |
| ATG12 | SNV | Missense_Mutation | rs749744688 | c.14N>T | p.Pro5Leu | p.P5L | O94817 | protein_coding | deleterious_low_confidence(0.01) | benign(0.054) | TCGA-CH-5741-01 | Prostate | prostate adenocarcinoma | Male | <65 | 9 | Hormone Therapy | leuprorelin | CR |
| ATG12 | SNV | Missense_Mutation | c.269N>C | p.Lys90Thr | p.K90T | O94817 | protein_coding | deleterious(0) | probably_damaging(0.978) | TCGA-BR-8589-01 | Stomach | stomach adenocarcinoma | Male | <65 | III/IV | Unknown | Unknown | SD | |
| ATG12 | SNV | Missense_Mutation | novel | c.61G>C | p.Gly21Arg | p.G21R | O94817 | protein_coding | tolerated(0.12) | possibly_damaging(0.726) | TCGA-CG-5716-01 | Stomach | stomach adenocarcinoma | Male | >=65 | III/IV | Unknown | Unknown | SD |
| Page: 1 2 |
Top |
Related drugs of malignant transformation related genes |
| Identification of chemicals and drugs interact with genes involved in malignant transfromation |
| (DGIdb 4.0) |
| Entrez ID | Symbol | Category | Interaction Types | Drug Claim Name | Drug Name | PMIDs |
| Page: 1 |

Copyright 2023-Present -The University of Texas Health Science Center at Houston |