
|
|||||
|
 | |
| |
| |
| |
| |
| |
|
Gene: ATF7IP2 |
Gene summary for ATF7IP2 |
| Gene information | Species | Human | Gene symbol | ATF7IP2 | Gene ID | 80063 |
| Gene name | activating transcription factor 7 interacting protein 2 | |
| Gene Alias | MCAF2 | |
| Cytomap | 16p13.2-p13.13 | |
| Gene Type | protein-coding | GO ID | GO:0005575 | UniProtAcc | Q5U623 |
Top |
Malignant transformation analysis |
| Identification of the aberrant gene expression in precancerous and cancerous lesions by comparing the gene expression of stem-like cells in diseased tissues with normal stem cells |
| Entrez ID | Symbol | Replicates | Species | Organ | Tissue | Adj P-value | Log2FC | Malignancy |
| 80063 | ATF7IP2 | CCI_3 | Human | Cervix | CC | 7.12e-11 | 9.78e-01 | 0.516 |
| 80063 | ATF7IP2 | HTA11_3410_2000001011 | Human | Colorectum | AD | 2.57e-04 | 1.91e-02 | 0.0155 |
| 80063 | ATF7IP2 | HTA11_866_2000001011 | Human | Colorectum | AD | 1.15e-02 | 3.78e-01 | -0.1001 |
| 80063 | ATF7IP2 | HTA11_1391_2000001011 | Human | Colorectum | AD | 5.31e-14 | 7.26e-01 | -0.059 |
| 80063 | ATF7IP2 | HTA11_10711_2000001011 | Human | Colorectum | AD | 8.87e-04 | 3.57e-01 | 0.0338 |
| 80063 | ATF7IP2 | HTA11_7696_3000711011 | Human | Colorectum | AD | 1.59e-02 | 3.19e-01 | 0.0674 |
| 80063 | ATF7IP2 | HTA11_6818_2000001011 | Human | Colorectum | AD | 2.99e-02 | 3.07e-01 | 0.0112 |
| 80063 | ATF7IP2 | HTA11_99999965104_69814 | Human | Colorectum | MSS | 4.80e-08 | 7.36e-01 | 0.281 |
| 80063 | ATF7IP2 | F007 | Human | Colorectum | FAP | 1.42e-06 | 5.67e-01 | 0.1176 |
| 80063 | ATF7IP2 | A002-C-010 | Human | Colorectum | FAP | 8.28e-05 | -2.80e-01 | 0.242 |
| 80063 | ATF7IP2 | A015-C-203 | Human | Colorectum | FAP | 7.66e-08 | -8.95e-02 | -0.1294 |
| 80063 | ATF7IP2 | A015-C-204 | Human | Colorectum | FAP | 2.61e-02 | 3.09e-01 | -0.0228 |
| 80063 | ATF7IP2 | A002-C-201 | Human | Colorectum | FAP | 4.35e-16 | 5.86e-01 | 0.0324 |
| 80063 | ATF7IP2 | A001-C-108 | Human | Colorectum | FAP | 1.08e-04 | 9.83e-02 | -0.0272 |
| 80063 | ATF7IP2 | A002-C-205 | Human | Colorectum | FAP | 8.01e-07 | 1.96e-01 | -0.1236 |
| 80063 | ATF7IP2 | A015-C-006 | Human | Colorectum | FAP | 1.11e-02 | 7.32e-02 | -0.0994 |
| 80063 | ATF7IP2 | A002-C-114 | Human | Colorectum | FAP | 2.41e-03 | 3.55e-02 | -0.1561 |
| 80063 | ATF7IP2 | A015-C-104 | Human | Colorectum | FAP | 4.58e-08 | -1.12e-01 | -0.1899 |
| 80063 | ATF7IP2 | A015-C-202 | Human | Colorectum | FAP | 3.26e-06 | 3.42e-01 | -0.0849 |
| 80063 | ATF7IP2 | A001-C-014 | Human | Colorectum | FAP | 4.97e-02 | 1.33e-01 | 0.0135 |
| Page: 1 2 3 4 5 6 7 |
| Tissue | Expression Dynamics | Abbreviation |
| Cervix | 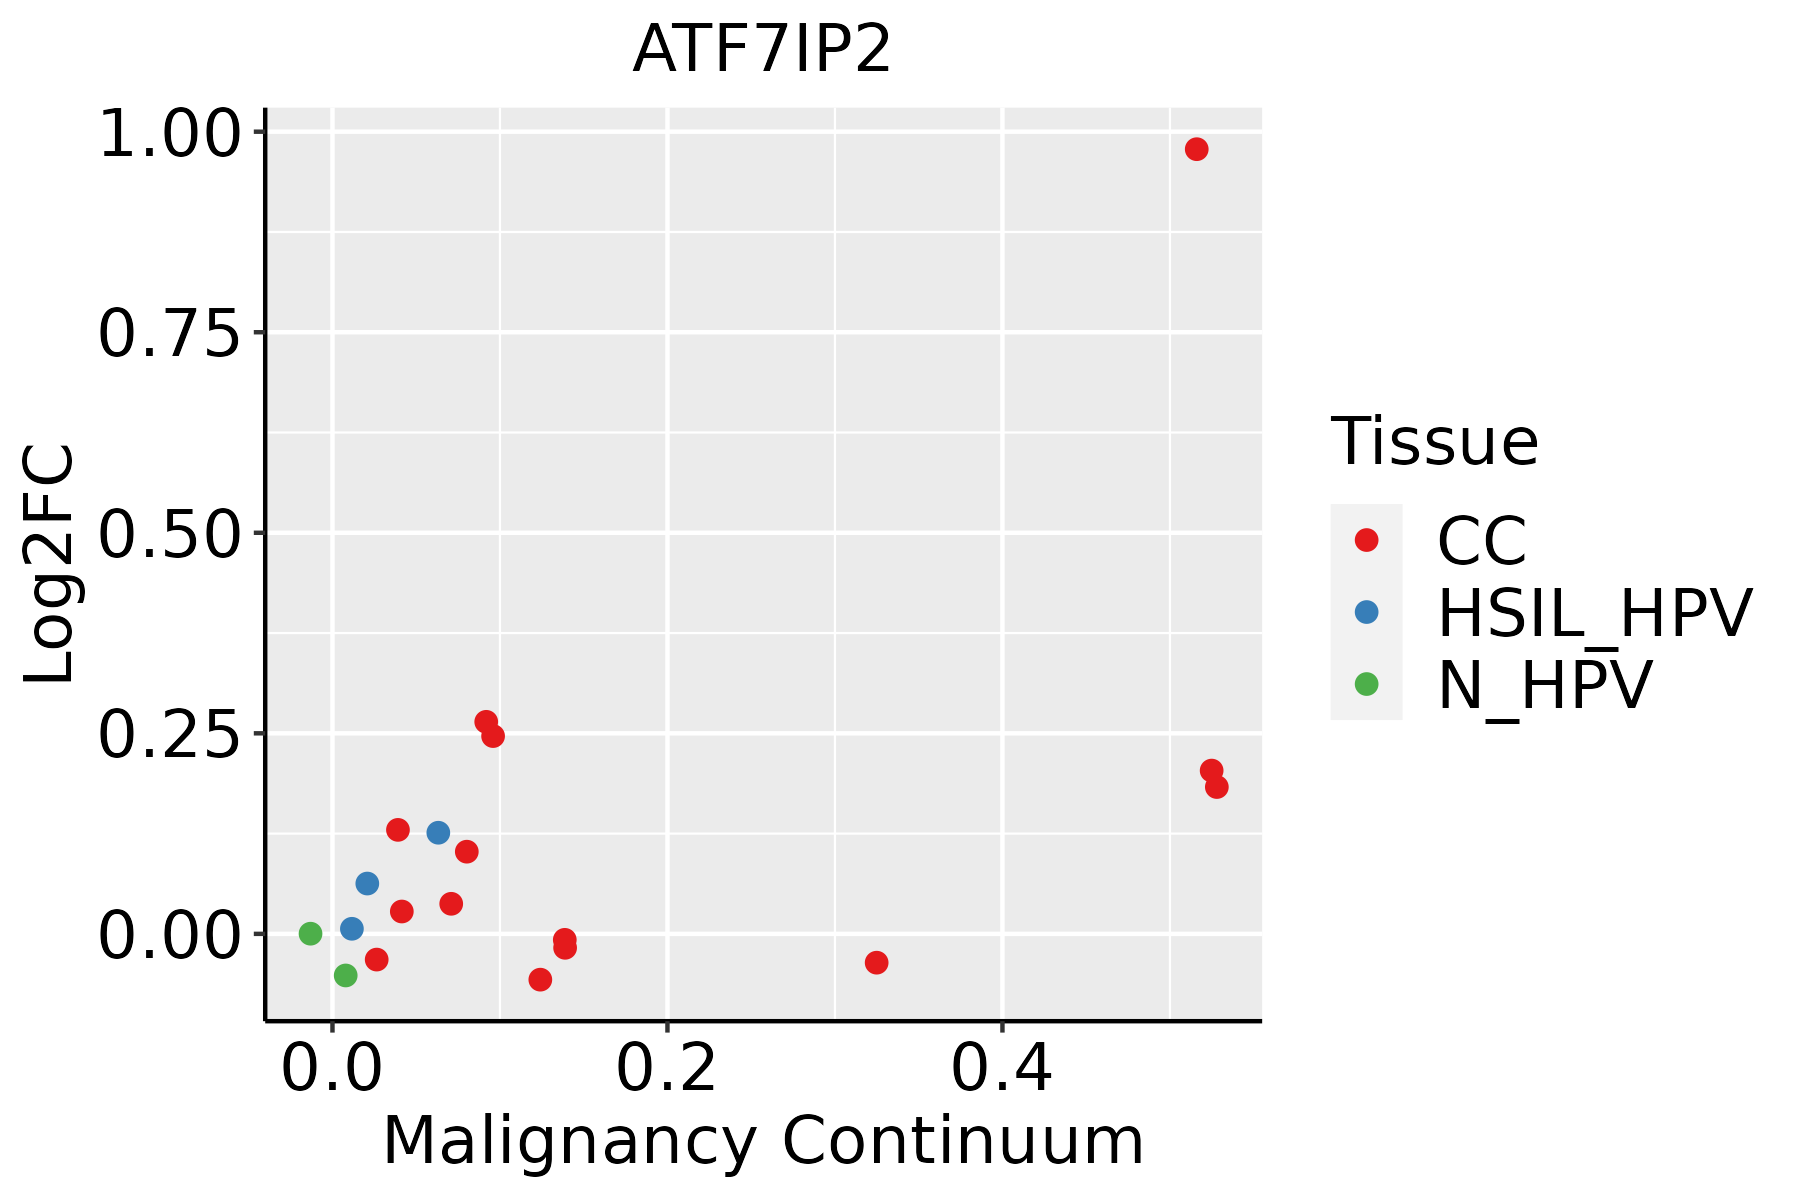 | CC: Cervix cancer |
| HSIL_HPV: HPV-infected high-grade squamous intraepithelial lesions | ||
| N_HPV: HPV-infected normal cervix | ||
| Colorectum (GSE201348) |  | FAP: Familial adenomatous polyposis |
| CRC: Colorectal cancer | ||
| Colorectum (HTA11) | 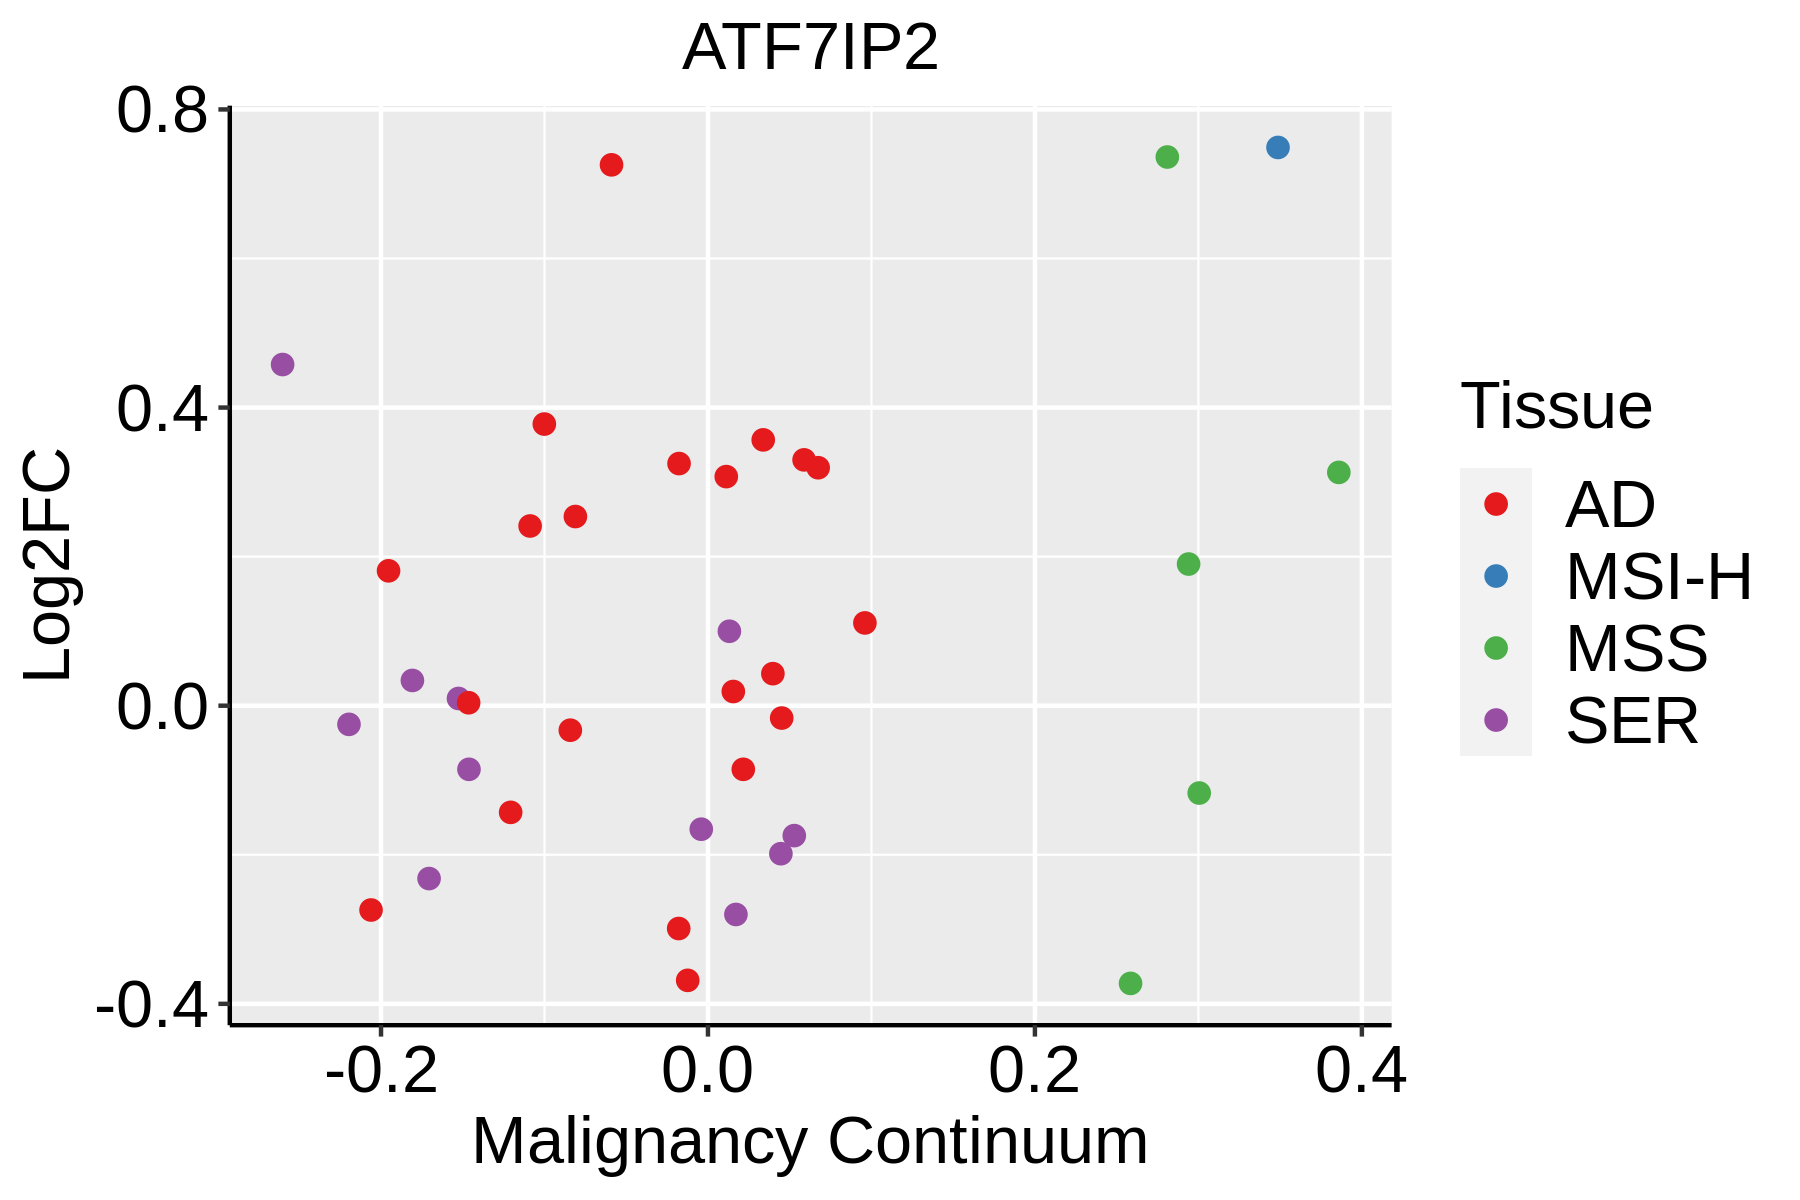 | AD: Adenomas |
| SER: Sessile serrated lesions | ||
| MSI-H: Microsatellite-high colorectal cancer | ||
| MSS: Microsatellite stable colorectal cancer | ||
| Esophagus |  | ESCC: Esophageal squamous cell carcinoma |
| HGIN: High-grade intraepithelial neoplasias | ||
| LGIN: Low-grade intraepithelial neoplasias | ||
| GC | 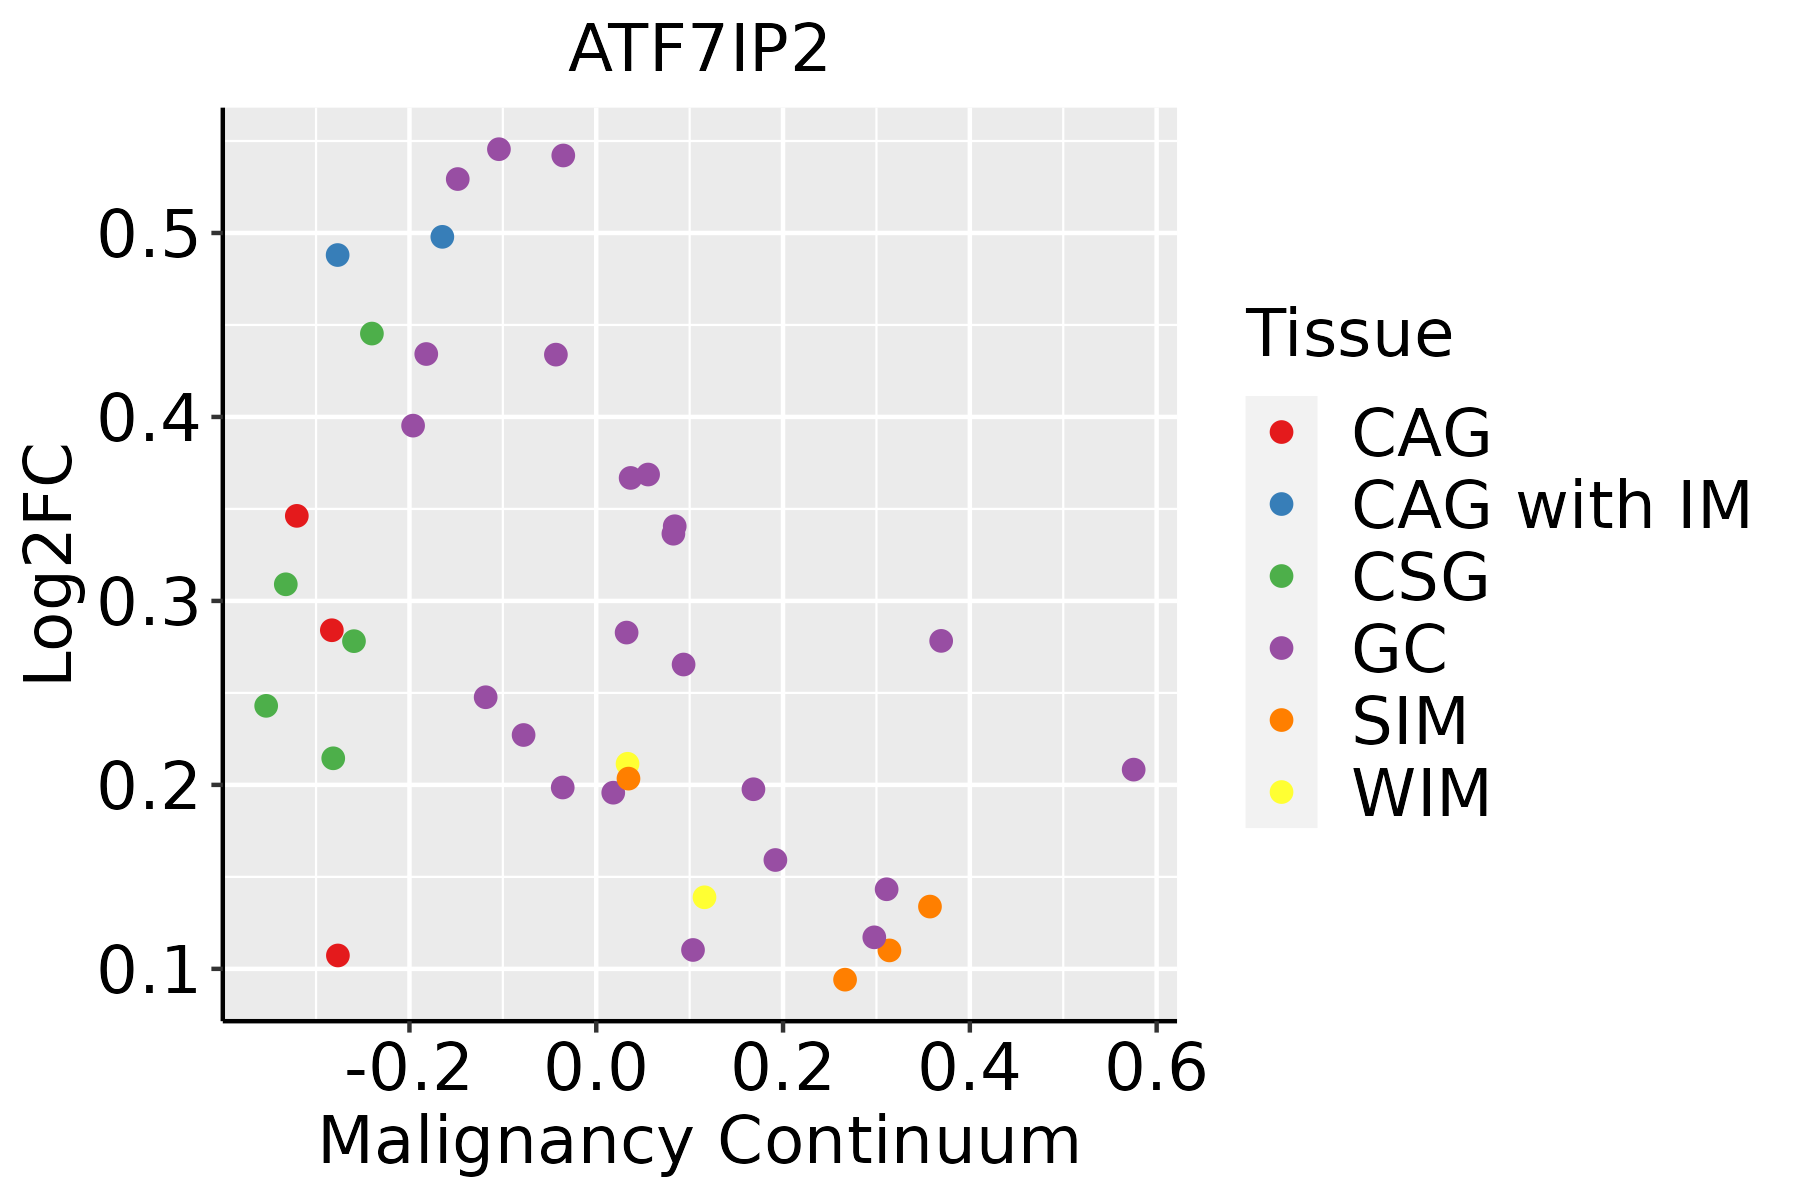 | CAG: Chronic atrophic gastritis |
| CAG with IM: Chronic atrophic gastritis with intestinal metaplasia | ||
| CSG: Chronic superficial gastritis | ||
| GC: Gastric cancer | ||
| SIM: Severe intestinal metaplasia | ||
| WIM: Wild intestinal metaplasia | ||
| Oral Cavity | 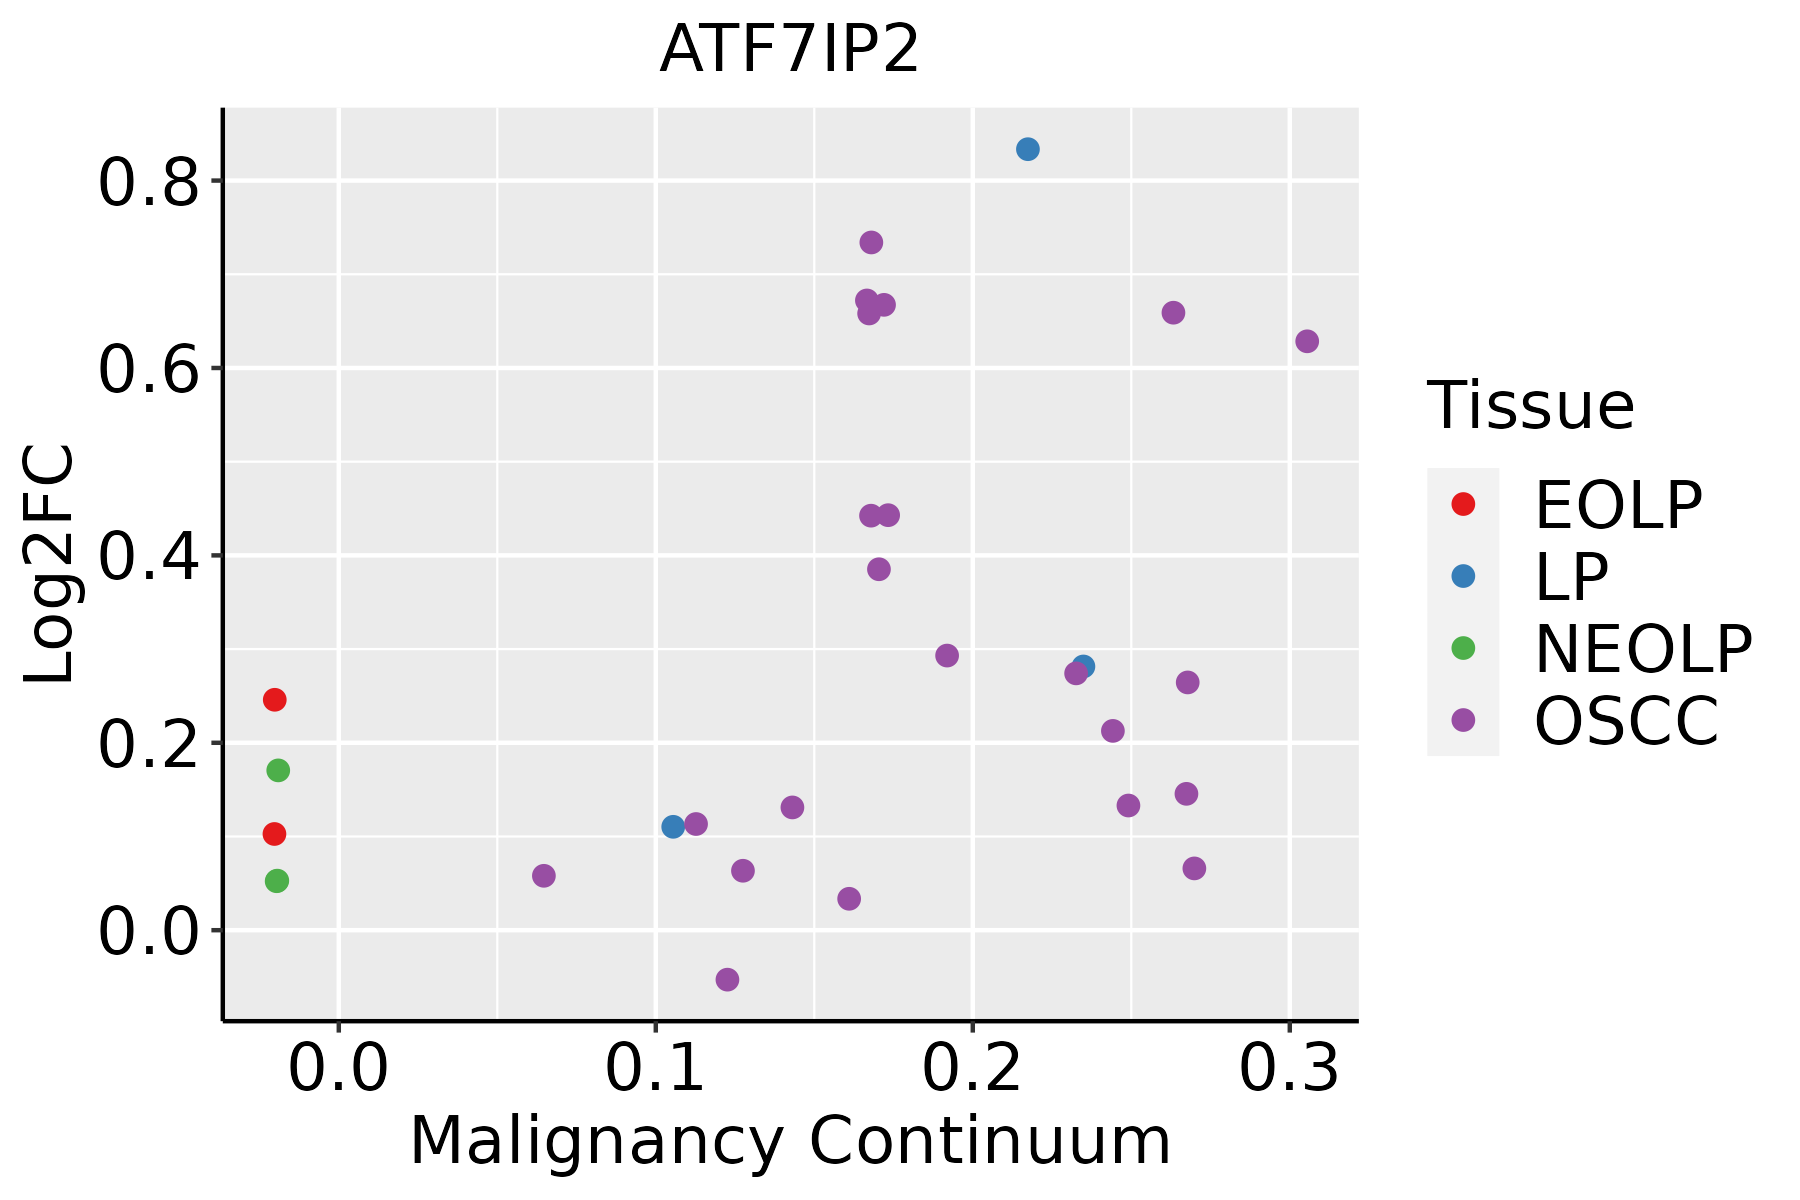 | EOLP: Erosive Oral lichen planus |
| LP: leukoplakia | ||
| NEOLP: Non-erosive oral lichen planus | ||
| OSCC: Oral squamous cell carcinoma | ||
| Thyroid | 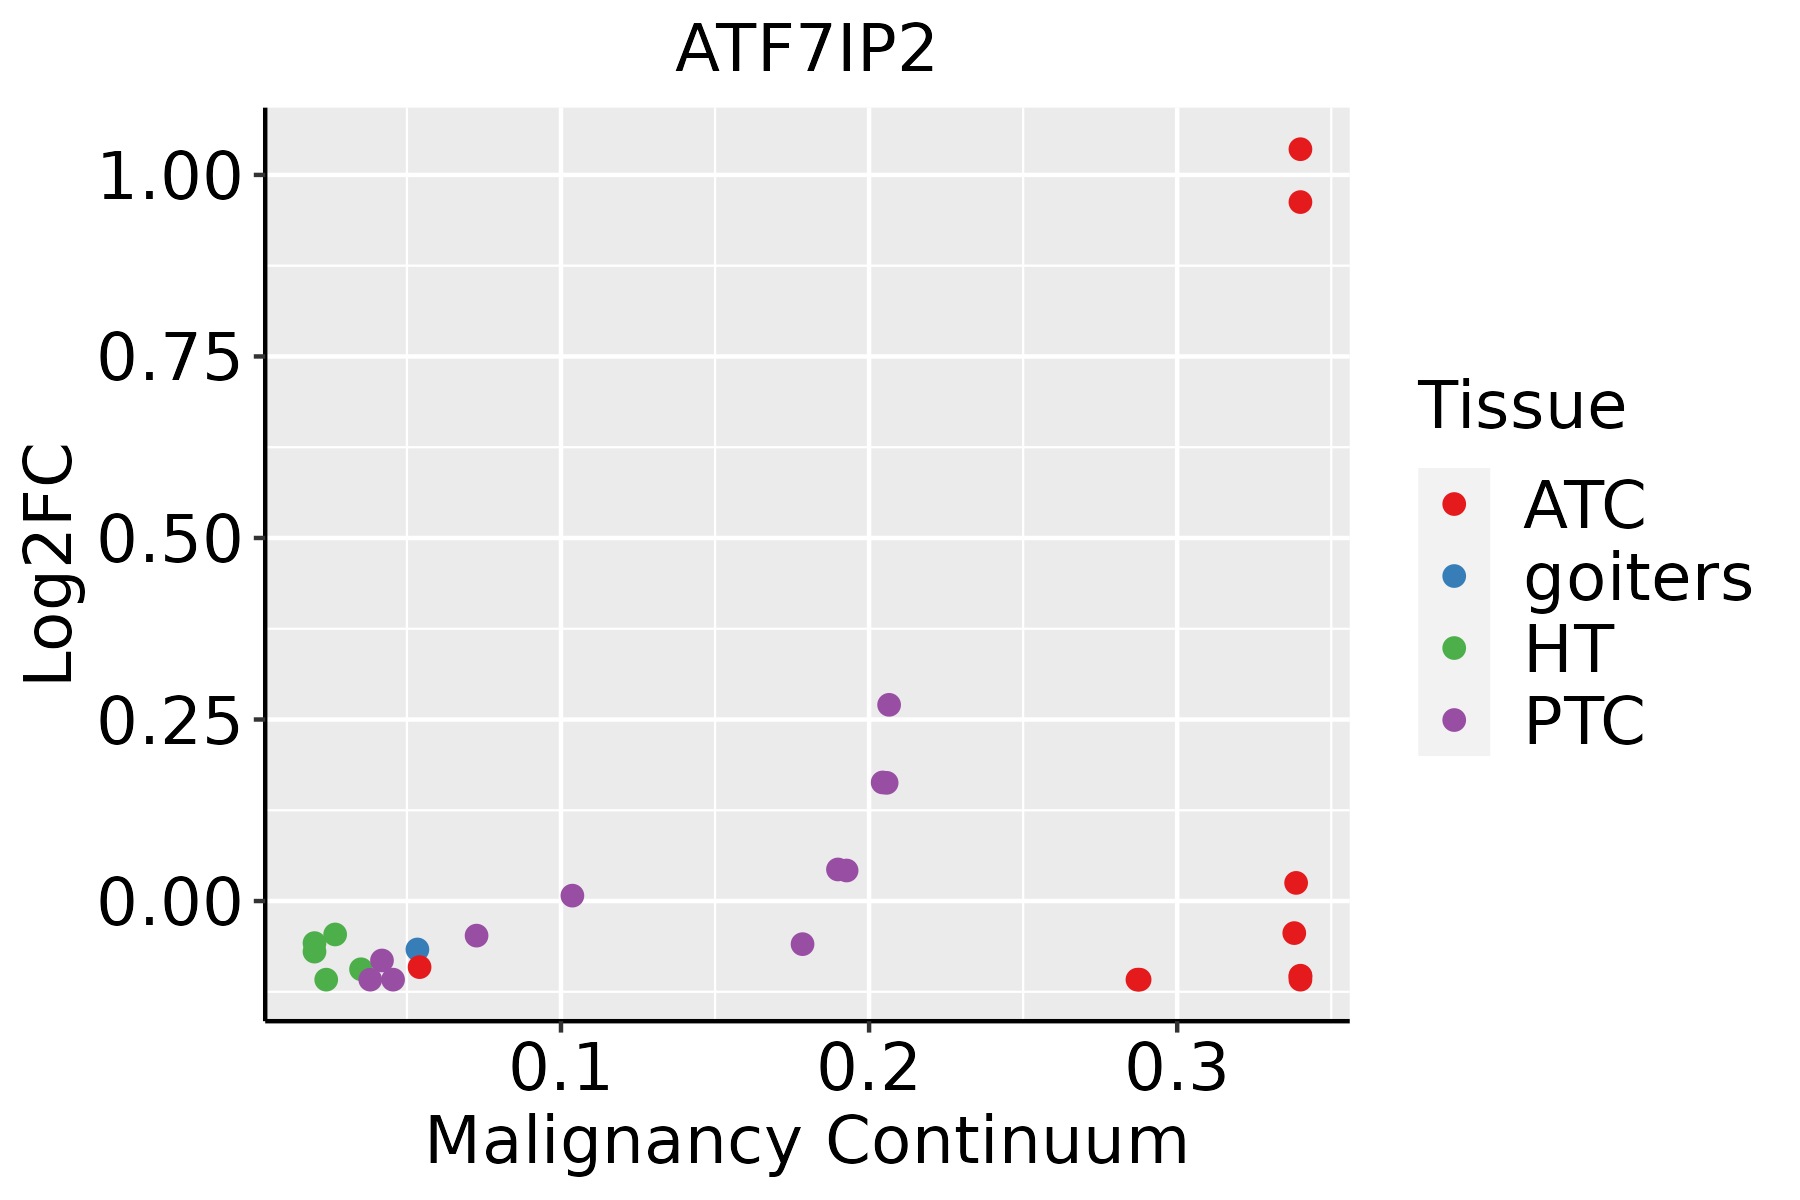 | ATC: Anaplastic thyroid cancer |
| HT: Hashimoto's thyroiditis | ||
| PTC: Papillary thyroid cancer |
| ∗log2FC in expression of this searched gene in stem-like cells from each diseased tissue sample relative to stem-like cells in normal samples in each tissue plotted against the malignancy continuum. Samples are colored based on if they are from different disease stage. |
Top |
Malignant transformation related pathway analysis |
| Find out the enriched GO biological processes and KEGG pathways involved in transition from healthy to precancer to cancer |
| Tissue | Disease Stage | Enriched GO biological Processes |
| Colorectum | AD |  |
| Colorectum | SER |  |
| Colorectum | MSS |  |
| Colorectum | MSI-H |  |
| Colorectum | FAP |  |
| ∗Top 15 enriched GO BP terms are showed in the bar plot of each disease state in each tissue. Each row represents a significant GO biological process which is colored according to the -log10(p.adjust). |
| Page: 1 2 3 4 5 6 7 8 9 |
| GO ID | Tissue | Disease Stage | Description | Gene Ratio | Bg Ratio | pvalue | p.adjust | Count |
| Page: 1 |
| Pathway ID | Tissue | Disease Stage | Description | Gene Ratio | Bg Ratio | pvalue | p.adjust | qvalue | Count |
| Page: 1 |
Top |
Cell-cell communication analysis |
| Identification of potential cell-cell interactions between two cell types and their ligand-receptor pairs for different disease states |
| Ligand | Receptor | LRpair | Pathway | Tissue | Disease Stage |
| Page: 1 |
Top |
Single-cell gene regulatory network inference analysis |
| Find out the significant the regulons (TFs) and the target genes of each regulon across cell types for different disease states |
| TF | Cell Type | Tissue | Disease Stage | Target Gene | RSS | Regulon Activity |
| ∗The dot plots of a searched regulon are shown for all cell subpopulations in each disease state of each tissue based on the regulon specific score inferred using pySCENIC and by calculating the average expression. |
| Page: 1 |
Top |
Somatic mutation of malignant transformation related genes |
| Annotation of somatic variants for genes involved in malignant transformation |
| Hugo Symbol | Variant Class | Variant Classification | dbSNP RS | HGVSc | HGVSp | HGVSp Short | SWISSPROT | BIOTYPE | SIFT | PolyPhen | Tumor Sample Barcode | Tissue | Histology | Sex | Age | Stage | Therapy Types | Drugs | Outcome |
| ATF7IP2 | SNV | Missense_Mutation | c.1518G>C | p.Leu506Phe | p.L506F | Q5U623 | protein_coding | deleterious(0.02) | benign(0.084) | TCGA-AR-A0TX-01 | Breast | breast invasive carcinoma | Female | <65 | I/II | Unknown | Unknown | SD | |
| ATF7IP2 | SNV | Missense_Mutation | novel | c.668N>G | p.Asp223Gly | p.D223G | Q5U623 | protein_coding | deleterious(0.01) | benign(0.14) | TCGA-EW-A3U0-01 | Breast | breast invasive carcinoma | Female | <65 | III/IV | Chemotherapy | cisplatin | CR |
| ATF7IP2 | insertion | In_Frame_Ins | novel | c.1996_1997insCACGCACAGCTAATTTTTGTATTTTTAGTA | p.Gly666delinsAlaArgThrAlaAsnPheCysIlePheSerArg | p.G666delinsARTANFCIFSR | Q5U623 | protein_coding | TCGA-A2-A0CP-01 | Breast | breast invasive carcinoma | Female | <65 | I/II | Chemotherapy | cytoxan | SD | ||
| ATF7IP2 | insertion | Frame_Shift_Ins | novel | c.692_693insTACTTTACTTTTCTCTGATATTG | p.Lys231AsnfsTer14 | p.K231Nfs*14 | Q5U623 | protein_coding | TCGA-A8-A09T-01 | Breast | breast invasive carcinoma | Female | >=65 | I/II | Hormone Therapy | anastrozole | SD | ||
| ATF7IP2 | SNV | Missense_Mutation | novel | c.1546A>G | p.Thr516Ala | p.T516A | Q5U623 | protein_coding | tolerated(0.09) | benign(0.058) | TCGA-2W-A8YY-01 | Cervix | cervical & endocervical cancer | Female | <65 | I/II | Chemotherapy | cisplatin | CR |
| ATF7IP2 | SNV | Missense_Mutation | c.1717N>G | p.Thr573Ala | p.T573A | Q5U623 | protein_coding | deleterious(0) | probably_damaging(0.911) | TCGA-AA-3815-01 | Colorectum | colon adenocarcinoma | Female | >=65 | I/II | Unknown | Unknown | SD | |
| ATF7IP2 | SNV | Missense_Mutation | novel | c.635A>G | p.Lys212Arg | p.K212R | Q5U623 | protein_coding | deleterious(0.01) | possibly_damaging(0.725) | TCGA-AA-3845-01 | Colorectum | colon adenocarcinoma | Female | >=65 | I/II | Unknown | Unknown | PD |
| ATF7IP2 | SNV | Missense_Mutation | rs746602868 | c.1123N>G | p.Ile375Val | p.I375V | Q5U623 | protein_coding | tolerated(0.19) | benign(0.022) | TCGA-AA-3952-01 | Colorectum | colon adenocarcinoma | Male | >=65 | III/IV | Unknown | Unknown | PD |
| ATF7IP2 | SNV | Missense_Mutation | c.485N>A | p.Cys162Tyr | p.C162Y | Q5U623 | protein_coding | tolerated(0.27) | benign(0) | TCGA-AD-6889-01 | Colorectum | colon adenocarcinoma | Male | >=65 | I/II | Chemotherapy | xeloda | PD | |
| ATF7IP2 | SNV | Missense_Mutation | novel | c.1166A>G | p.Asn389Ser | p.N389S | Q5U623 | protein_coding | tolerated(0.18) | benign(0.048) | TCGA-WS-AB45-01 | Colorectum | colon adenocarcinoma | Female | <65 | I/II | Unknown | Unknown | SD |
| Page: 1 2 3 4 5 6 7 |
Top |
Related drugs of malignant transformation related genes |
| Identification of chemicals and drugs interact with genes involved in malignant transfromation |
| (DGIdb 4.0) |
| Entrez ID | Symbol | Category | Interaction Types | Drug Claim Name | Drug Name | PMIDs |
| Page: 1 |

Copyright 2023-Present -The University of Texas Health Science Center at Houston |