
|
|||||
|
 | |
| |
| |
| |
| |
| |
|
Gene: ATF1 |
Gene summary for ATF1 |
| Gene information | Species | Human | Gene symbol | ATF1 | Gene ID | 466 |
| Gene name | activating transcription factor 1 | |
| Gene Alias | EWS-ATF1 | |
| Cytomap | 12q13.12 | |
| Gene Type | protein-coding | GO ID | GO:0006139 | UniProtAcc | P18846 |
Top |
Malignant transformation analysis |
| Identification of the aberrant gene expression in precancerous and cancerous lesions by comparing the gene expression of stem-like cells in diseased tissues with normal stem cells |
| Entrez ID | Symbol | Replicates | Species | Organ | Tissue | Adj P-value | Log2FC | Malignancy |
| 466 | ATF1 | LZE2T | Human | Esophagus | ESCC | 2.60e-03 | 2.58e-01 | 0.082 |
| 466 | ATF1 | LZE4T | Human | Esophagus | ESCC | 5.61e-03 | 1.05e-01 | 0.0811 |
| 466 | ATF1 | LZE7T | Human | Esophagus | ESCC | 1.77e-02 | 1.94e-01 | 0.0667 |
| 466 | ATF1 | LZE24T | Human | Esophagus | ESCC | 2.14e-17 | 4.62e-01 | 0.0596 |
| 466 | ATF1 | LZE21T | Human | Esophagus | ESCC | 3.99e-02 | 4.99e-02 | 0.0655 |
| 466 | ATF1 | LZE6T | Human | Esophagus | ESCC | 4.95e-04 | 1.09e-01 | 0.0845 |
| 466 | ATF1 | P1T-E | Human | Esophagus | ESCC | 3.59e-06 | 4.57e-01 | 0.0875 |
| 466 | ATF1 | P2T-E | Human | Esophagus | ESCC | 1.19e-27 | 5.90e-01 | 0.1177 |
| 466 | ATF1 | P4T-E | Human | Esophagus | ESCC | 6.07e-18 | 4.92e-01 | 0.1323 |
| 466 | ATF1 | P5T-E | Human | Esophagus | ESCC | 1.14e-12 | 1.46e-01 | 0.1327 |
| 466 | ATF1 | P8T-E | Human | Esophagus | ESCC | 7.11e-20 | 4.62e-01 | 0.0889 |
| 466 | ATF1 | P9T-E | Human | Esophagus | ESCC | 8.09e-19 | 2.73e-01 | 0.1131 |
| 466 | ATF1 | P10T-E | Human | Esophagus | ESCC | 1.25e-20 | 4.23e-01 | 0.116 |
| 466 | ATF1 | P11T-E | Human | Esophagus | ESCC | 2.64e-07 | 3.58e-01 | 0.1426 |
| 466 | ATF1 | P12T-E | Human | Esophagus | ESCC | 2.87e-23 | 4.58e-01 | 0.1122 |
| 466 | ATF1 | P15T-E | Human | Esophagus | ESCC | 1.32e-25 | 5.61e-01 | 0.1149 |
| 466 | ATF1 | P16T-E | Human | Esophagus | ESCC | 3.92e-21 | 2.72e-01 | 0.1153 |
| 466 | ATF1 | P17T-E | Human | Esophagus | ESCC | 2.49e-08 | 2.86e-01 | 0.1278 |
| 466 | ATF1 | P19T-E | Human | Esophagus | ESCC | 1.60e-02 | 3.89e-01 | 0.1662 |
| 466 | ATF1 | P20T-E | Human | Esophagus | ESCC | 4.08e-25 | 5.62e-01 | 0.1124 |
| Page: 1 2 3 4 5 |
| Tissue | Expression Dynamics | Abbreviation |
| Esophagus | 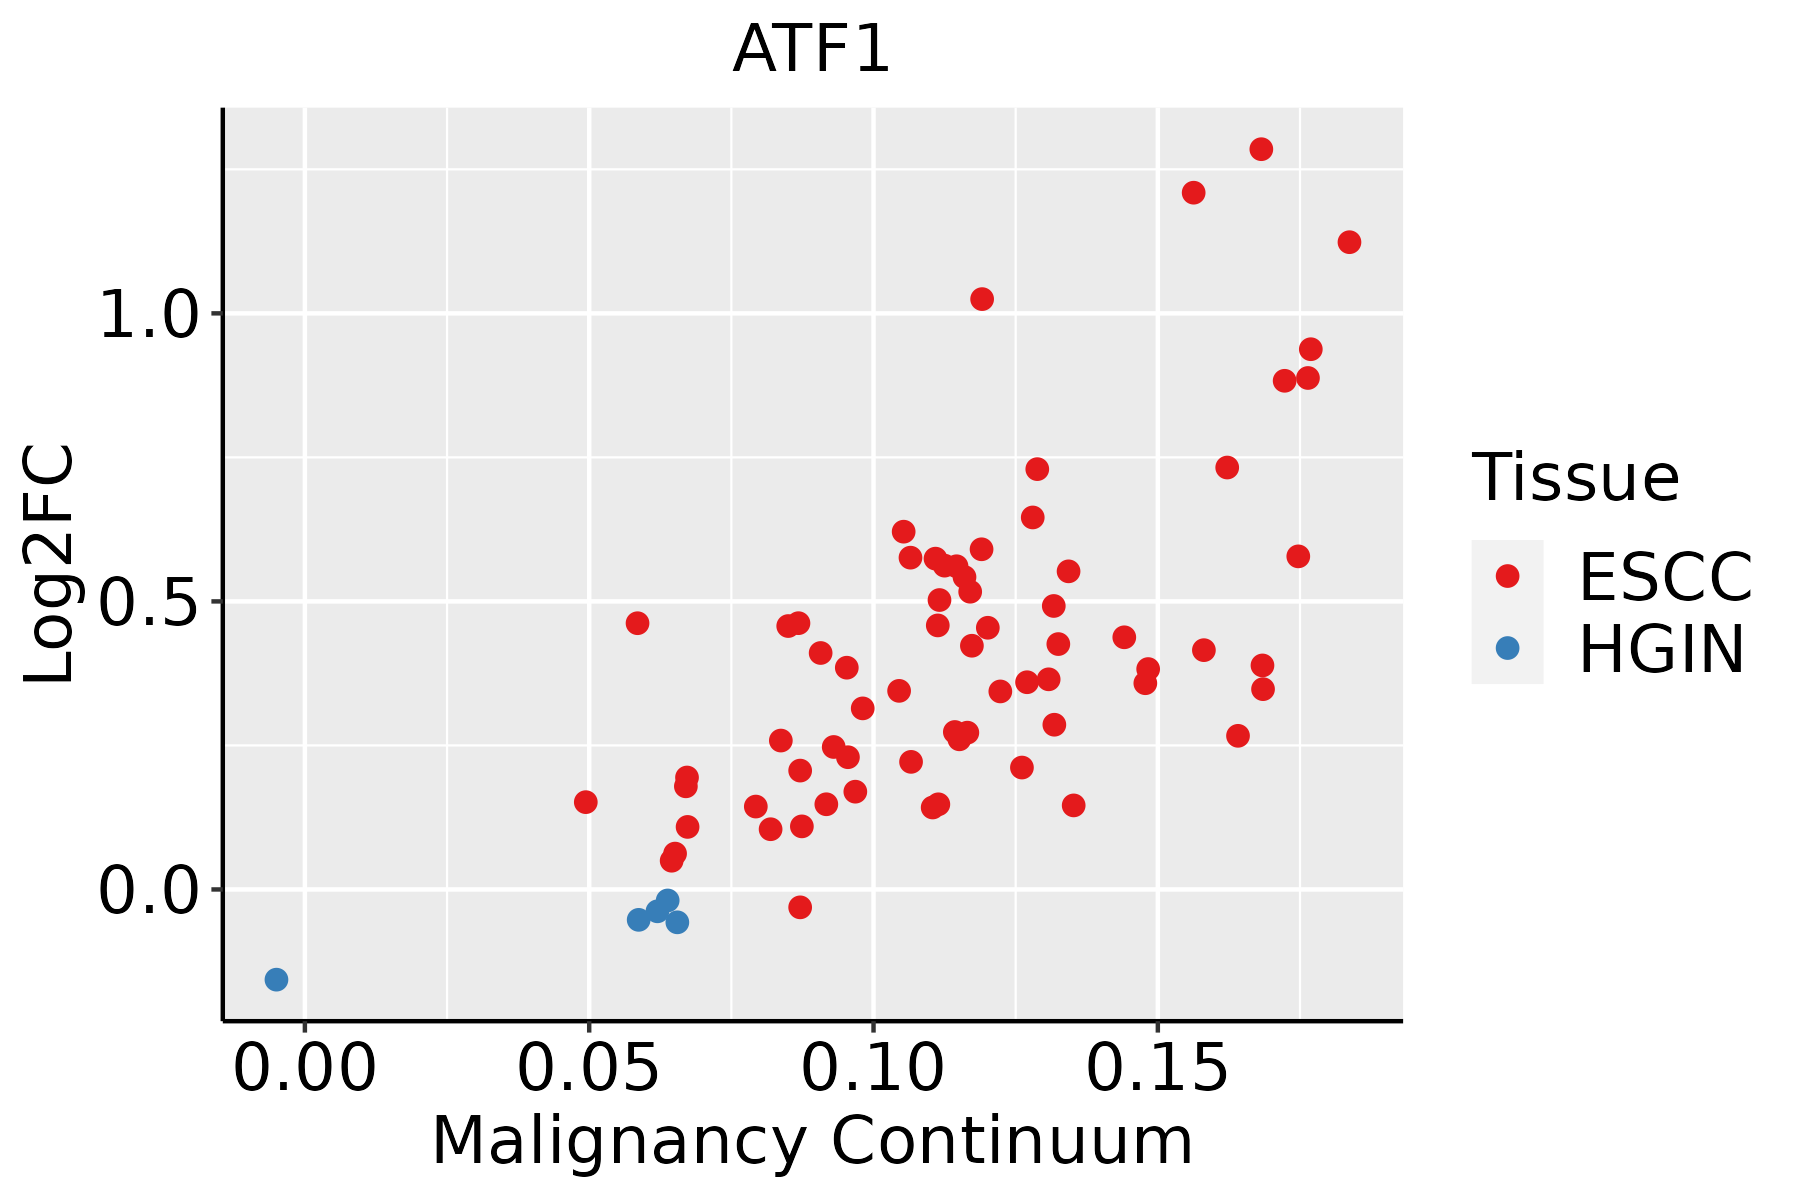 | ESCC: Esophageal squamous cell carcinoma |
| HGIN: High-grade intraepithelial neoplasias | ||
| LGIN: Low-grade intraepithelial neoplasias | ||
| Liver | 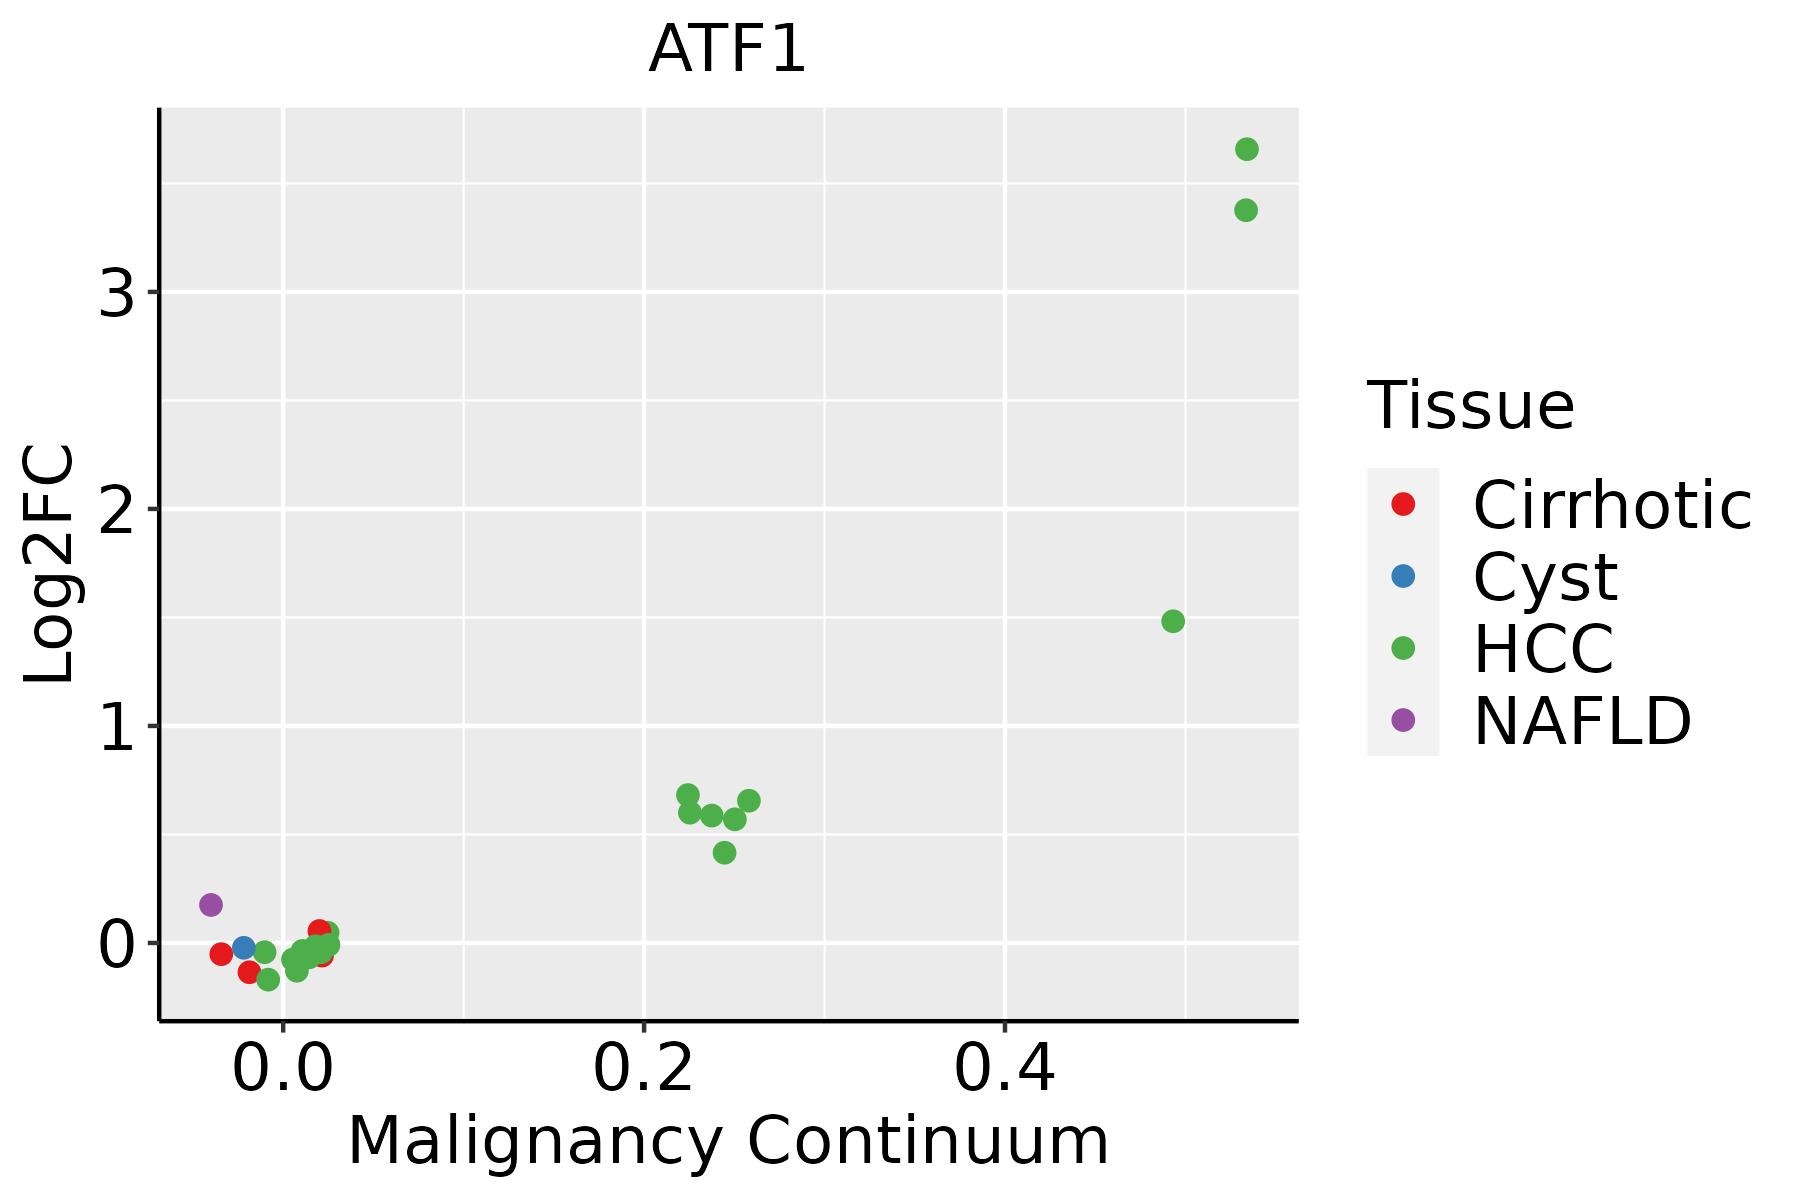 | HCC: Hepatocellular carcinoma |
| NAFLD: Non-alcoholic fatty liver disease | ||
| Oral Cavity | 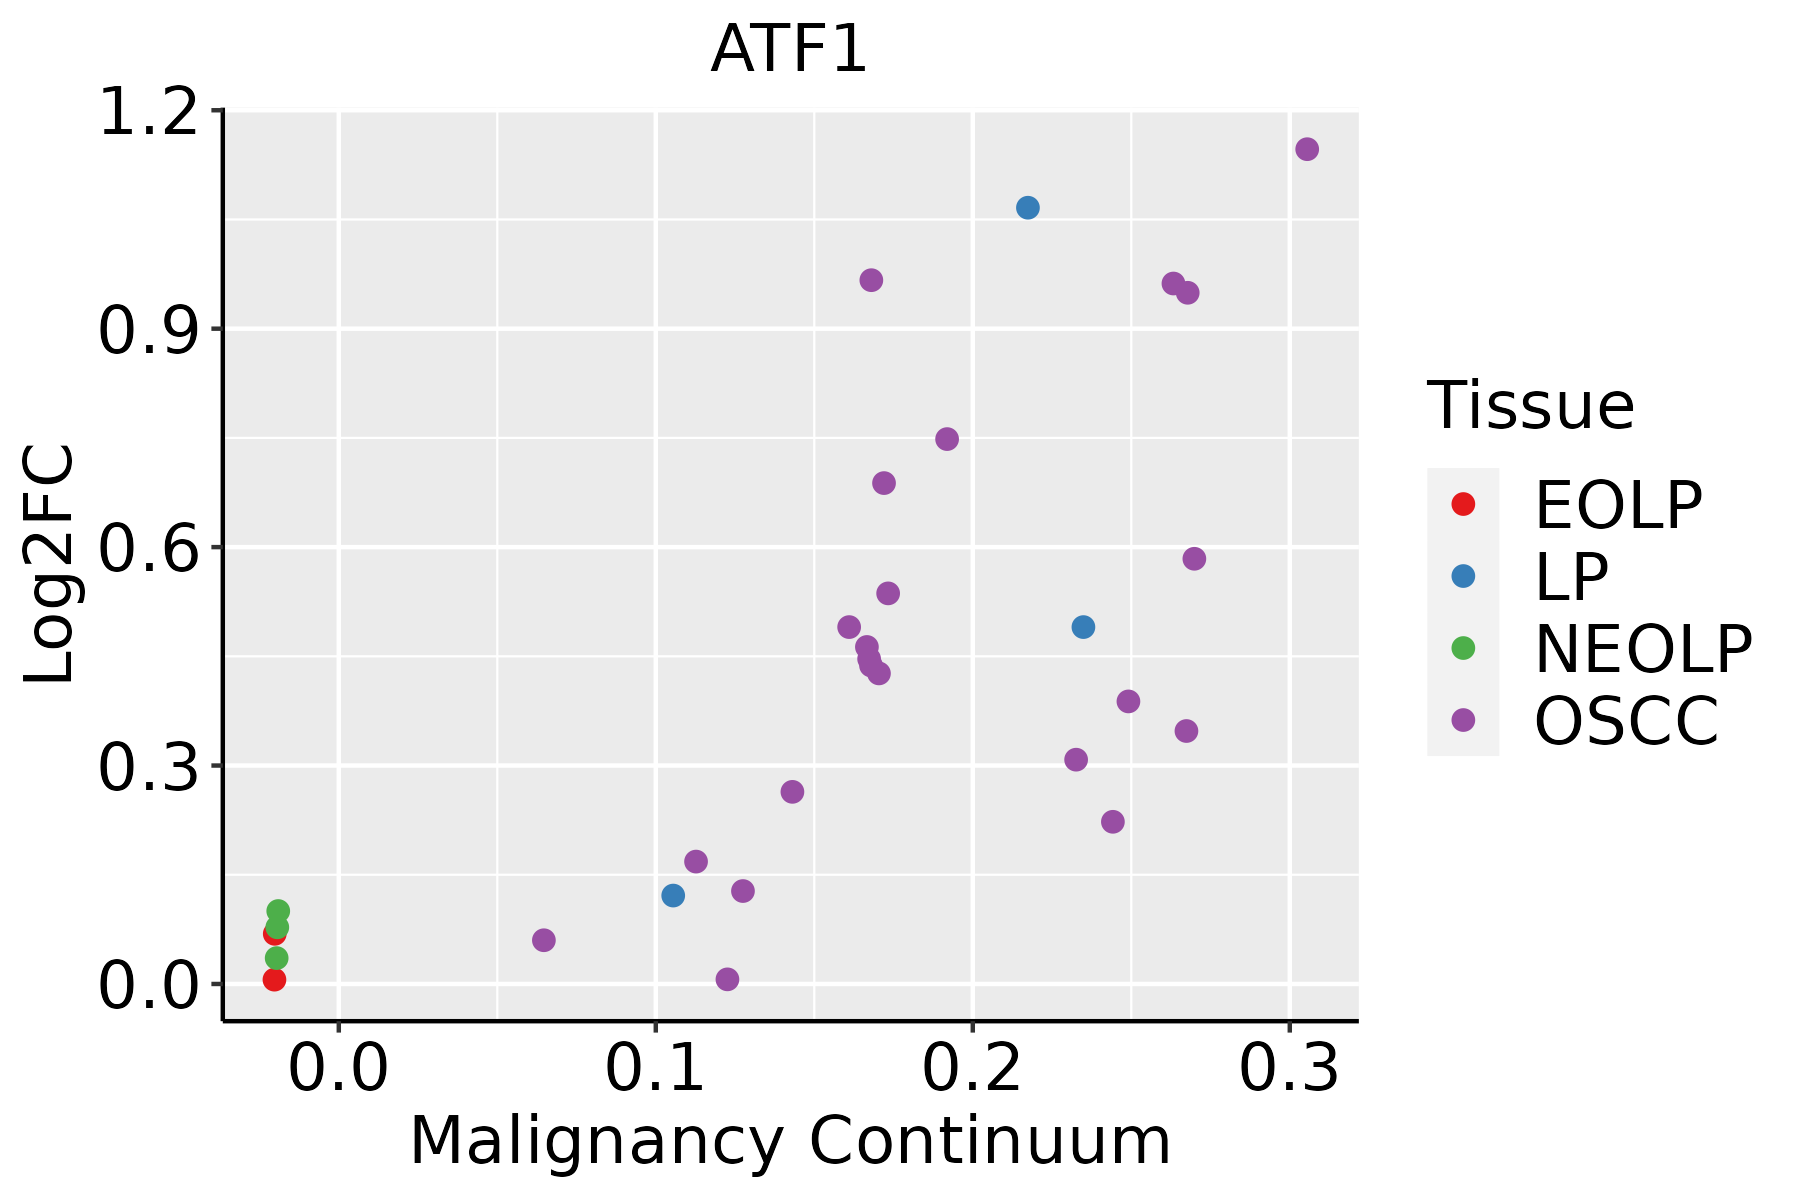 | EOLP: Erosive Oral lichen planus |
| LP: leukoplakia | ||
| NEOLP: Non-erosive oral lichen planus | ||
| OSCC: Oral squamous cell carcinoma |
| ∗log2FC in expression of this searched gene in stem-like cells from each diseased tissue sample relative to stem-like cells in normal samples in each tissue plotted against the malignancy continuum. Samples are colored based on if they are from different disease stage. |
Top |
Malignant transformation related pathway analysis |
| Find out the enriched GO biological processes and KEGG pathways involved in transition from healthy to precancer to cancer |
| Tissue | Disease Stage | Enriched GO biological Processes |
| Colorectum | AD |  |
| Colorectum | SER |  |
| Colorectum | MSS |  |
| Colorectum | MSI-H |  |
| Colorectum | FAP |  |
| ∗Top 15 enriched GO BP terms are showed in the bar plot of each disease state in each tissue. Each row represents a significant GO biological process which is colored according to the -log10(p.adjust). |
| Page: 1 2 3 4 5 6 7 8 9 |
| GO ID | Tissue | Disease Stage | Description | Gene Ratio | Bg Ratio | pvalue | p.adjust | Count |
| GO:00062604 | Esophagus | ESCC | DNA replication | 181/8552 | 260/18723 | 3.55e-15 | 2.05e-13 | 181 |
| GO:00062754 | Esophagus | ESCC | regulation of DNA replication | 73/8552 | 107/18723 | 1.97e-06 | 2.28e-05 | 73 |
| GO:003134616 | Esophagus | ESCC | positive regulation of cell projection organization | 201/8552 | 353/18723 | 1.19e-05 | 1.11e-04 | 201 |
| GO:001003827 | Esophagus | ESCC | response to metal ion | 208/8552 | 373/18723 | 5.02e-05 | 3.90e-04 | 208 |
| GO:001097516 | Esophagus | ESCC | regulation of neuron projection development | 240/8552 | 445/18723 | 2.48e-04 | 1.53e-03 | 240 |
| GO:00109764 | Esophagus | ESCC | positive regulation of neuron projection development | 91/8552 | 163/18723 | 5.72e-03 | 2.13e-02 | 91 |
| GO:00457406 | Esophagus | ESCC | positive regulation of DNA replication | 26/8552 | 40/18723 | 1.08e-02 | 3.66e-02 | 26 |
| GO:001003812 | Liver | Cirrhotic | response to metal ion | 150/4634 | 373/18723 | 2.27e-11 | 1.37e-09 | 150 |
| GO:001003822 | Liver | HCC | response to metal ion | 208/7958 | 373/18723 | 1.35e-07 | 2.56e-06 | 208 |
| GO:003134611 | Liver | HCC | positive regulation of cell projection organization | 193/7958 | 353/18723 | 2.28e-06 | 3.08e-05 | 193 |
| GO:00062601 | Liver | HCC | DNA replication | 146/7958 | 260/18723 | 5.68e-06 | 7.02e-05 | 146 |
| GO:001097511 | Liver | HCC | regulation of neuron projection development | 220/7958 | 445/18723 | 1.68e-03 | 8.78e-03 | 220 |
| GO:0010976 | Liver | HCC | positive regulation of neuron projection development | 88/7958 | 163/18723 | 1.98e-03 | 1.00e-02 | 88 |
| GO:00062751 | Liver | HCC | regulation of DNA replication | 60/7958 | 107/18723 | 3.15e-03 | 1.46e-02 | 60 |
| GO:00062603 | Oral cavity | OSCC | DNA replication | 159/7305 | 260/18723 | 3.25e-13 | 1.59e-11 | 159 |
| GO:001003820 | Oral cavity | OSCC | response to metal ion | 188/7305 | 373/18723 | 4.34e-06 | 5.00e-05 | 188 |
| GO:003134610 | Oral cavity | OSCC | positive regulation of cell projection organization | 176/7305 | 353/18723 | 1.94e-05 | 1.87e-04 | 176 |
| GO:00062753 | Oral cavity | OSCC | regulation of DNA replication | 62/7305 | 107/18723 | 5.49e-05 | 4.54e-04 | 62 |
| GO:001097510 | Oral cavity | OSCC | regulation of neuron projection development | 210/7305 | 445/18723 | 2.35e-04 | 1.52e-03 | 210 |
| GO:00109763 | Oral cavity | OSCC | positive regulation of neuron projection development | 80/7305 | 163/18723 | 5.54e-03 | 2.14e-02 | 80 |
| Page: 1 2 |
| Pathway ID | Tissue | Disease Stage | Description | Gene Ratio | Bg Ratio | pvalue | p.adjust | qvalue | Count |
| Page: 1 |
Top |
Cell-cell communication analysis |
| Identification of potential cell-cell interactions between two cell types and their ligand-receptor pairs for different disease states |
| Ligand | Receptor | LRpair | Pathway | Tissue | Disease Stage |
| Page: 1 |
Top |
Single-cell gene regulatory network inference analysis |
| Find out the significant the regulons (TFs) and the target genes of each regulon across cell types for different disease states |
| TF | Cell Type | Tissue | Disease Stage | Target Gene | RSS | Regulon Activity |
| ATF1 | ICAF | Colorectum | CRC | NFYB,ZNF337-AS1,MORN1, etc. | 2.87e-02 |  |
| ATF1 | MVA | Colorectum | Healthy | NFYB,ZNF337-AS1,MORN1, etc. | 5.20e-03 |  |
| ∗The dot plots of a searched regulon are shown for all cell subpopulations in each disease state of each tissue based on the regulon specific score inferred using pySCENIC and by calculating the average expression. |
| Page: 1 |
Top |
Somatic mutation of malignant transformation related genes |
| Annotation of somatic variants for genes involved in malignant transformation |
| Hugo Symbol | Variant Class | Variant Classification | dbSNP RS | HGVSc | HGVSp | HGVSp Short | SWISSPROT | BIOTYPE | SIFT | PolyPhen | Tumor Sample Barcode | Tissue | Histology | Sex | Age | Stage | Therapy Types | Drugs | Outcome |
| ATF1 | SNV | Missense_Mutation | c.305N>G | p.Tyr102Cys | p.Y102C | P18846 | protein_coding | deleterious(0) | probably_damaging(0.997) | TCGA-D8-A1XA-01 | Breast | breast invasive carcinoma | Female | <65 | I/II | Unknown | Unknown | SD | |
| ATF1 | SNV | Missense_Mutation | rs781155610 | c.425N>T | p.Thr142Ile | p.T142I | P18846 | protein_coding | tolerated(0.36) | benign(0.03) | TCGA-E9-A1ND-01 | Breast | breast invasive carcinoma | Female | >=65 | I/II | Hormone Therapy | aromasin | SD |
| ATF1 | SNV | Missense_Mutation | c.540G>C | p.Gln180His | p.Q180H | P18846 | protein_coding | deleterious(0) | probably_damaging(0.986) | TCGA-GM-A2DH-01 | Breast | breast invasive carcinoma | Female | <65 | I/II | Chemotherapy | taxol | CR | |
| ATF1 | insertion | Frame_Shift_Ins | novel | c.652_653insATAGCTATTG | p.Ile218AsnfsTer39 | p.I218Nfs*39 | P18846 | protein_coding | TCGA-A8-A08C-01 | Breast | breast invasive carcinoma | Female | >=65 | I/II | Chemotherapy | 5-fluorouracil | CR | ||
| ATF1 | deletion | In_Frame_Del | novel | c.728_796delNNNNNNNNNNNNNNNNNNNNNNNNNNNNNNNNNNNNNNNNNNNNNNNNNNNNNNNNNNNNNNNNNNNNN | p.Arg244_Tyr266del | p.R244_Y266del | P18846 | protein_coding | TCGA-BH-A0B6-01 | Breast | breast invasive carcinoma | Female | <65 | I/II | Unknown | Unknown | SD | ||
| ATF1 | SNV | Missense_Mutation | rs763994606 | c.65N>A | p.Gly22Glu | p.G22E | P18846 | protein_coding | tolerated(0.07) | probably_damaging(0.998) | TCGA-AA-3984-01 | Colorectum | colon adenocarcinoma | Female | <65 | I/II | Unknown | Unknown | SD |
| ATF1 | SNV | Missense_Mutation | c.26C>T | p.Thr9Met | p.T9M | P18846 | protein_coding | deleterious_low_confidence(0.02) | benign(0.09) | TCGA-AZ-6598-01 | Colorectum | colon adenocarcinoma | Female | >=65 | I/II | Unknown | Unknown | SD | |
| ATF1 | SNV | Missense_Mutation | novel | c.329N>G | p.Ile110Ser | p.I110S | P18846 | protein_coding | tolerated(0.05) | possibly_damaging(0.723) | TCGA-CA-6717-01 | Colorectum | colon adenocarcinoma | Male | <65 | I/II | Chemotherapy | oxaliplatin | CR |
| ATF1 | SNV | Missense_Mutation | c.136G>A | p.Asp46Asn | p.D46N | P18846 | protein_coding | deleterious(0) | probably_damaging(0.994) | TCGA-F4-6461-01 | Colorectum | colon adenocarcinoma | Female | <65 | III/IV | Unknown | Unknown | PD | |
| ATF1 | SNV | Missense_Mutation | c.88N>A | p.Gln30Lys | p.Q30K | P18846 | protein_coding | tolerated(0.24) | benign(0.01) | TCGA-AG-4015-01 | Colorectum | rectum adenocarcinoma | Female | >=65 | I/II | Unknown | Unknown | SD |
| Page: 1 2 3 |
Top |
Related drugs of malignant transformation related genes |
| Identification of chemicals and drugs interact with genes involved in malignant transfromation |
| (DGIdb 4.0) |
| Entrez ID | Symbol | Category | Interaction Types | Drug Claim Name | Drug Name | PMIDs |
| Page: 1 |

Copyright 2023-Present -The University of Texas Health Science Center at Houston |