
|
|||||
|
 | |
| |
| |
| |
| |
| |
|
Gene: ATE1 |
Gene summary for ATE1 |
| Gene information | Species | Human | Gene symbol | ATE1 | Gene ID | 11101 |
| Gene name | arginyltransferase 1 | |
| Gene Alias | ATE1 | |
| Cytomap | 10q26.13 | |
| Gene Type | protein-coding | GO ID | GO:0006464 | UniProtAcc | B3KWA3 |
Top |
Malignant transformation analysis |
| Identification of the aberrant gene expression in precancerous and cancerous lesions by comparing the gene expression of stem-like cells in diseased tissues with normal stem cells |
| Entrez ID | Symbol | Replicates | Species | Organ | Tissue | Adj P-value | Log2FC | Malignancy |
| 11101 | ATE1 | HTA11_3410_2000001011 | Human | Colorectum | AD | 3.68e-14 | -5.00e-01 | 0.0155 |
| 11101 | ATE1 | HTA11_866_3004761011 | Human | Colorectum | AD | 5.61e-05 | -3.59e-01 | 0.096 |
| 11101 | ATE1 | HTA11_7696_3000711011 | Human | Colorectum | AD | 3.34e-05 | -3.66e-01 | 0.0674 |
| 11101 | ATE1 | HTA11_99999970781_79442 | Human | Colorectum | MSS | 1.10e-03 | -2.99e-01 | 0.294 |
| 11101 | ATE1 | HTA11_99999973899_84307 | Human | Colorectum | MSS | 1.81e-03 | -5.05e-01 | 0.2585 |
| 11101 | ATE1 | HTA11_99999974143_84620 | Human | Colorectum | MSS | 7.35e-18 | -5.60e-01 | 0.3005 |
| 11101 | ATE1 | F007 | Human | Colorectum | FAP | 2.96e-02 | -3.30e-01 | 0.1176 |
| 11101 | ATE1 | A015-C-203 | Human | Colorectum | FAP | 8.46e-28 | -4.30e-01 | -0.1294 |
| 11101 | ATE1 | A015-C-204 | Human | Colorectum | FAP | 1.13e-06 | -3.06e-01 | -0.0228 |
| 11101 | ATE1 | A014-C-040 | Human | Colorectum | FAP | 9.08e-04 | -2.99e-01 | -0.1184 |
| 11101 | ATE1 | A002-C-201 | Human | Colorectum | FAP | 2.69e-13 | -2.93e-01 | 0.0324 |
| 11101 | ATE1 | A002-C-203 | Human | Colorectum | FAP | 1.80e-03 | -1.64e-01 | 0.2786 |
| 11101 | ATE1 | A001-C-119 | Human | Colorectum | FAP | 2.15e-05 | -3.38e-01 | -0.1557 |
| 11101 | ATE1 | A001-C-108 | Human | Colorectum | FAP | 2.01e-13 | -2.06e-01 | -0.0272 |
| 11101 | ATE1 | A002-C-205 | Human | Colorectum | FAP | 8.36e-23 | -3.46e-01 | -0.1236 |
| 11101 | ATE1 | A015-C-005 | Human | Colorectum | FAP | 1.57e-04 | -3.09e-01 | -0.0336 |
| 11101 | ATE1 | A015-C-006 | Human | Colorectum | FAP | 2.02e-16 | -4.08e-01 | -0.0994 |
| 11101 | ATE1 | A015-C-106 | Human | Colorectum | FAP | 1.38e-09 | -2.43e-01 | -0.0511 |
| 11101 | ATE1 | A002-C-114 | Human | Colorectum | FAP | 1.70e-19 | -3.19e-01 | -0.1561 |
| 11101 | ATE1 | A015-C-104 | Human | Colorectum | FAP | 6.57e-31 | -3.96e-01 | -0.1899 |
| Page: 1 2 3 4 5 6 7 |
| Tissue | Expression Dynamics | Abbreviation |
| Colorectum (GSE201348) |  | FAP: Familial adenomatous polyposis |
| CRC: Colorectal cancer | ||
| Colorectum (HTA11) | 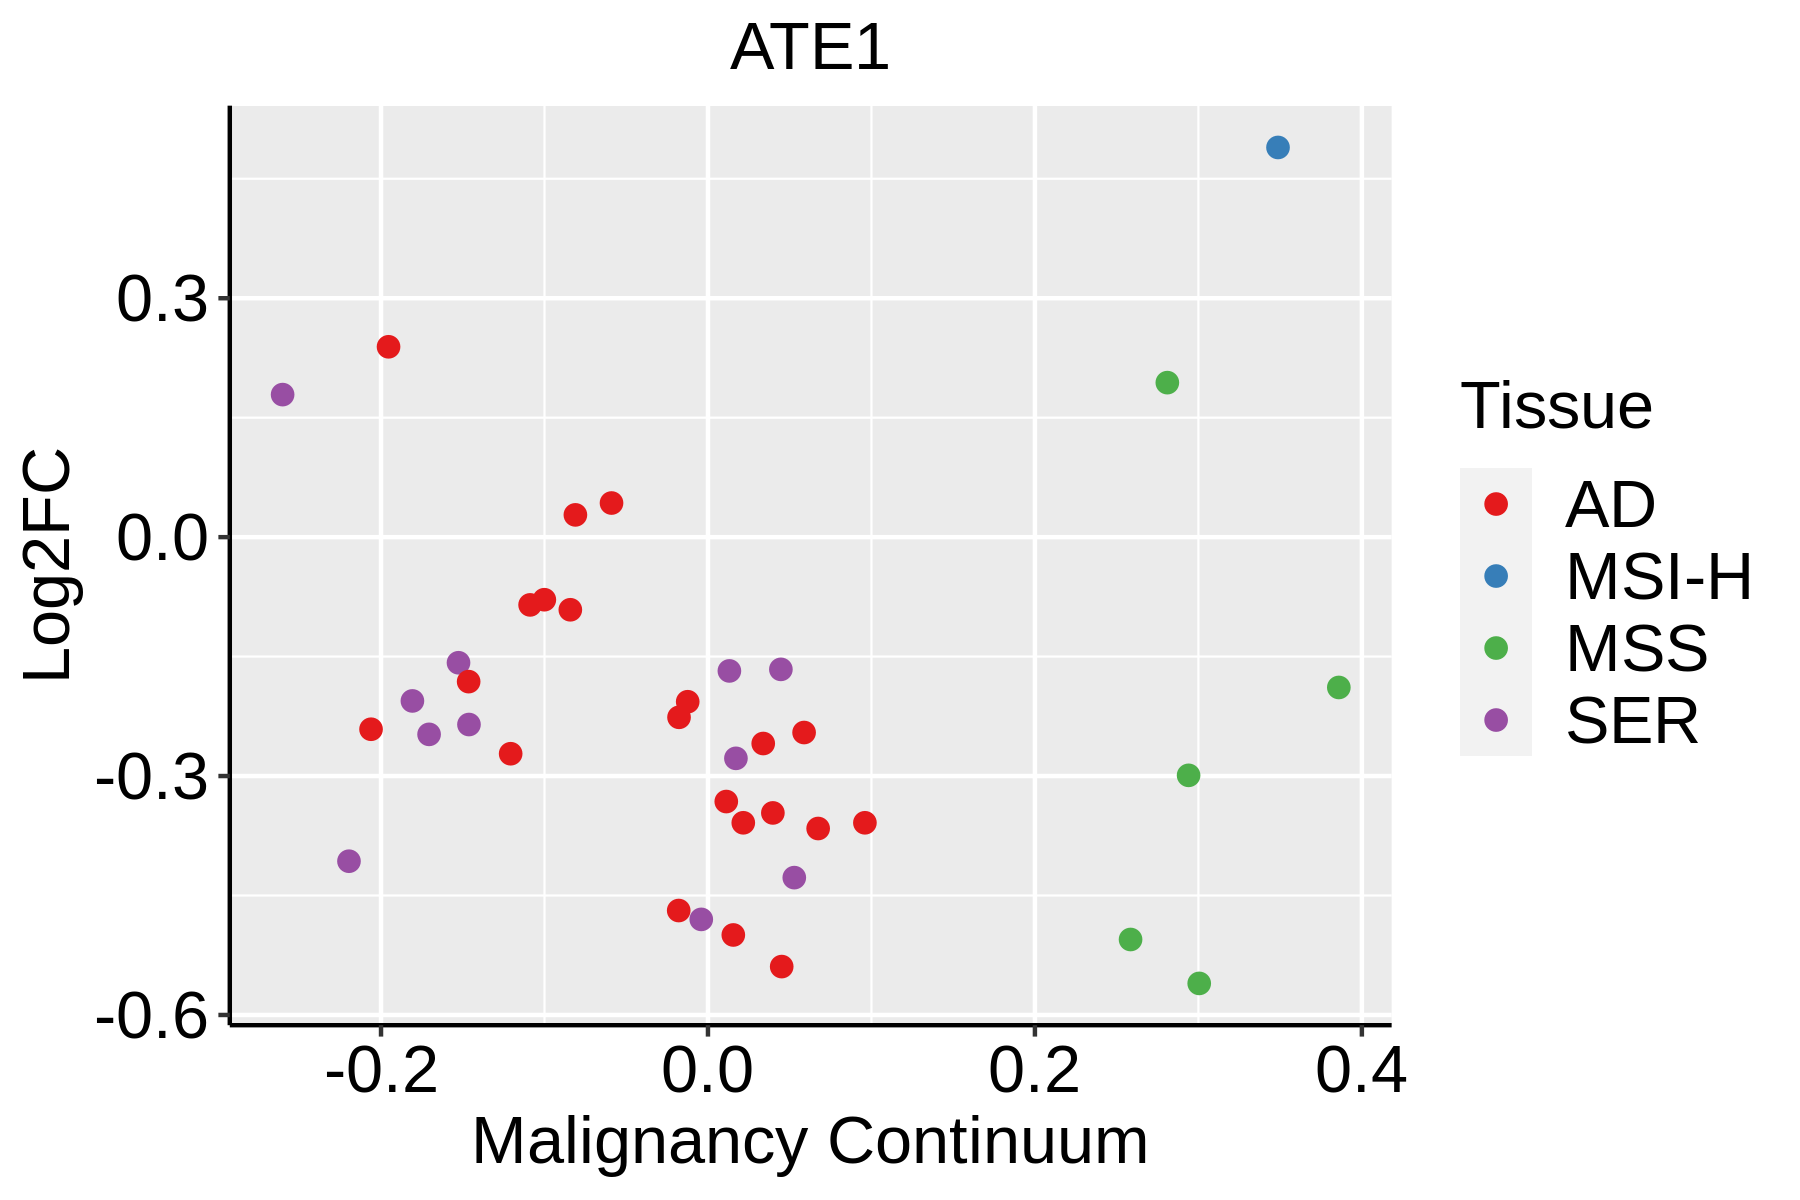 | AD: Adenomas |
| SER: Sessile serrated lesions | ||
| MSI-H: Microsatellite-high colorectal cancer | ||
| MSS: Microsatellite stable colorectal cancer | ||
| Endometrium | 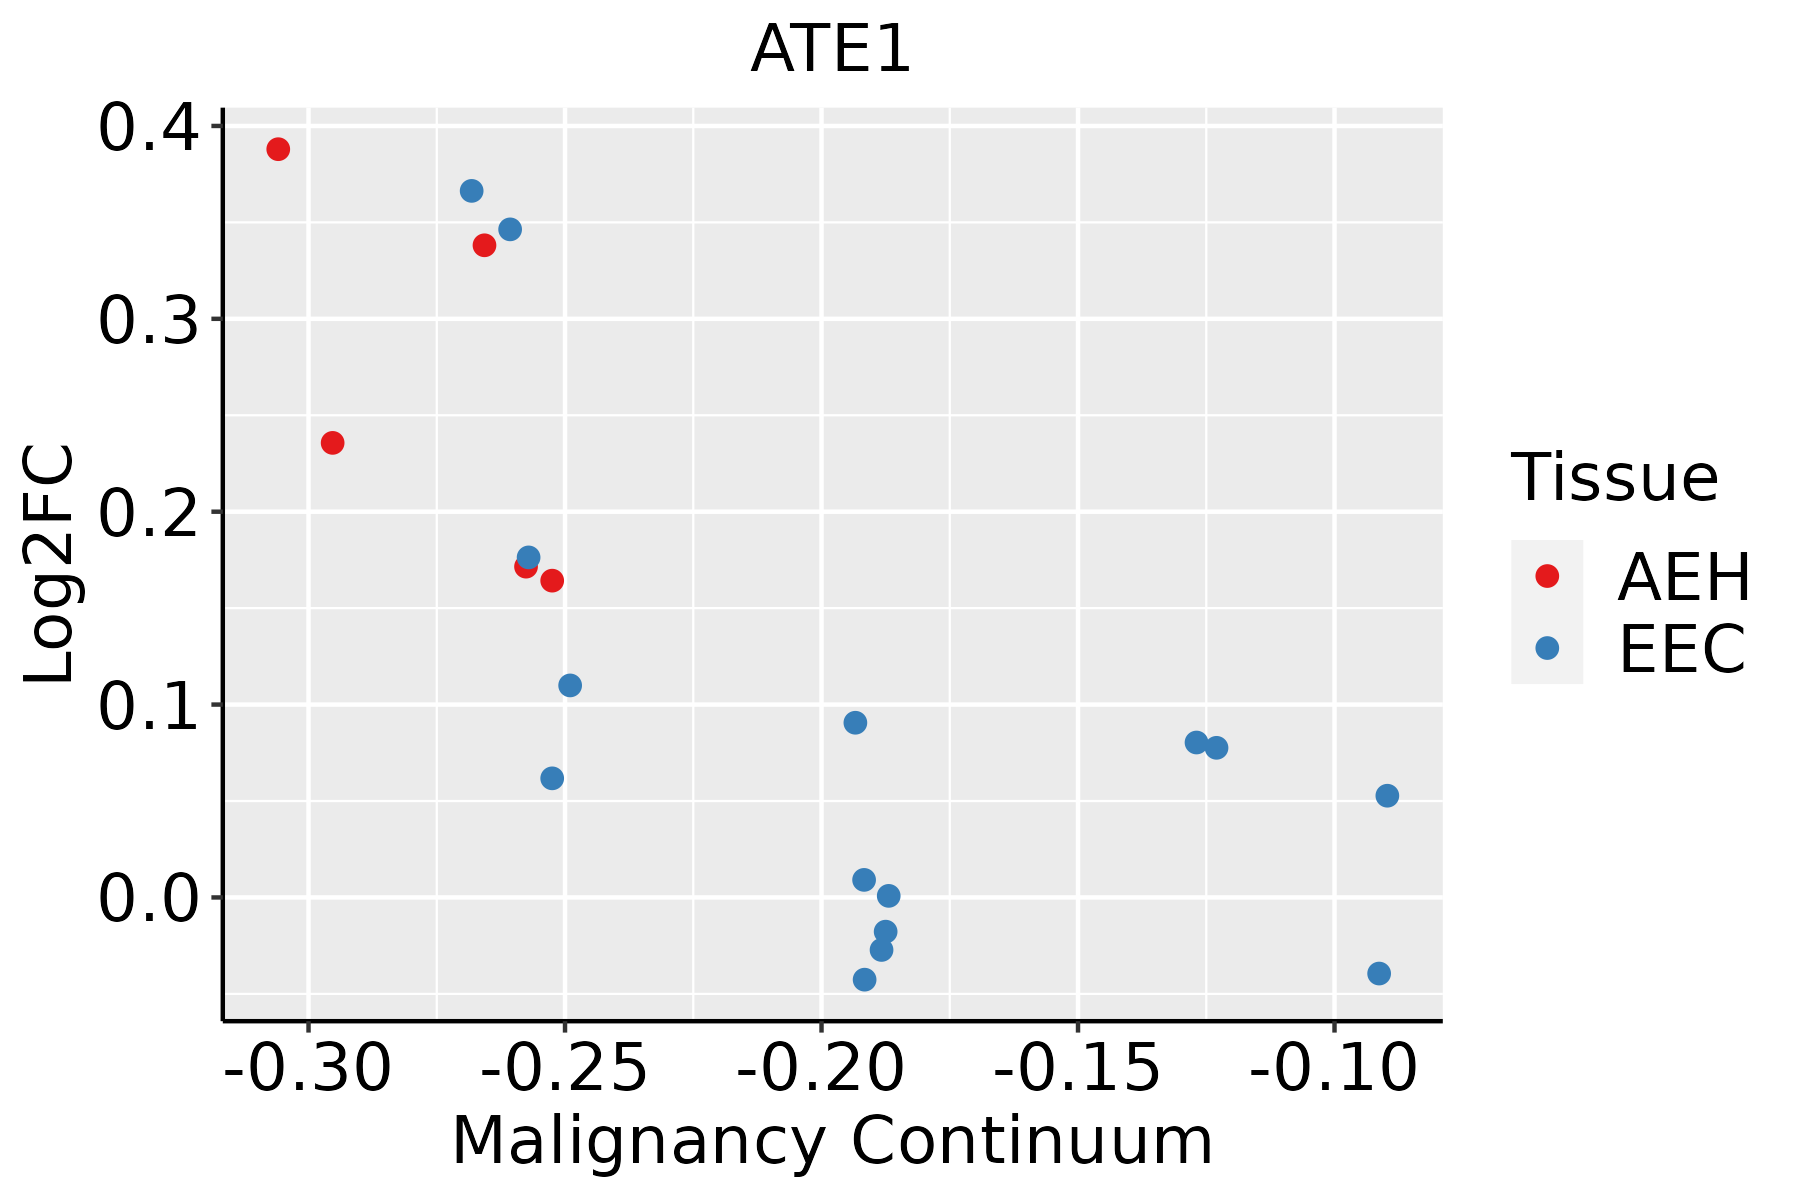 | AEH: Atypical endometrial hyperplasia |
| EEC: Endometrioid Cancer | ||
| Esophagus | 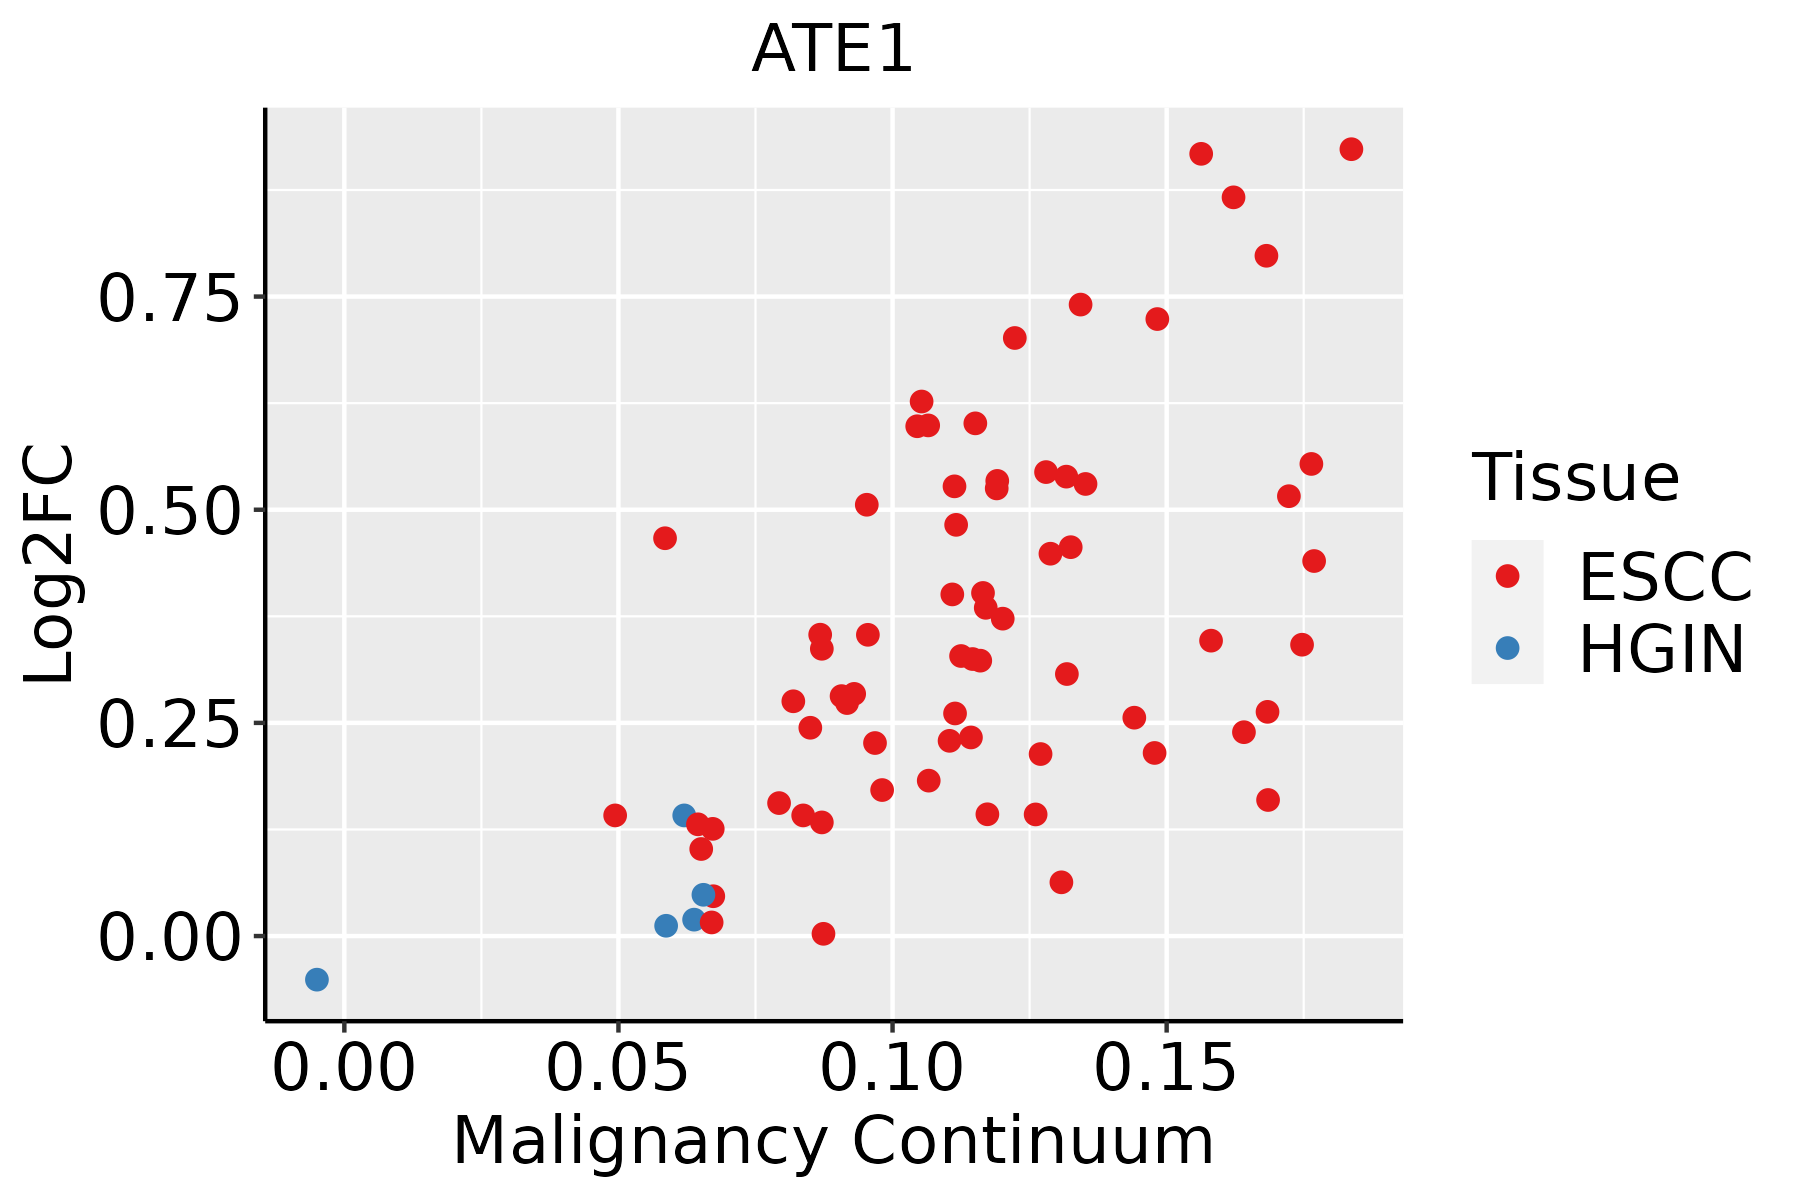 | ESCC: Esophageal squamous cell carcinoma |
| HGIN: High-grade intraepithelial neoplasias | ||
| LGIN: Low-grade intraepithelial neoplasias | ||
| Liver | 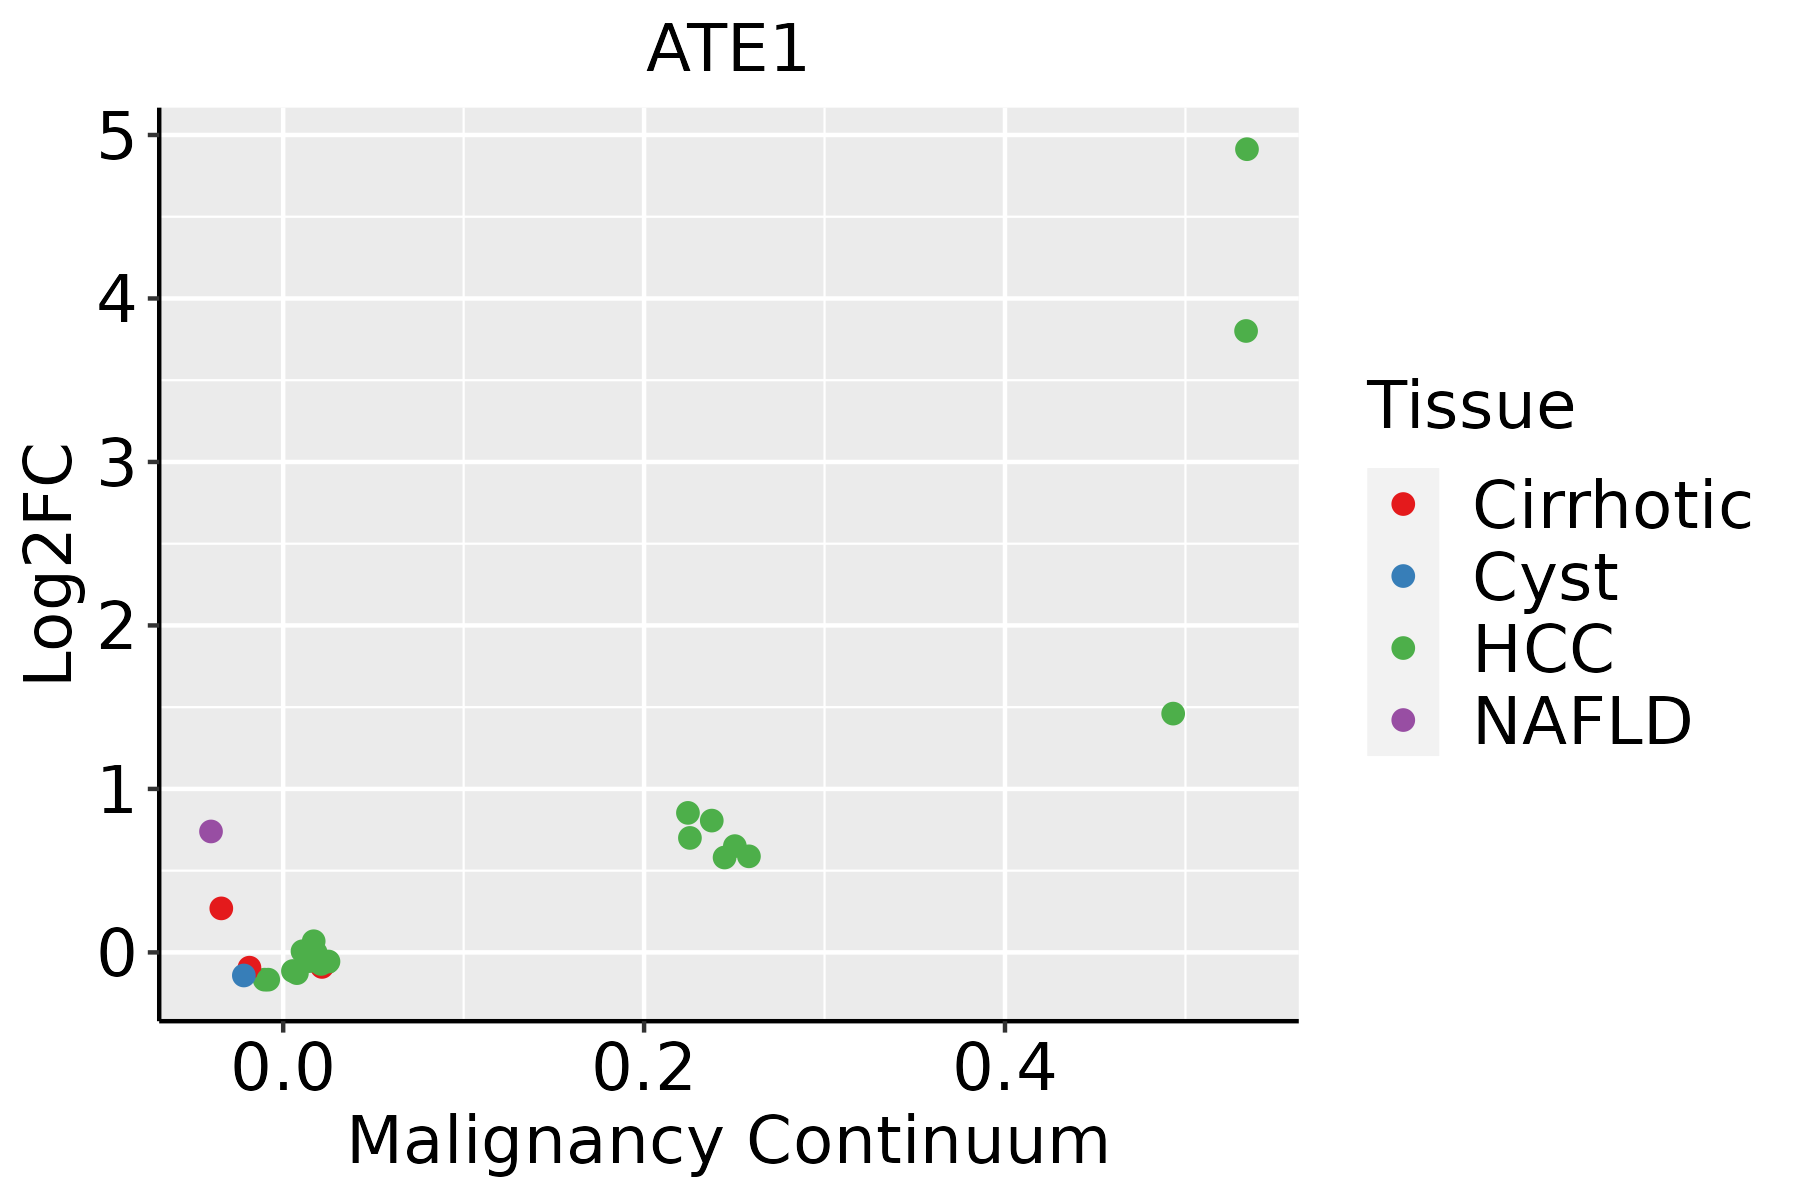 | HCC: Hepatocellular carcinoma |
| NAFLD: Non-alcoholic fatty liver disease | ||
| Lung | 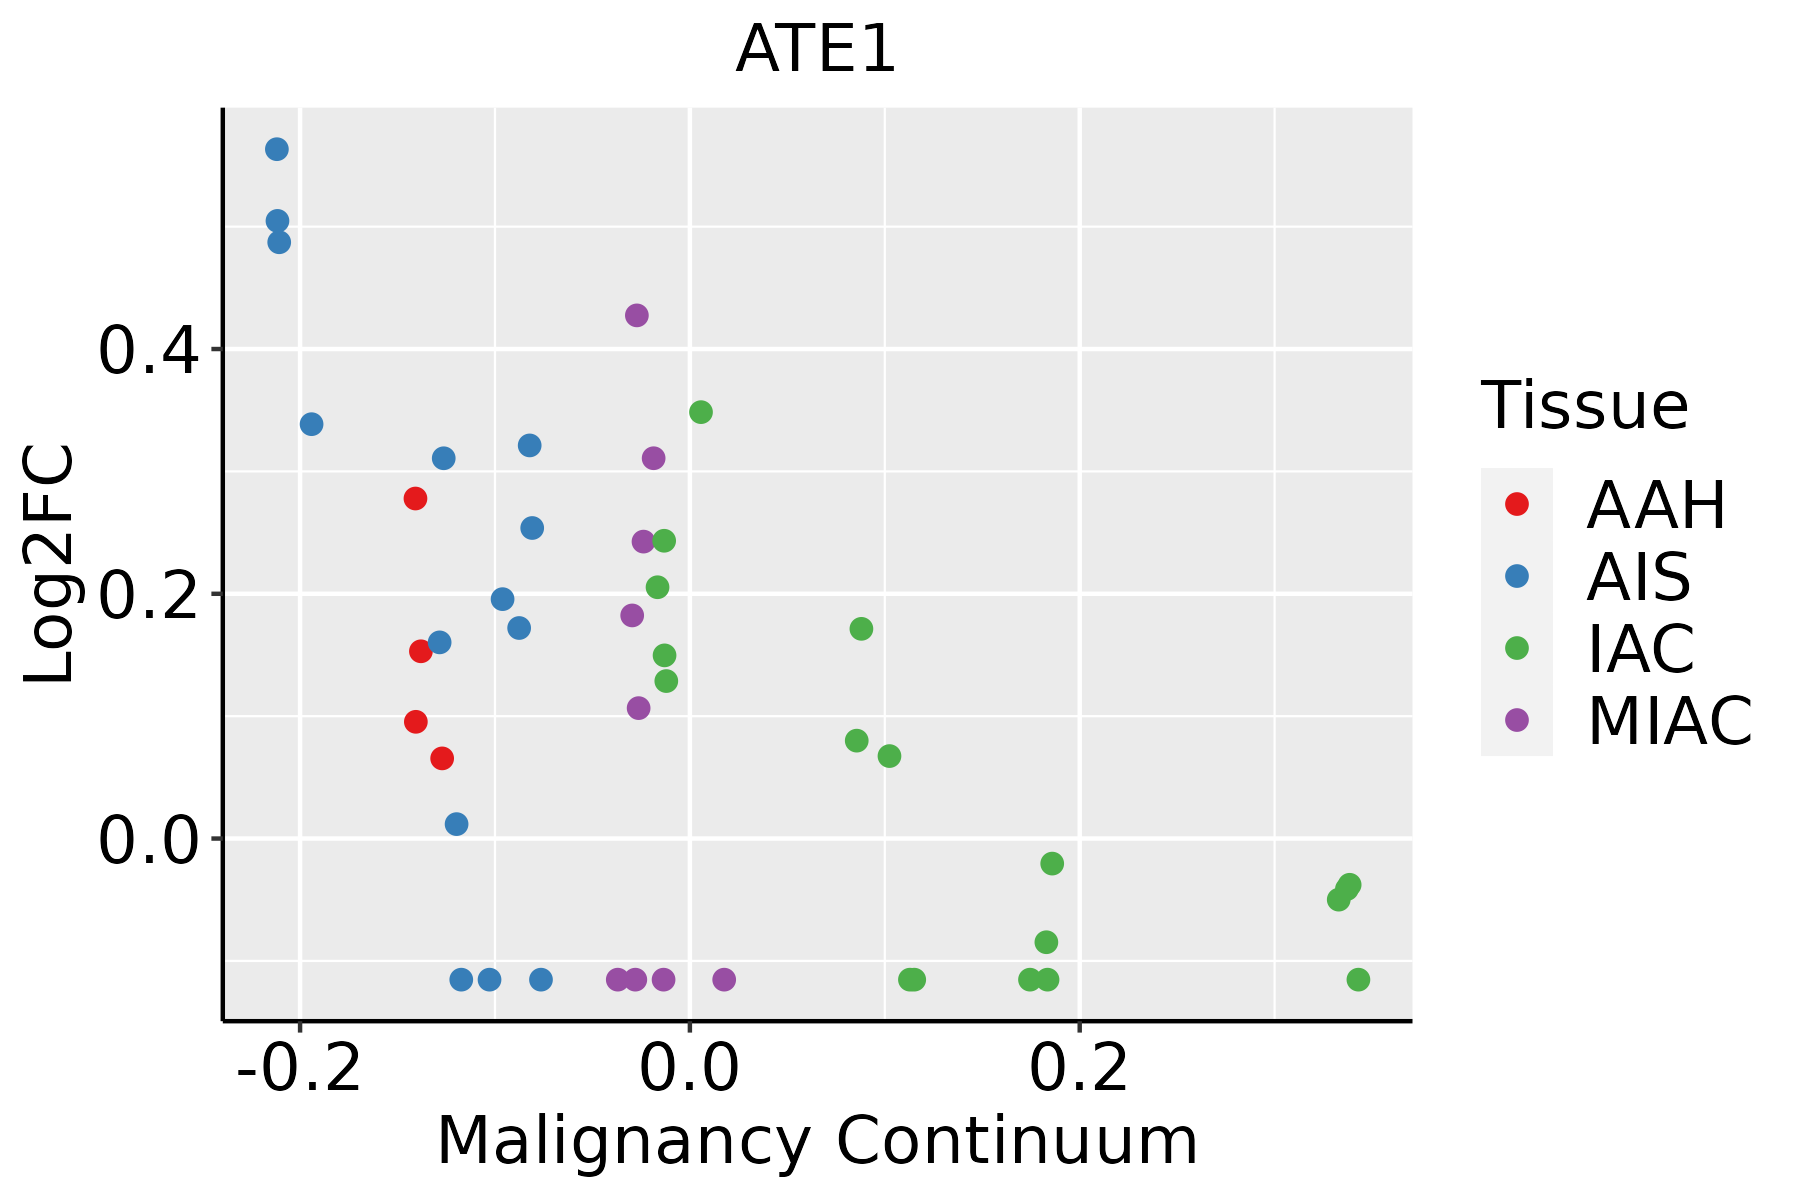 | AAH: Atypical adenomatous hyperplasia |
| AIS: Adenocarcinoma in situ | ||
| IAC: Invasive lung adenocarcinoma | ||
| MIA: Minimally invasive adenocarcinoma | ||
| Oral Cavity |  | EOLP: Erosive Oral lichen planus |
| LP: leukoplakia | ||
| NEOLP: Non-erosive oral lichen planus | ||
| OSCC: Oral squamous cell carcinoma |
| ∗log2FC in expression of this searched gene in stem-like cells from each diseased tissue sample relative to stem-like cells in normal samples in each tissue plotted against the malignancy continuum. Samples are colored based on if they are from different disease stage. |
Top |
Malignant transformation related pathway analysis |
| Find out the enriched GO biological processes and KEGG pathways involved in transition from healthy to precancer to cancer |
| Tissue | Disease Stage | Enriched GO biological Processes |
| Colorectum | AD |  |
| Colorectum | SER |  |
| Colorectum | MSS |  |
| Colorectum | MSI-H |  |
| Colorectum | FAP |  |
| ∗Top 15 enriched GO BP terms are showed in the bar plot of each disease state in each tissue. Each row represents a significant GO biological process which is colored according to the -log10(p.adjust). |
| Page: 1 2 3 4 5 6 7 8 9 |
| GO ID | Tissue | Disease Stage | Description | Gene Ratio | Bg Ratio | pvalue | p.adjust | Count |
| GO:0010498 | Colorectum | AD | proteasomal protein catabolic process | 174/3918 | 490/18723 | 3.18e-14 | 7.66e-12 | 174 |
| GO:00104982 | Colorectum | MSS | proteasomal protein catabolic process | 157/3467 | 490/18723 | 2.39e-13 | 5.25e-11 | 157 |
| GO:00104984 | Colorectum | FAP | proteasomal protein catabolic process | 110/2622 | 490/18723 | 2.12e-07 | 1.26e-05 | 110 |
| GO:00104985 | Colorectum | CRC | proteasomal protein catabolic process | 77/2078 | 490/18723 | 1.03e-03 | 1.21e-02 | 77 |
| GO:001049816 | Endometrium | AEH | proteasomal protein catabolic process | 108/2100 | 490/18723 | 2.73e-12 | 4.67e-10 | 108 |
| GO:001049817 | Endometrium | EEC | proteasomal protein catabolic process | 112/2168 | 490/18723 | 6.99e-13 | 1.40e-10 | 112 |
| GO:0010498111 | Esophagus | ESCC | proteasomal protein catabolic process | 369/8552 | 490/18723 | 1.13e-41 | 1.80e-38 | 369 |
| GO:00104987 | Liver | NAFLD | proteasomal protein catabolic process | 101/1882 | 490/18723 | 1.35e-12 | 6.09e-10 | 101 |
| GO:001049822 | Liver | HCC | proteasomal protein catabolic process | 351/7958 | 490/18723 | 6.92e-40 | 1.46e-36 | 351 |
| GO:00104988 | Lung | IAC | proteasomal protein catabolic process | 90/2061 | 490/18723 | 6.69e-07 | 3.89e-05 | 90 |
| GO:001049813 | Lung | AIS | proteasomal protein catabolic process | 87/1849 | 490/18723 | 4.15e-08 | 5.03e-06 | 87 |
| GO:001049820 | Oral cavity | OSCC | proteasomal protein catabolic process | 336/7305 | 490/18723 | 5.45e-41 | 8.63e-38 | 336 |
| GO:001049825 | Oral cavity | EOLP | proteasomal protein catabolic process | 108/2218 | 490/18723 | 7.79e-11 | 9.51e-09 | 108 |
| Page: 1 |
| Pathway ID | Tissue | Disease Stage | Description | Gene Ratio | Bg Ratio | pvalue | p.adjust | qvalue | Count |
| Page: 1 |
Top |
Cell-cell communication analysis |
| Identification of potential cell-cell interactions between two cell types and their ligand-receptor pairs for different disease states |
| Ligand | Receptor | LRpair | Pathway | Tissue | Disease Stage |
| Page: 1 |
Top |
Single-cell gene regulatory network inference analysis |
| Find out the significant the regulons (TFs) and the target genes of each regulon across cell types for different disease states |
| TF | Cell Type | Tissue | Disease Stage | Target Gene | RSS | Regulon Activity |
| ∗The dot plots of a searched regulon are shown for all cell subpopulations in each disease state of each tissue based on the regulon specific score inferred using pySCENIC and by calculating the average expression. |
| Page: 1 |
Top |
Somatic mutation of malignant transformation related genes |
| Annotation of somatic variants for genes involved in malignant transformation |
| Hugo Symbol | Variant Class | Variant Classification | dbSNP RS | HGVSc | HGVSp | HGVSp Short | SWISSPROT | BIOTYPE | SIFT | PolyPhen | Tumor Sample Barcode | Tissue | Histology | Sex | Age | Stage | Therapy Types | Drugs | Outcome |
| ATE1 | SNV | Missense_Mutation | novel | c.763N>A | p.Glu255Lys | p.E255K | O95260 | protein_coding | deleterious(0) | probably_damaging(0.919) | TCGA-AN-A046-01 | Breast | breast invasive carcinoma | Female | >=65 | I/II | Unknown | Unknown | SD |
| ATE1 | insertion | In_Frame_Ins | novel | c.1436_1437insAGTTAATATAAAGATTTTAAAACTGCATTATGACCTAGCCCC | p.Ile479_Met480insValAsnIleLysIleLeuLysLeuHisTyrAspLeuAlaPro | p.I479_M480insVNIKILKLHYDLAP | O95260 | protein_coding | TCGA-A7-A0CE-01 | Breast | breast invasive carcinoma | Female | <65 | I/II | Chemotherapy | adriamycin | SD | ||
| ATE1 | SNV | Missense_Mutation | c.1276G>A | p.Asp426Asn | p.D426N | O95260 | protein_coding | tolerated(0.06) | probably_damaging(0.993) | TCGA-IR-A3LA-01 | Cervix | cervical & endocervical cancer | Female | <65 | I/II | Chemotherapy | cisplatin | CR | |
| ATE1 | SNV | Missense_Mutation | c.756N>C | p.Lys252Asn | p.K252N | O95260 | protein_coding | deleterious(0) | probably_damaging(0.959) | TCGA-AA-3510-01 | Colorectum | colon adenocarcinoma | Male | >=65 | I/II | Unknown | Unknown | SD | |
| ATE1 | SNV | Missense_Mutation | c.856N>T | p.Ala286Ser | p.A286S | O95260 | protein_coding | tolerated(0.42) | benign(0.006) | TCGA-AA-A010-01 | Colorectum | colon adenocarcinoma | Female | <65 | I/II | Chemotherapy | folinic | CR | |
| ATE1 | SNV | Missense_Mutation | rs749513221 | c.1391G>A | p.Arg464His | p.R464H | O95260 | protein_coding | tolerated(0.58) | benign(0.003) | TCGA-AZ-4315-01 | Colorectum | colon adenocarcinoma | Male | <65 | I/II | Unknown | Unknown | SD |
| ATE1 | SNV | Missense_Mutation | rs755232792 | c.1372N>A | p.Glu458Lys | p.E458K | O95260 | protein_coding | tolerated(0.77) | benign(0) | TCGA-AZ-6601-01 | Colorectum | colon adenocarcinoma | Male | >=65 | I/II | Unknown | Unknown | PD |
| ATE1 | SNV | Missense_Mutation | rs767594848 | c.1235C>T | p.Ser412Leu | p.S412L | O95260 | protein_coding | deleterious(0) | probably_damaging(0.974) | TCGA-WS-AB45-01 | Colorectum | colon adenocarcinoma | Female | <65 | I/II | Unknown | Unknown | SD |
| ATE1 | SNV | Missense_Mutation | c.380N>C | p.Asp127Ala | p.D127A | O95260 | protein_coding | tolerated(0.07) | benign(0.164) | TCGA-AG-3892-01 | Colorectum | rectum adenocarcinoma | Female | <65 | I/II | Unknown | Unknown | SD | |
| ATE1 | SNV | Missense_Mutation | novel | c.1294N>G | p.Thr432Ala | p.T432A | O95260 | protein_coding | deleterious(0.04) | possibly_damaging(0.801) | TCGA-EI-6917-01 | Colorectum | rectum adenocarcinoma | Male | <65 | III/IV | Chemotherapy | 5fluorouracil+oxaciplatina+l-folinian | SD |
| Page: 1 2 3 4 5 |
Top |
Related drugs of malignant transformation related genes |
| Identification of chemicals and drugs interact with genes involved in malignant transfromation |
| (DGIdb 4.0) |
| Entrez ID | Symbol | Category | Interaction Types | Drug Claim Name | Drug Name | PMIDs |
| Page: 1 |

Copyright 2023-Present -The University of Texas Health Science Center at Houston |