
|
|||||
|
 | |
| |
| |
| |
| |
| |
|
Gene: ATCAY |
Gene summary for ATCAY |
| Gene information | Species | Human | Gene symbol | ATCAY | Gene ID | 85300 |
| Gene name | ATCAY kinesin light chain interacting caytaxin | |
| Gene Alias | BNIP-H | |
| Cytomap | 19p13.3 | |
| Gene Type | protein-coding | GO ID | GO:0000820 | UniProtAcc | A0A0S2Z5T8 |
Top |
Malignant transformation analysis |
| Identification of the aberrant gene expression in precancerous and cancerous lesions by comparing the gene expression of stem-like cells in diseased tissues with normal stem cells |
| Entrez ID | Symbol | Replicates | Species | Organ | Tissue | Adj P-value | Log2FC | Malignancy |
| 85300 | ATCAY | HCC1 | Human | Liver | HCC | 1.03e-21 | 2.14e+00 | 0.5336 |
| 85300 | ATCAY | HCC2 | Human | Liver | HCC | 1.03e-32 | 2.33e+00 | 0.5341 |
| 85300 | ATCAY | HCC5 | Human | Liver | HCC | 1.55e-20 | 2.04e+00 | 0.4932 |
| Page: 1 |
| Tissue | Expression Dynamics | Abbreviation |
| Liver | 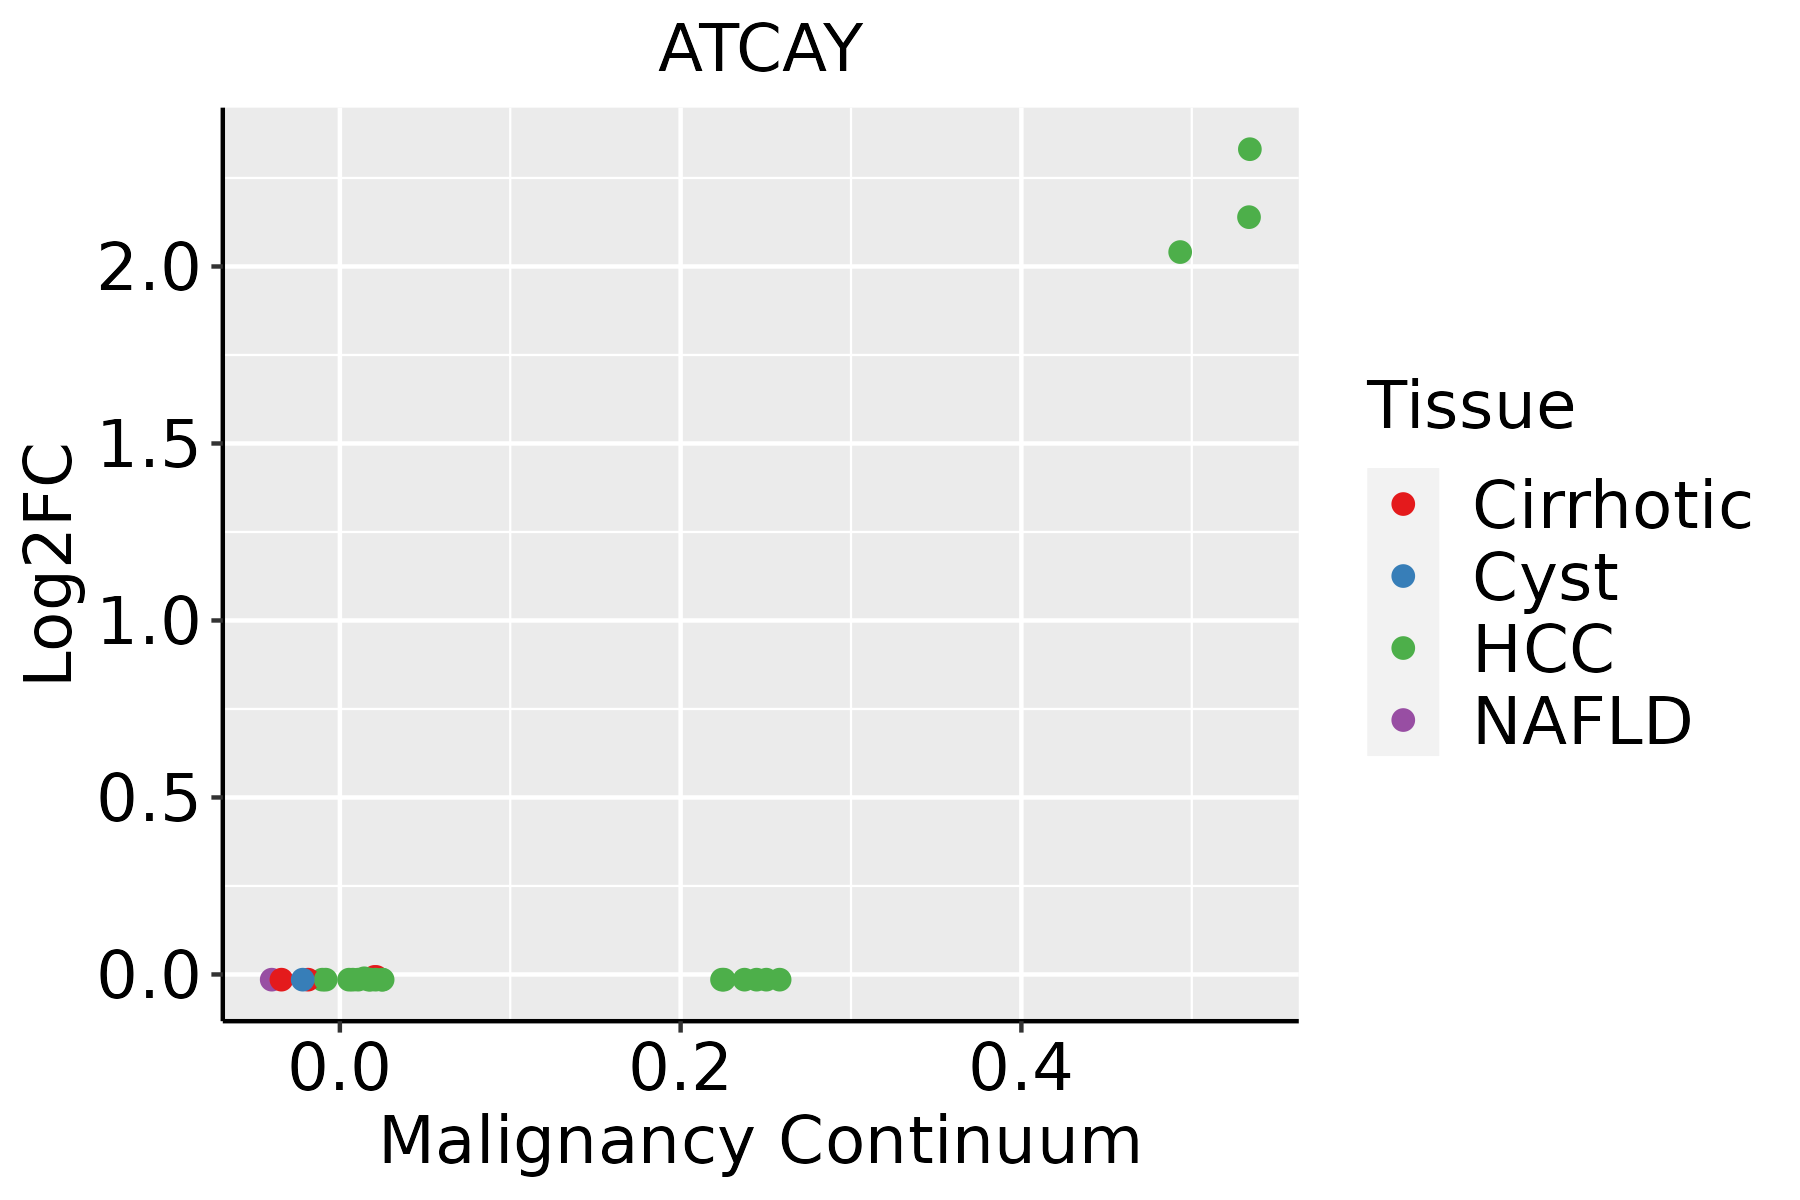 | HCC: Hepatocellular carcinoma |
| NAFLD: Non-alcoholic fatty liver disease |
| ∗log2FC in expression of this searched gene in stem-like cells from each diseased tissue sample relative to stem-like cells in normal samples in each tissue plotted against the malignancy continuum. Samples are colored based on if they are from different disease stage. |
Top |
Malignant transformation related pathway analysis |
| Find out the enriched GO biological processes and KEGG pathways involved in transition from healthy to precancer to cancer |
| Tissue | Disease Stage | Enriched GO biological Processes |
| Colorectum | AD |  |
| Colorectum | SER |  |
| Colorectum | MSS |  |
| Colorectum | MSI-H |  |
| Colorectum | FAP |  |
| ∗Top 15 enriched GO BP terms are showed in the bar plot of each disease state in each tissue. Each row represents a significant GO biological process which is colored according to the -log10(p.adjust). |
| Page: 1 2 3 4 5 6 7 8 9 |
| GO ID | Tissue | Disease Stage | Description | Gene Ratio | Bg Ratio | pvalue | p.adjust | Count |
| GO:19016052 | Liver | HCC | alpha-amino acid metabolic process | 124/7958 | 195/18723 | 2.07e-09 | 5.79e-08 | 124 |
| GO:00436482 | Liver | HCC | dicarboxylic acid metabolic process | 68/7958 | 96/18723 | 1.73e-08 | 4.14e-07 | 68 |
| GO:00065202 | Liver | HCC | cellular amino acid metabolic process | 167/7958 | 284/18723 | 1.91e-08 | 4.56e-07 | 167 |
| GO:006201222 | Liver | HCC | regulation of small molecule metabolic process | 190/7958 | 334/18723 | 6.77e-08 | 1.40e-06 | 190 |
| GO:004218021 | Liver | HCC | cellular ketone metabolic process | 123/7958 | 211/18723 | 2.52e-06 | 3.37e-05 | 123 |
| GO:0051646 | Liver | HCC | mitochondrion localization | 34/7958 | 50/18723 | 2.38e-04 | 1.79e-03 | 34 |
| GO:00105652 | Liver | HCC | regulation of cellular ketone metabolic process | 77/7958 | 133/18723 | 2.41e-04 | 1.80e-03 | 77 |
| GO:0009064 | Liver | HCC | glutamine family amino acid metabolic process | 47/7958 | 78/18723 | 1.17e-03 | 6.54e-03 | 47 |
| GO:0048311 | Liver | HCC | mitochondrion distribution | 12/7958 | 16/18723 | 8.74e-03 | 3.40e-02 | 12 |
| GO:0006536 | Liver | HCC | glutamate metabolic process | 21/7958 | 33/18723 | 1.16e-02 | 4.28e-02 | 21 |
| Page: 1 |
| Pathway ID | Tissue | Disease Stage | Description | Gene Ratio | Bg Ratio | pvalue | p.adjust | qvalue | Count |
| Page: 1 |
Top |
Cell-cell communication analysis |
| Identification of potential cell-cell interactions between two cell types and their ligand-receptor pairs for different disease states |
| Ligand | Receptor | LRpair | Pathway | Tissue | Disease Stage |
| Page: 1 |
Top |
Single-cell gene regulatory network inference analysis |
| Find out the significant the regulons (TFs) and the target genes of each regulon across cell types for different disease states |
| TF | Cell Type | Tissue | Disease Stage | Target Gene | RSS | Regulon Activity |
| ∗The dot plots of a searched regulon are shown for all cell subpopulations in each disease state of each tissue based on the regulon specific score inferred using pySCENIC and by calculating the average expression. |
| Page: 1 |
Top |
Somatic mutation of malignant transformation related genes |
| Annotation of somatic variants for genes involved in malignant transformation |
| Hugo Symbol | Variant Class | Variant Classification | dbSNP RS | HGVSc | HGVSp | HGVSp Short | SWISSPROT | BIOTYPE | SIFT | PolyPhen | Tumor Sample Barcode | Tissue | Histology | Sex | Age | Stage | Therapy Types | Drugs | Outcome |
| ATCAY | SNV | Missense_Mutation | novel | c.232T>G | p.Ser78Ala | p.S78A | Q86WG3 | protein_coding | tolerated(0.05) | benign(0.426) | TCGA-AN-A0FV-01 | Breast | breast invasive carcinoma | Female | <65 | I/II | Unknown | Unknown | SD |
| ATCAY | SNV | Missense_Mutation | c.731N>C | p.Met244Thr | p.M244T | Q86WG3 | protein_coding | deleterious(0) | benign(0.298) | TCGA-BH-A18R-01 | Breast | breast invasive carcinoma | Female | <65 | I/II | Unknown | Unknown | SD | |
| ATCAY | SNV | Missense_Mutation | c.494N>A | p.Arg165His | p.R165H | Q86WG3 | protein_coding | deleterious(0.05) | probably_damaging(0.941) | TCGA-E9-A1R5-01 | Breast | breast invasive carcinoma | Female | <65 | I/II | Hormone Therapy | tamoxiphen | SD | |
| ATCAY | insertion | Frame_Shift_Ins | novel | c.309_310insACAGTTTCACTCTGTC | p.Asp105ValfsTer129 | p.D105Vfs*129 | Q86WG3 | protein_coding | TCGA-A8-A094-01 | Breast | breast invasive carcinoma | Female | >=65 | I/II | Unknown | Unknown | SD | ||
| ATCAY | SNV | Missense_Mutation | c.29N>C | p.Met10Thr | p.M10T | Q86WG3 | protein_coding | deleterious(0.04) | probably_damaging(0.942) | TCGA-WL-A834-01 | Cervix | cervical & endocervical cancer | Female | <65 | I/II | Chemotherapy | paclitaxel | SD | |
| ATCAY | SNV | Missense_Mutation | c.182A>G | p.Lys61Arg | p.K61R | Q86WG3 | protein_coding | tolerated(0.29) | benign(0.02) | TCGA-AA-3663-01 | Colorectum | colon adenocarcinoma | Male | <65 | I/II | Unknown | Unknown | SD | |
| ATCAY | SNV | Missense_Mutation | rs755058816 | c.533T>C | p.Val178Ala | p.V178A | Q86WG3 | protein_coding | deleterious(0) | possibly_damaging(0.593) | TCGA-AA-3663-01 | Colorectum | colon adenocarcinoma | Male | <65 | I/II | Unknown | Unknown | SD |
| ATCAY | SNV | Missense_Mutation | rs199662587 | c.173N>A | p.Arg58His | p.R58H | Q86WG3 | protein_coding | tolerated(0.23) | benign(0.067) | TCGA-AA-3812-01 | Colorectum | colon adenocarcinoma | Female | >=65 | I/II | Unknown | Unknown | PD |
| ATCAY | SNV | Missense_Mutation | novel | c.20N>T | p.Thr7Met | p.T7M | Q86WG3 | protein_coding | deleterious(0.01) | probably_damaging(0.953) | TCGA-AA-3869-01 | Colorectum | colon adenocarcinoma | Male | >=65 | III/IV | Chemotherapy | capecitabine | PD |
| ATCAY | SNV | Missense_Mutation | c.252C>A | p.Phe84Leu | p.F84L | Q86WG3 | protein_coding | tolerated(0.64) | benign(0.023) | TCGA-AA-A010-01 | Colorectum | colon adenocarcinoma | Female | <65 | I/II | Chemotherapy | folinic | CR |
| Page: 1 2 3 4 5 6 |
Top |
Related drugs of malignant transformation related genes |
| Identification of chemicals and drugs interact with genes involved in malignant transfromation |
| (DGIdb 4.0) |
| Entrez ID | Symbol | Category | Interaction Types | Drug Claim Name | Drug Name | PMIDs |
| Page: 1 |

Copyright 2023-Present -The University of Texas Health Science Center at Houston |