
|
|||||
|
 | |
| |
| |
| |
| |
| |
|
Gene: ATAD5 |
Gene summary for ATAD5 |
| Gene information | Species | Human | Gene symbol | ATAD5 | Gene ID | 79915 |
| Gene name | ATPase family AAA domain containing 5 | |
| Gene Alias | C17orf41 | |
| Cytomap | 17q11.2 | |
| Gene Type | protein-coding | GO ID | GO:0006260 | UniProtAcc | Q96QE3 |
Top |
Malignant transformation analysis |
| Identification of the aberrant gene expression in precancerous and cancerous lesions by comparing the gene expression of stem-like cells in diseased tissues with normal stem cells |
| Entrez ID | Symbol | Replicates | Species | Organ | Tissue | Adj P-value | Log2FC | Malignancy |
| 79915 | ATAD5 | HTA11_1938_2000001011 | Human | Colorectum | AD | 3.99e-02 | 3.18e-01 | -0.0811 |
| 79915 | ATAD5 | HTA11_347_2000001011 | Human | Colorectum | AD | 6.58e-09 | 4.89e-01 | -0.1954 |
| 79915 | ATAD5 | HTA11_411_2000001011 | Human | Colorectum | SER | 2.86e-03 | 6.84e-01 | -0.2602 |
| 79915 | ATAD5 | HTA11_696_2000001011 | Human | Colorectum | AD | 5.45e-03 | 3.14e-01 | -0.1464 |
| 79915 | ATAD5 | HTA11_866_2000001011 | Human | Colorectum | AD | 8.07e-06 | 3.42e-01 | -0.1001 |
| 79915 | ATAD5 | HTA11_1391_2000001011 | Human | Colorectum | AD | 4.25e-04 | 4.25e-01 | -0.059 |
| 79915 | ATAD5 | HTA11_546_2000001011 | Human | Colorectum | AD | 2.64e-03 | 4.12e-01 | -0.0842 |
| 79915 | ATAD5 | HTA11_7696_3000711011 | Human | Colorectum | AD | 4.46e-02 | 2.37e-01 | 0.0674 |
| 79915 | ATAD5 | HTA11_99999971662_82457 | Human | Colorectum | MSS | 4.40e-05 | 4.69e-01 | 0.3859 |
| 79915 | ATAD5 | HTA11_99999974143_84620 | Human | Colorectum | MSS | 1.12e-07 | 3.68e-01 | 0.3005 |
| 79915 | ATAD5 | A002-C-116 | Human | Colorectum | FAP | 1.91e-02 | -3.04e-02 | -0.0452 |
| 79915 | ATAD5 | GSM6177620_NYU_UCEC1_lib3_lib3 | Human | Endometrium | EEC | 1.16e-04 | 9.23e-03 | -0.1883 |
| 79915 | ATAD5 | GSM6177622_NYU_UCEC3_lib2_lib2 | Human | Endometrium | EEC | 2.49e-04 | -4.61e-03 | -0.1916 |
| 79915 | ATAD5 | LZE7T | Human | Esophagus | ESCC | 2.55e-08 | 4.26e-01 | 0.0667 |
| 79915 | ATAD5 | LZE24T | Human | Esophagus | ESCC | 1.91e-02 | 1.52e-01 | 0.0596 |
| 79915 | ATAD5 | P1T-E | Human | Esophagus | ESCC | 2.46e-05 | 3.77e-01 | 0.0875 |
| 79915 | ATAD5 | P2T-E | Human | Esophagus | ESCC | 6.38e-31 | 6.32e-01 | 0.1177 |
| 79915 | ATAD5 | P4T-E | Human | Esophagus | ESCC | 5.71e-08 | 2.43e-01 | 0.1323 |
| 79915 | ATAD5 | P5T-E | Human | Esophagus | ESCC | 3.60e-13 | 2.74e-01 | 0.1327 |
| 79915 | ATAD5 | P8T-E | Human | Esophagus | ESCC | 4.41e-07 | 1.46e-01 | 0.0889 |
| Page: 1 2 3 |
| Tissue | Expression Dynamics | Abbreviation |
| Colorectum (GSE201348) | 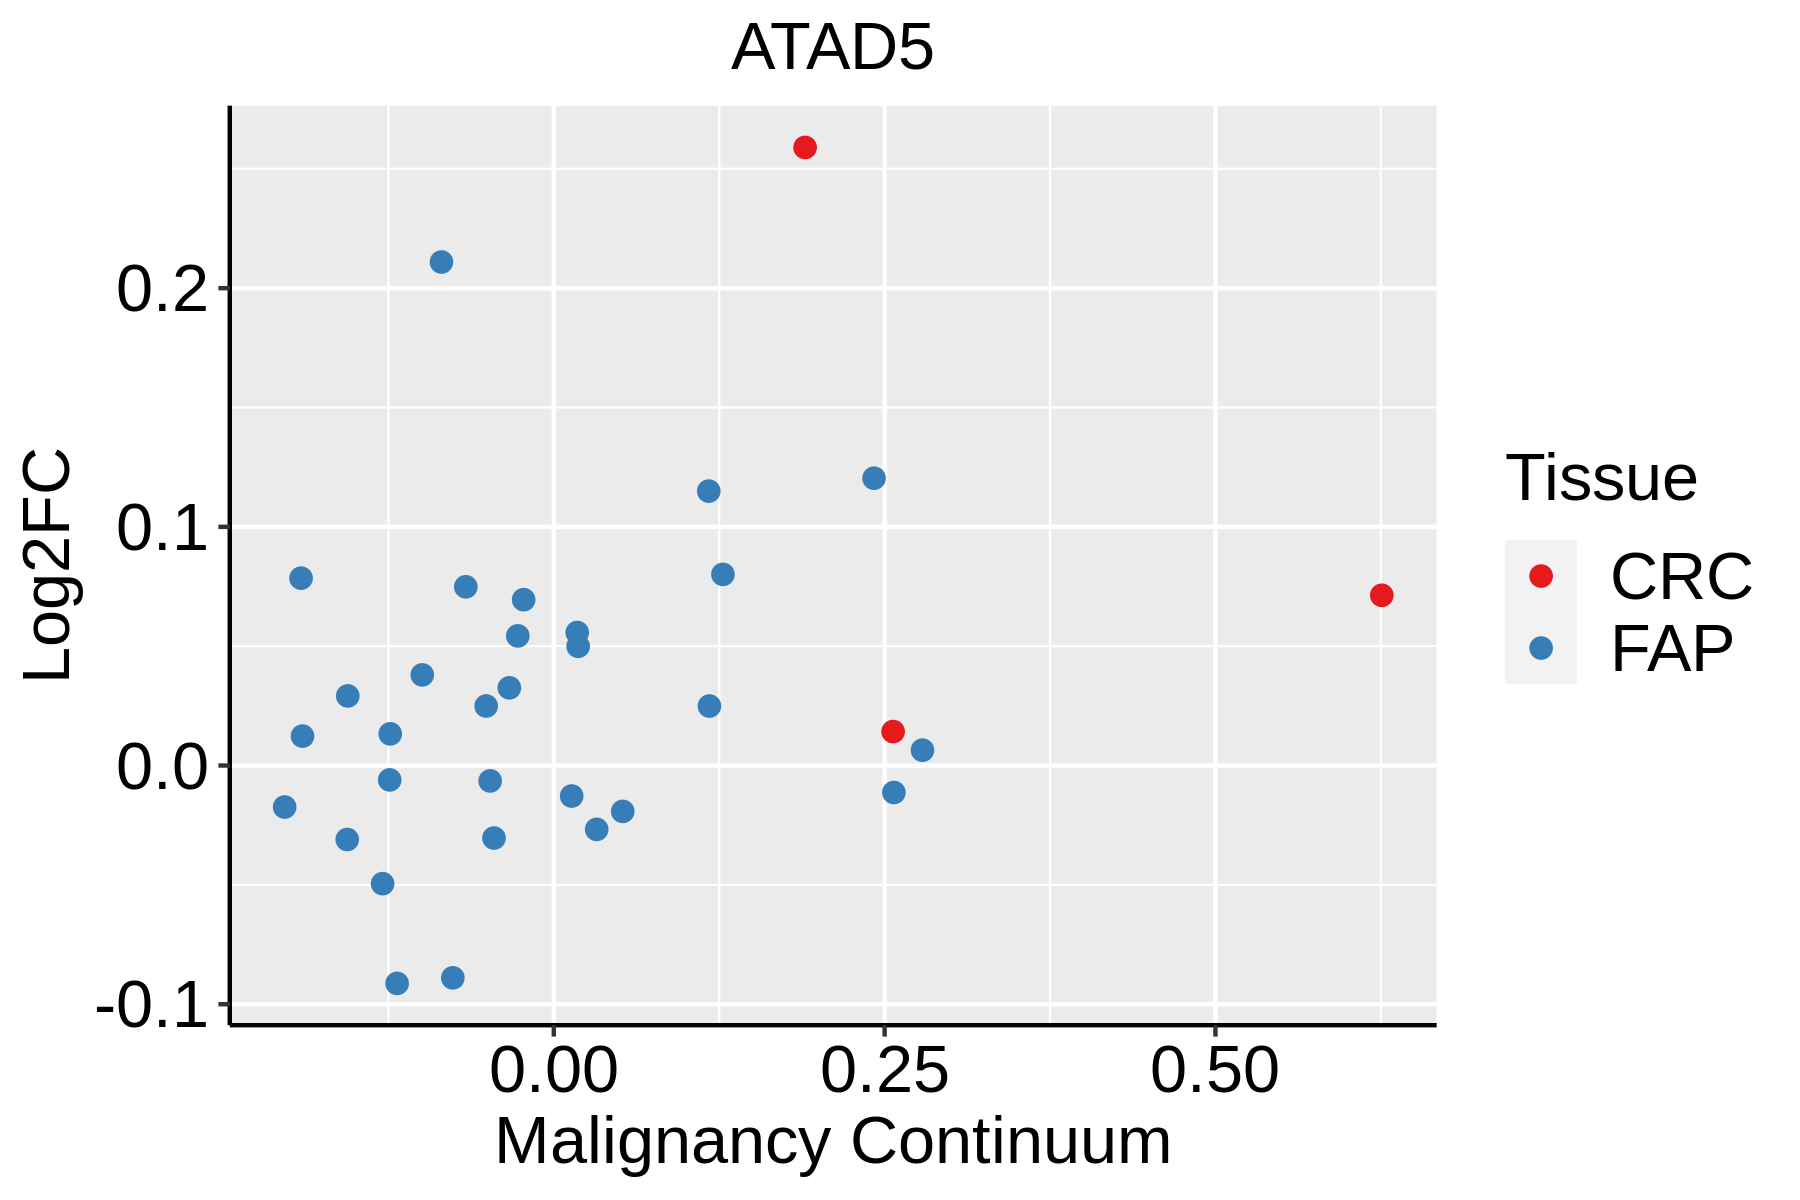 | FAP: Familial adenomatous polyposis |
| CRC: Colorectal cancer | ||
| Colorectum (HTA11) |  | AD: Adenomas |
| SER: Sessile serrated lesions | ||
| MSI-H: Microsatellite-high colorectal cancer | ||
| MSS: Microsatellite stable colorectal cancer | ||
| Endometrium | 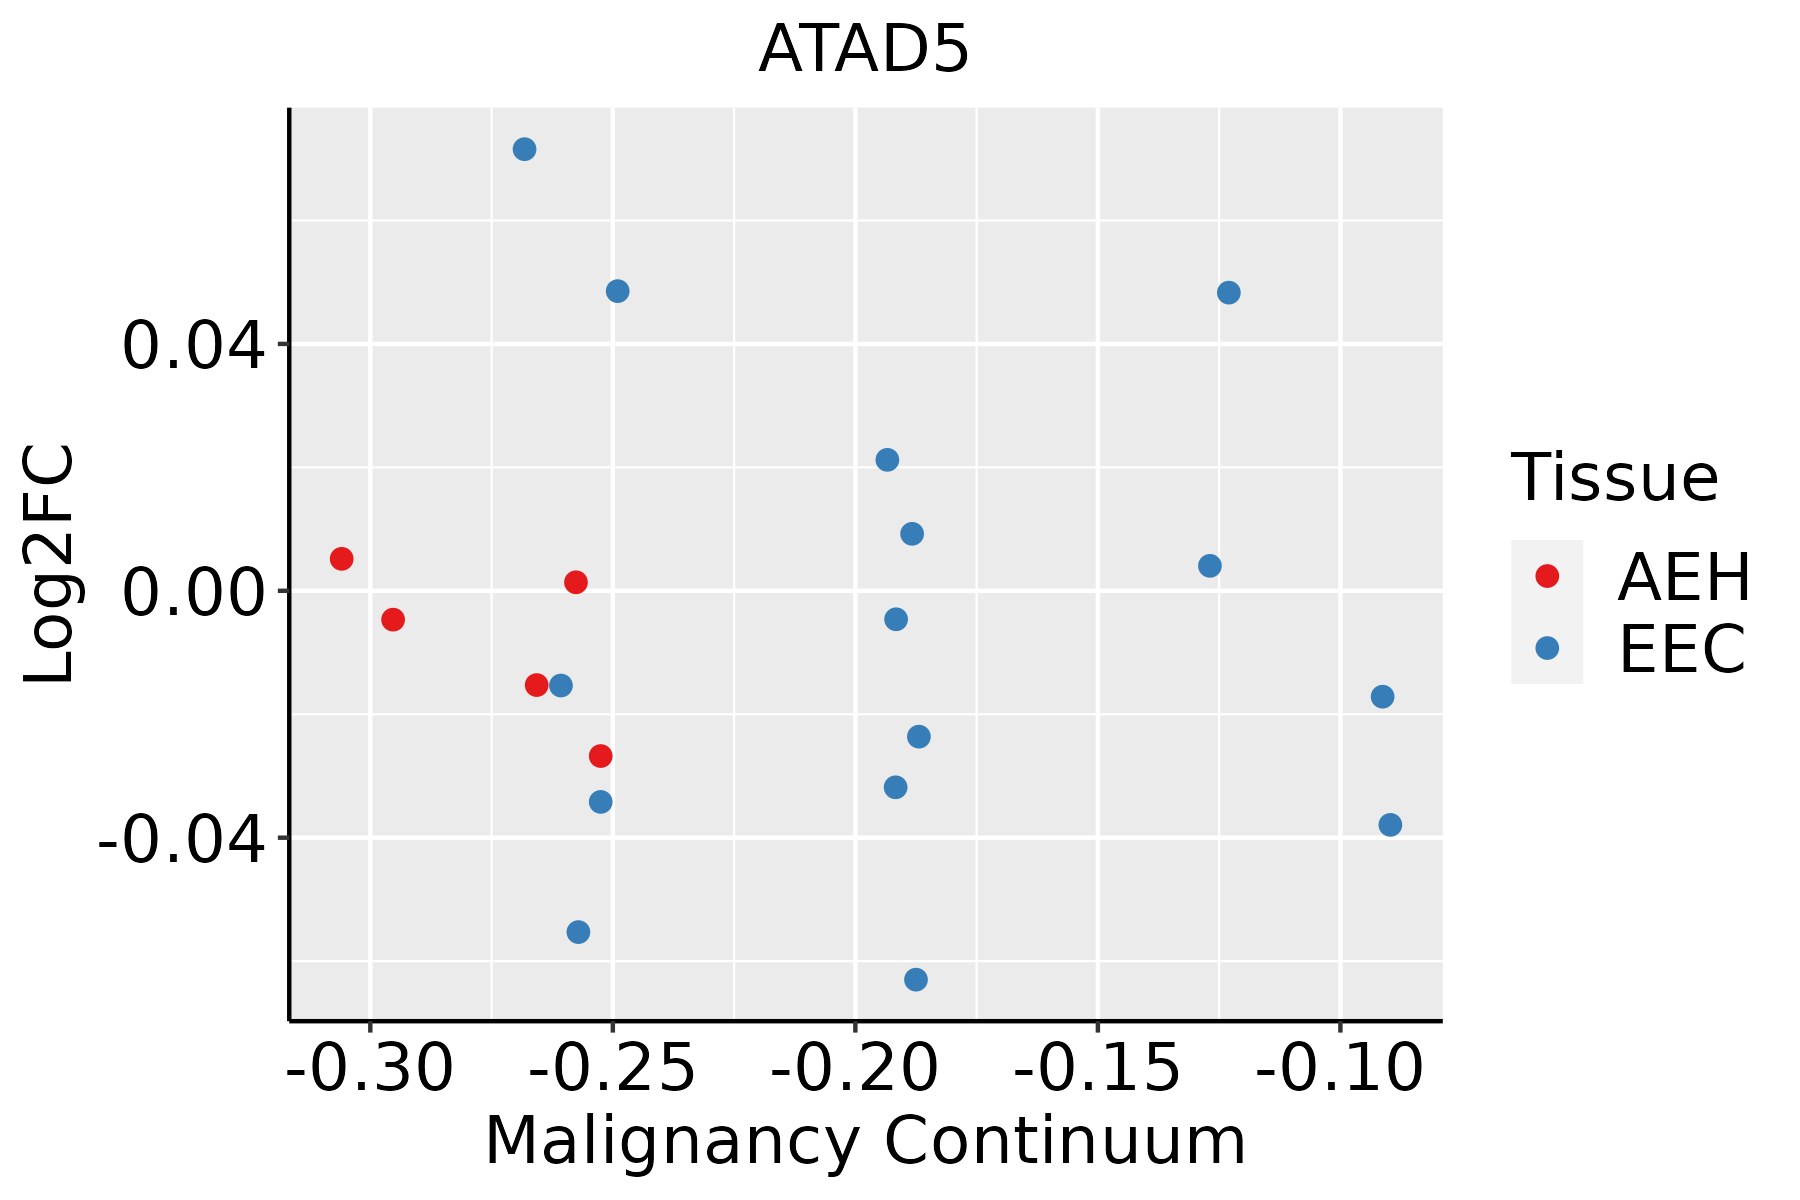 | AEH: Atypical endometrial hyperplasia |
| EEC: Endometrioid Cancer | ||
| Esophagus |  | ESCC: Esophageal squamous cell carcinoma |
| HGIN: High-grade intraepithelial neoplasias | ||
| LGIN: Low-grade intraepithelial neoplasias |
| ∗log2FC in expression of this searched gene in stem-like cells from each diseased tissue sample relative to stem-like cells in normal samples in each tissue plotted against the malignancy continuum. Samples are colored based on if they are from different disease stage. |
Top |
Malignant transformation related pathway analysis |
| Find out the enriched GO biological processes and KEGG pathways involved in transition from healthy to precancer to cancer |
| Tissue | Disease Stage | Enriched GO biological Processes |
| Colorectum | AD |  |
| Colorectum | SER |  |
| Colorectum | MSS |  |
| Colorectum | MSI-H |  |
| Colorectum | FAP |  |
| ∗Top 15 enriched GO BP terms are showed in the bar plot of each disease state in each tissue. Each row represents a significant GO biological process which is colored according to the -log10(p.adjust). |
| Page: 1 2 3 4 5 6 7 8 9 |
| GO ID | Tissue | Disease Stage | Description | Gene Ratio | Bg Ratio | pvalue | p.adjust | Count |
| GO:0045787 | Colorectum | AD | positive regulation of cell cycle | 85/3918 | 313/18723 | 4.76e-03 | 3.22e-02 | 85 |
| GO:00457871 | Colorectum | MSS | positive regulation of cell cycle | 80/3467 | 313/18723 | 1.15e-03 | 1.12e-02 | 80 |
| GO:0090068 | Colorectum | MSS | positive regulation of cell cycle process | 60/3467 | 236/18723 | 5.01e-03 | 3.46e-02 | 60 |
| GO:00457872 | Colorectum | FAP | positive regulation of cell cycle | 66/2622 | 313/18723 | 3.66e-04 | 4.63e-03 | 66 |
| GO:00900681 | Colorectum | FAP | positive regulation of cell cycle process | 48/2622 | 236/18723 | 4.53e-03 | 3.08e-02 | 48 |
| GO:004578713 | Endometrium | EEC | positive regulation of cell cycle | 59/2168 | 313/18723 | 1.04e-04 | 1.44e-03 | 59 |
| GO:009006812 | Endometrium | EEC | positive regulation of cell cycle process | 44/2168 | 236/18723 | 9.39e-04 | 8.42e-03 | 44 |
| GO:000627511 | Endometrium | EEC | regulation of DNA replication | 22/2168 | 107/18723 | 5.09e-03 | 3.20e-02 | 22 |
| GO:19019893 | Endometrium | EEC | positive regulation of cell cycle phase transition | 23/2168 | 115/18723 | 6.04e-03 | 3.57e-02 | 23 |
| GO:00062604 | Esophagus | ESCC | DNA replication | 181/8552 | 260/18723 | 3.55e-15 | 2.05e-13 | 181 |
| GO:190198713 | Esophagus | ESCC | regulation of cell cycle phase transition | 242/8552 | 390/18723 | 3.86e-11 | 1.26e-09 | 242 |
| GO:004578710 | Esophagus | ESCC | positive regulation of cell cycle | 196/8552 | 313/18723 | 9.27e-10 | 2.24e-08 | 196 |
| GO:00448394 | Esophagus | ESCC | cell cycle G2/M phase transition | 103/8552 | 148/18723 | 3.09e-09 | 6.67e-08 | 103 |
| GO:00062754 | Esophagus | ESCC | regulation of DNA replication | 73/8552 | 107/18723 | 1.97e-06 | 2.28e-05 | 73 |
| GO:19019896 | Esophagus | ESCC | positive regulation of cell cycle phase transition | 77/8552 | 115/18723 | 3.20e-06 | 3.58e-05 | 77 |
| GO:00900689 | Esophagus | ESCC | positive regulation of cell cycle process | 142/8552 | 236/18723 | 4.79e-06 | 5.08e-05 | 142 |
| GO:19027491 | Esophagus | ESCC | regulation of cell cycle G2/M phase transition | 68/8552 | 102/18723 | 1.48e-05 | 1.33e-04 | 68 |
| GO:19027511 | Esophagus | ESCC | positive regulation of cell cycle G2/M phase transition | 22/8552 | 30/18723 | 1.98e-03 | 8.90e-03 | 22 |
| GO:00457406 | Esophagus | ESCC | positive regulation of DNA replication | 26/8552 | 40/18723 | 1.08e-02 | 3.66e-02 | 26 |
| Page: 1 |
| Pathway ID | Tissue | Disease Stage | Description | Gene Ratio | Bg Ratio | pvalue | p.adjust | qvalue | Count |
| Page: 1 |
Top |
Cell-cell communication analysis |
| Identification of potential cell-cell interactions between two cell types and their ligand-receptor pairs for different disease states |
| Ligand | Receptor | LRpair | Pathway | Tissue | Disease Stage |
| Page: 1 |
Top |
Single-cell gene regulatory network inference analysis |
| Find out the significant the regulons (TFs) and the target genes of each regulon across cell types for different disease states |
| TF | Cell Type | Tissue | Disease Stage | Target Gene | RSS | Regulon Activity |
| ∗The dot plots of a searched regulon are shown for all cell subpopulations in each disease state of each tissue based on the regulon specific score inferred using pySCENIC and by calculating the average expression. |
| Page: 1 |
Top |
Somatic mutation of malignant transformation related genes |
| Annotation of somatic variants for genes involved in malignant transformation |
| Hugo Symbol | Variant Class | Variant Classification | dbSNP RS | HGVSc | HGVSp | HGVSp Short | SWISSPROT | BIOTYPE | SIFT | PolyPhen | Tumor Sample Barcode | Tissue | Histology | Sex | Age | Stage | Therapy Types | Drugs | Outcome |
| ATAD5 | SNV | Missense_Mutation | c.1648C>G | p.Leu550Val | p.L550V | Q96QE3 | protein_coding | tolerated(0.18) | benign(0.01) | TCGA-A2-A0CL-01 | Breast | breast invasive carcinoma | Female | <65 | III/IV | Chemotherapy | cytoxan | SD | |
| ATAD5 | SNV | Missense_Mutation | c.5176A>G | p.Lys1726Glu | p.K1726E | Q96QE3 | protein_coding | deleterious(0.02) | benign(0.057) | TCGA-A8-A09T-01 | Breast | breast invasive carcinoma | Female | >=65 | I/II | Hormone Therapy | anastrozole | SD | |
| ATAD5 | SNV | Missense_Mutation | c.4674N>C | p.Leu1558Phe | p.L1558F | Q96QE3 | protein_coding | tolerated(0.7) | benign(0.011) | TCGA-AC-A23H-01 | Breast | breast invasive carcinoma | Female | >=65 | I/II | Unknown | Unknown | PD | |
| ATAD5 | SNV | Missense_Mutation | c.5485N>G | p.Leu1829Val | p.L1829V | Q96QE3 | protein_coding | deleterious(0) | probably_damaging(0.991) | TCGA-BH-A18P-01 | Breast | breast invasive carcinoma | Female | <65 | I/II | Unknown | Unknown | PD | |
| ATAD5 | SNV | Missense_Mutation | c.5216N>T | p.Arg1739Ile | p.R1739I | Q96QE3 | protein_coding | deleterious(0.02) | benign(0.143) | TCGA-C8-A26Y-01 | Breast | breast invasive carcinoma | Female | >=65 | I/II | Unknown | Unknown | SD | |
| ATAD5 | SNV | Missense_Mutation | c.4984N>T | p.Leu1662Phe | p.L1662F | Q96QE3 | protein_coding | tolerated(0.24) | benign(0.026) | TCGA-D8-A1XY-01 | Breast | breast invasive carcinoma | Female | >=65 | I/II | Chemotherapy | tamoxiphen | SD | |
| ATAD5 | SNV | Missense_Mutation | c.1576N>C | p.Glu526Gln | p.E526Q | Q96QE3 | protein_coding | deleterious(0.05) | benign(0.261) | TCGA-E2-A10C-01 | Breast | breast invasive carcinoma | Female | <65 | I/II | Chemotherapy | cytoxan | SD | |
| ATAD5 | SNV | Missense_Mutation | c.4243N>G | p.Pro1415Ala | p.P1415A | Q96QE3 | protein_coding | tolerated(0.24) | benign(0.191) | TCGA-E2-A1L8-01 | Breast | breast invasive carcinoma | Female | <65 | I/II | Chemotherapy | cyclophosphamide | SD | |
| ATAD5 | SNV | Missense_Mutation | c.2606N>A | p.Arg869Lys | p.R869K | Q96QE3 | protein_coding | tolerated(0.68) | benign(0.024) | TCGA-GM-A2D9-01 | Breast | breast invasive carcinoma | Female | >=65 | I/II | Hormone Therapy | arimidex | SD | |
| ATAD5 | SNV | Missense_Mutation | c.2319G>C | p.Leu773Phe | p.L773F | Q96QE3 | protein_coding | deleterious(0) | probably_damaging(0.998) | TCGA-FU-A23L-01 | Cervix | cervical & endocervical cancer | Female | <65 | I/II | Chemotherapy | cisplatin | CR |
| Page: 1 2 3 4 5 6 7 8 9 10 11 12 13 14 15 16 17 |
Top |
Related drugs of malignant transformation related genes |
| Identification of chemicals and drugs interact with genes involved in malignant transfromation |
| (DGIdb 4.0) |
| Entrez ID | Symbol | Category | Interaction Types | Drug Claim Name | Drug Name | PMIDs |
| 79915 | ATAD5 | NA | DOMPERIDONE | DOMPERIDONE | ||
| 79915 | ATAD5 | NA | DNDI1417132 | CHEMBL1492017 | ||
| 79915 | ATAD5 | NA | EMETINE | EMETINE | ||
| 79915 | ATAD5 | NA | GNF-PF-4418 | CHEMBL604321 | ||
| 79915 | ATAD5 | NA | GNF-PF-5159 | CHEMBL1493528 | ||
| 79915 | ATAD5 | NA | GNF-PF-5183 | CHEMBL577660 | ||
| 79915 | ATAD5 | NA | DICHLORORIBOBENZIMIDAZOLE | DICHLORORIBOBENZIMIDAZOLE | ||
| 79915 | ATAD5 | NA | DNDI1417195 | CHEMBL1303948 | ||
| 79915 | ATAD5 | NA | 4,5,6,7-TETRABROMOBENZIMIDAZOLE | CHEMBL373937 | ||
| 79915 | ATAD5 | NA | 4'-HYDROXYPHENYL-BENZO[D]THIAZOLE | CHEMBL47875 |
| Page: 1 2 3 4 5 6 7 8 9 10 11 12 13 14 15 16 17 18 19 20 21 22 23 24 25 26 27 28 29 30 |

Copyright 2023-Present -The University of Texas Health Science Center at Houston |