
|
|||||
|
 | |
| |
| |
| |
| |
| |
|
Gene: ATAD3C |
Gene summary for ATAD3C |
| Gene information | Species | Human | Gene symbol | ATAD3C | Gene ID | 219293 |
| Gene name | ATPase family AAA domain containing 3C | |
| Gene Alias | ATAD3C | |
| Cytomap | 1p36.33 | |
| Gene Type | protein-coding | GO ID | GO:0006996 | UniProtAcc | Q5T2N8 |
Top |
Malignant transformation analysis |
| Identification of the aberrant gene expression in precancerous and cancerous lesions by comparing the gene expression of stem-like cells in diseased tissues with normal stem cells |
| Entrez ID | Symbol | Replicates | Species | Organ | Tissue | Adj P-value | Log2FC | Malignancy |
| 219293 | ATAD3C | P2T-E | Human | Esophagus | ESCC | 3.08e-03 | 1.86e-02 | 0.1177 |
| 219293 | ATAD3C | P4T-E | Human | Esophagus | ESCC | 6.57e-08 | 1.85e-01 | 0.1323 |
| 219293 | ATAD3C | P8T-E | Human | Esophagus | ESCC | 9.61e-21 | 3.66e-01 | 0.0889 |
| 219293 | ATAD3C | P10T-E | Human | Esophagus | ESCC | 7.94e-04 | 4.65e-02 | 0.116 |
| 219293 | ATAD3C | P11T-E | Human | Esophagus | ESCC | 2.21e-03 | 1.61e-01 | 0.1426 |
| 219293 | ATAD3C | P20T-E | Human | Esophagus | ESCC | 2.27e-06 | 1.40e-01 | 0.1124 |
| 219293 | ATAD3C | P24T-E | Human | Esophagus | ESCC | 2.73e-07 | 6.10e-02 | 0.1287 |
| 219293 | ATAD3C | P27T-E | Human | Esophagus | ESCC | 2.65e-11 | 2.21e-01 | 0.1055 |
| 219293 | ATAD3C | P28T-E | Human | Esophagus | ESCC | 3.09e-02 | 4.04e-02 | 0.1149 |
| 219293 | ATAD3C | P54T-E | Human | Esophagus | ESCC | 2.72e-02 | 5.67e-02 | 0.0975 |
| 219293 | ATAD3C | P57T-E | Human | Esophagus | ESCC | 1.80e-05 | 1.69e-01 | 0.0926 |
| 219293 | ATAD3C | P65T-E | Human | Esophagus | ESCC | 5.88e-27 | 5.13e-01 | 0.0978 |
| 219293 | ATAD3C | P74T-E | Human | Esophagus | ESCC | 9.43e-22 | 3.87e-01 | 0.1479 |
| 219293 | ATAD3C | P75T-E | Human | Esophagus | ESCC | 4.79e-09 | 1.84e-01 | 0.1125 |
| 219293 | ATAD3C | P76T-E | Human | Esophagus | ESCC | 1.06e-03 | 1.08e-01 | 0.1207 |
| 219293 | ATAD3C | P128T-E | Human | Esophagus | ESCC | 1.04e-18 | 5.88e-01 | 0.1241 |
| 219293 | ATAD3C | P130T-E | Human | Esophagus | ESCC | 4.18e-09 | 2.53e-01 | 0.1676 |
| 219293 | ATAD3C | HCC1 | Human | Liver | HCC | 5.89e-12 | 1.10e+00 | 0.5336 |
| 219293 | ATAD3C | HCC2 | Human | Liver | HCC | 4.90e-35 | 2.82e+00 | 0.5341 |
| 219293 | ATAD3C | HCC5 | Human | Liver | HCC | 1.40e-27 | 1.46e+00 | 0.4932 |
| Page: 1 |
| Tissue | Expression Dynamics | Abbreviation |
| Esophagus | 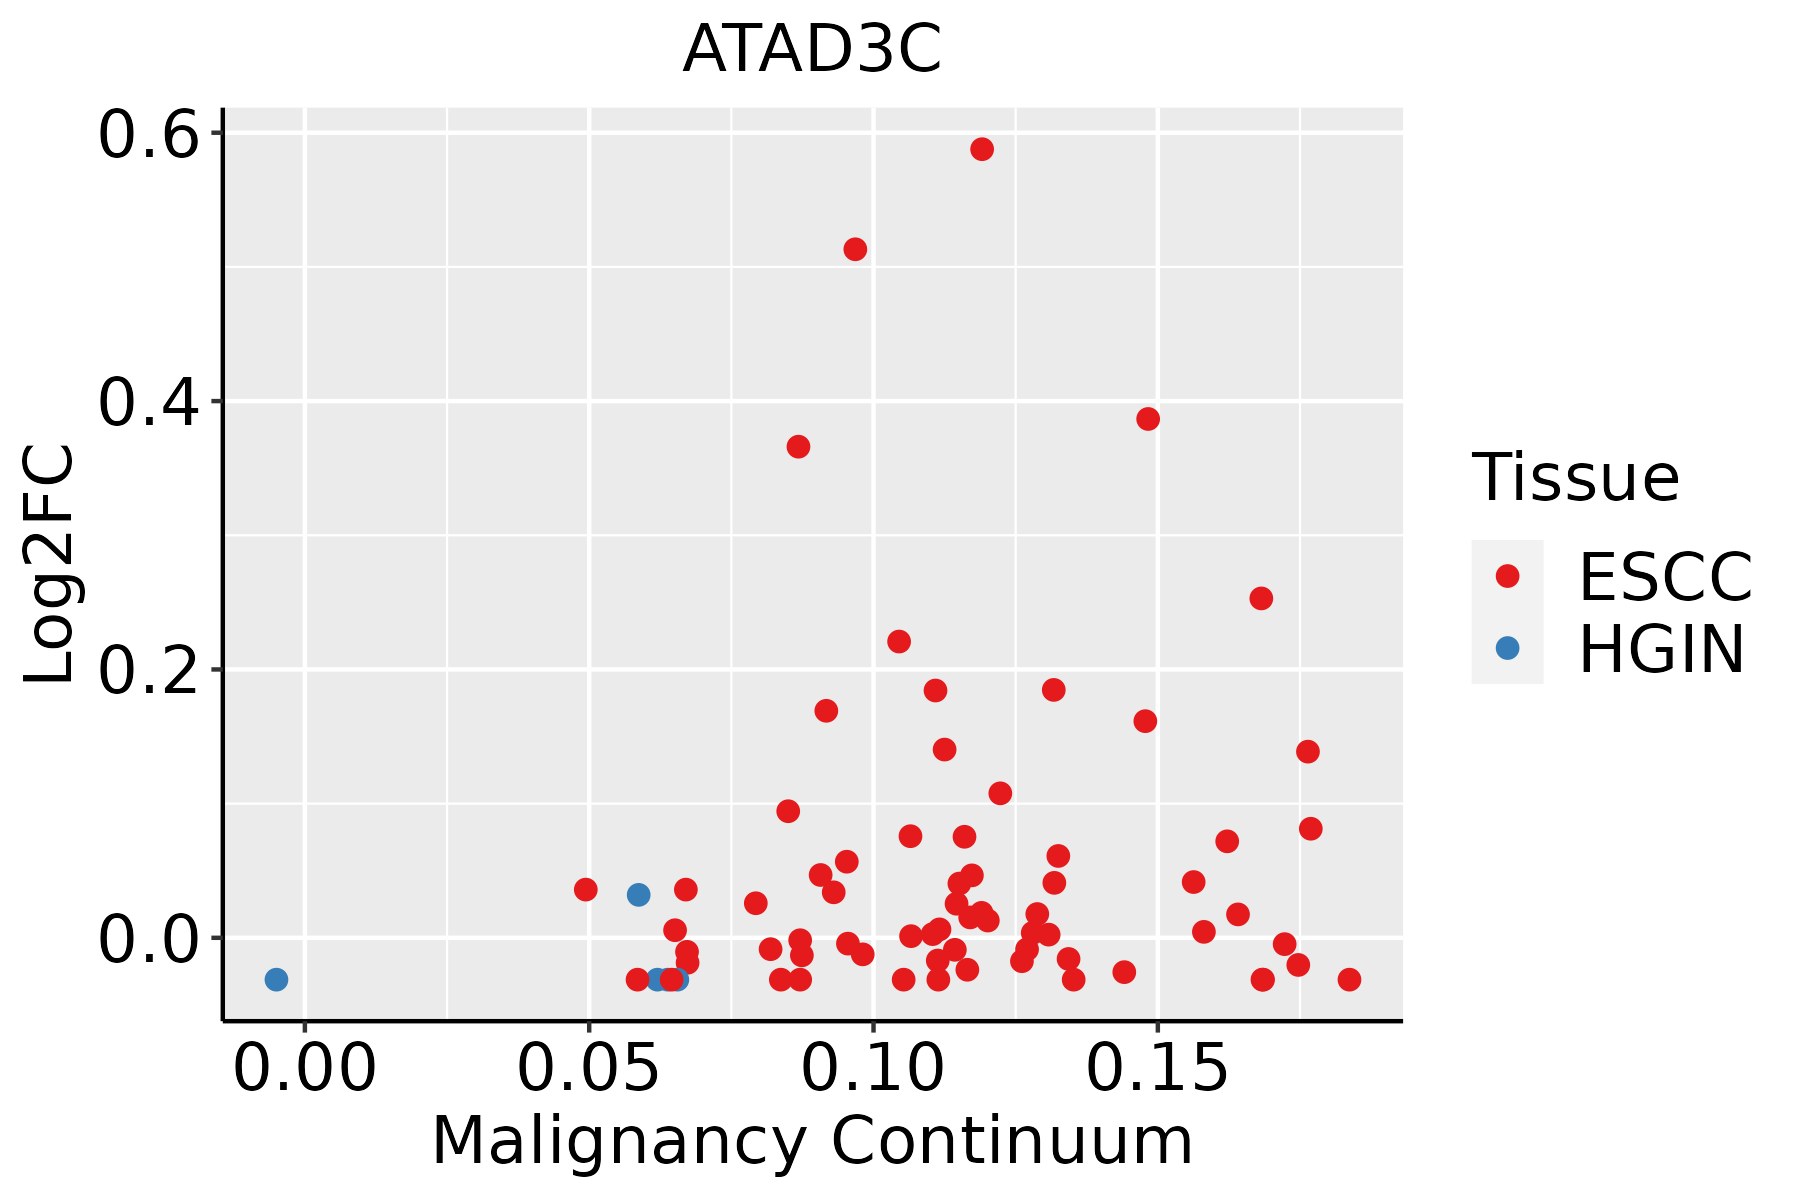 | ESCC: Esophageal squamous cell carcinoma |
| HGIN: High-grade intraepithelial neoplasias | ||
| LGIN: Low-grade intraepithelial neoplasias | ||
| Liver | 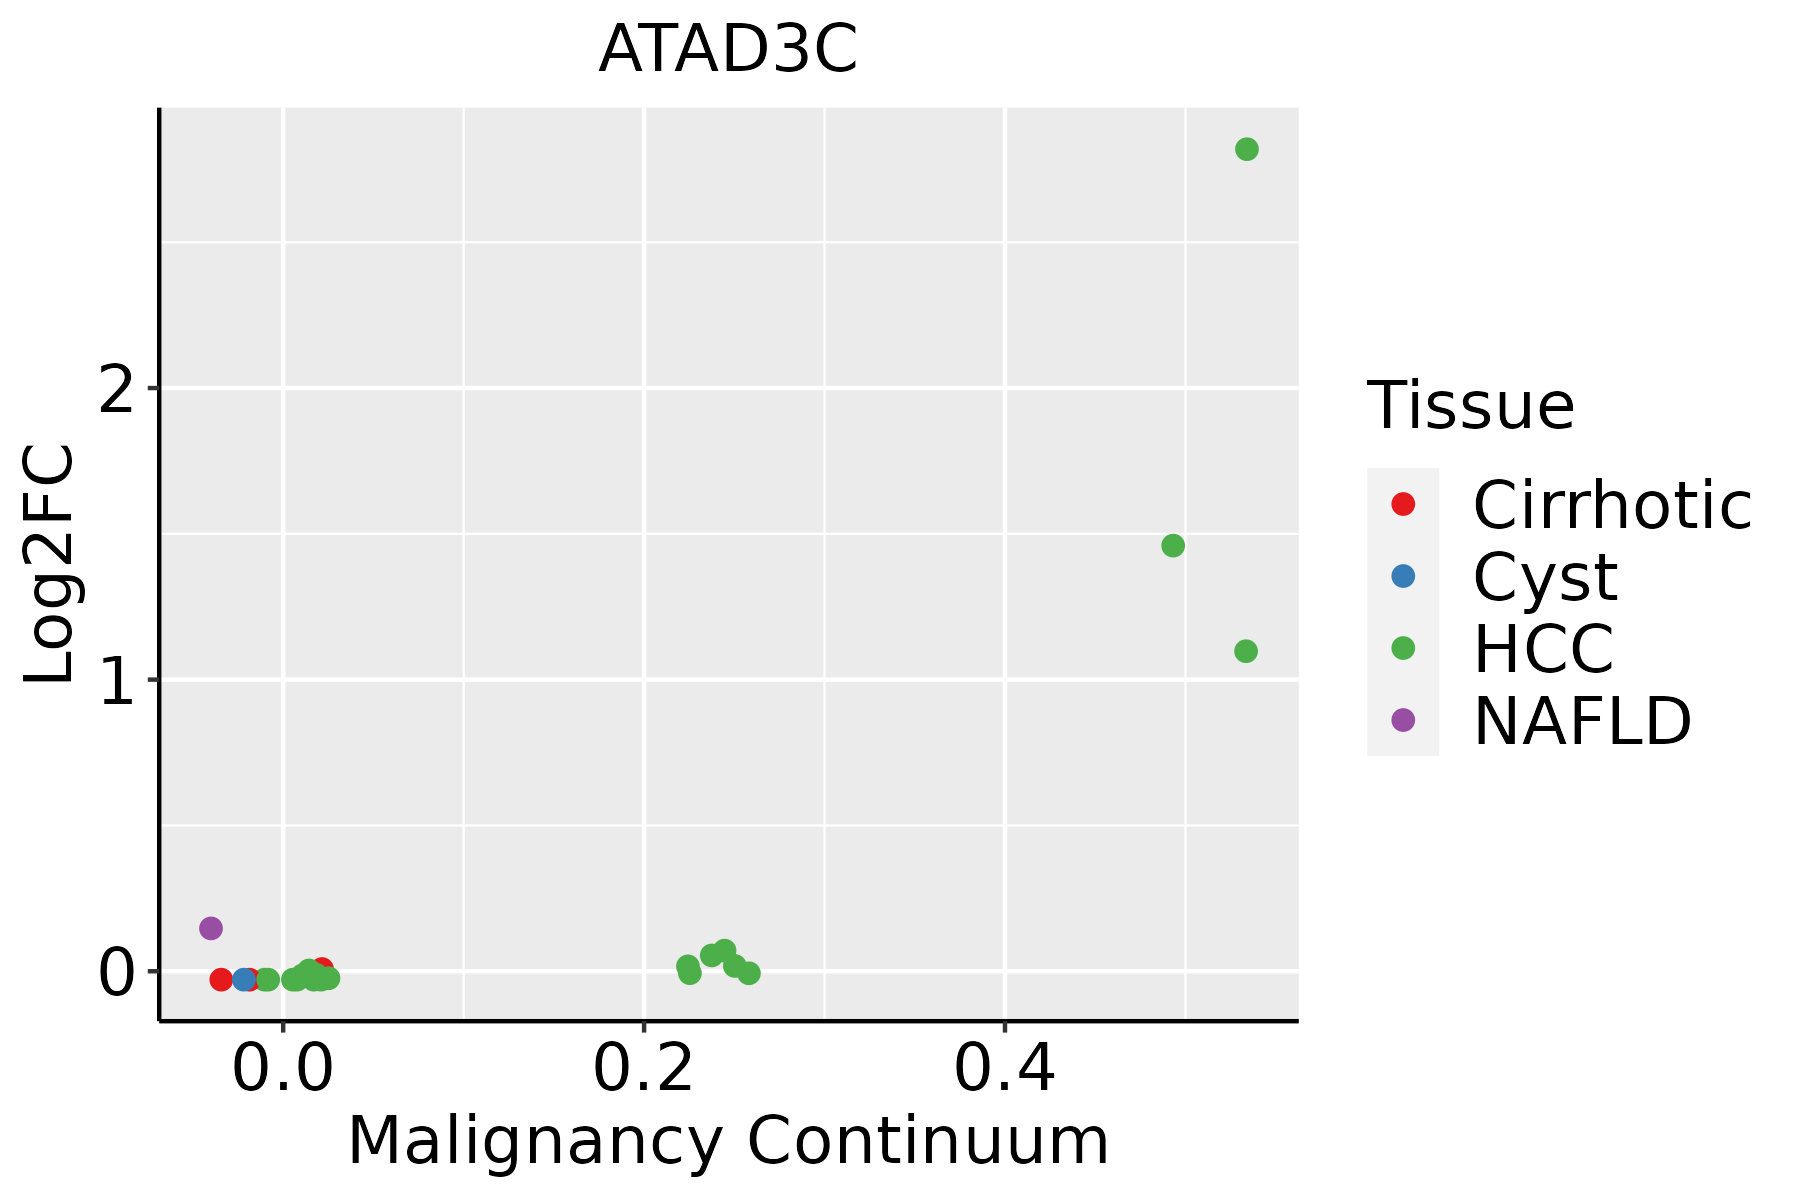 | HCC: Hepatocellular carcinoma |
| NAFLD: Non-alcoholic fatty liver disease |
| ∗log2FC in expression of this searched gene in stem-like cells from each diseased tissue sample relative to stem-like cells in normal samples in each tissue plotted against the malignancy continuum. Samples are colored based on if they are from different disease stage. |
Top |
Malignant transformation related pathway analysis |
| Find out the enriched GO biological processes and KEGG pathways involved in transition from healthy to precancer to cancer |
| Tissue | Disease Stage | Enriched GO biological Processes |
| Colorectum | AD |  |
| Colorectum | SER |  |
| Colorectum | MSS |  |
| Colorectum | MSI-H |  |
| Colorectum | FAP |  |
| ∗Top 15 enriched GO BP terms are showed in the bar plot of each disease state in each tissue. Each row represents a significant GO biological process which is colored according to the -log10(p.adjust). |
| Page: 1 2 3 4 5 6 7 8 9 |
| GO ID | Tissue | Disease Stage | Description | Gene Ratio | Bg Ratio | pvalue | p.adjust | Count |
| Page: 1 |
| Pathway ID | Tissue | Disease Stage | Description | Gene Ratio | Bg Ratio | pvalue | p.adjust | qvalue | Count |
| Page: 1 |
Top |
Cell-cell communication analysis |
| Identification of potential cell-cell interactions between two cell types and their ligand-receptor pairs for different disease states |
| Ligand | Receptor | LRpair | Pathway | Tissue | Disease Stage |
| Page: 1 |
Top |
Single-cell gene regulatory network inference analysis |
| Find out the significant the regulons (TFs) and the target genes of each regulon across cell types for different disease states |
| TF | Cell Type | Tissue | Disease Stage | Target Gene | RSS | Regulon Activity |
| ∗The dot plots of a searched regulon are shown for all cell subpopulations in each disease state of each tissue based on the regulon specific score inferred using pySCENIC and by calculating the average expression. |
| Page: 1 |
Top |
Somatic mutation of malignant transformation related genes |
| Annotation of somatic variants for genes involved in malignant transformation |
| Hugo Symbol | Variant Class | Variant Classification | dbSNP RS | HGVSc | HGVSp | HGVSp Short | SWISSPROT | BIOTYPE | SIFT | PolyPhen | Tumor Sample Barcode | Tissue | Histology | Sex | Age | Stage | Therapy Types | Drugs | Outcome |
| ATAD3C | SNV | Missense_Mutation | novel | c.254T>G | p.Val85Gly | p.V85G | Q5T2N8 | protein_coding | deleterious(0.04) | probably_damaging(0.962) | TCGA-C8-A12K-01 | Breast | breast invasive carcinoma | Female | >=65 | I/II | Unknown | Unknown | SD |
| ATAD3C | insertion | In_Frame_Ins | novel | c.180_181insCCGCGTCCAGCTCAGCAAGATTTTTTAATTTTATTTATT | p.Gly60_Phe61insProArgProAlaGlnGlnAspPheLeuIleLeuPheIle | p.G60_F61insPRPAQQDFLILFI | Q5T2N8 | protein_coding | TCGA-A2-A0D1-01 | Breast | breast invasive carcinoma | Female | >=65 | I/II | Chemotherapy | taxotere | SD | ||
| ATAD3C | SNV | Missense_Mutation | rs190504905 | c.1094C>T | p.Thr365Met | p.T365M | Q5T2N8 | protein_coding | tolerated(0.23) | benign(0.028) | TCGA-C5-A2M2-01 | Cervix | cervical & endocervical cancer | Female | <65 | I/II | Unknown | Unknown | SD |
| ATAD3C | SNV | Missense_Mutation | c.1229C>T | p.Ser410Leu | p.S410L | Q5T2N8 | protein_coding | tolerated_low_confidence(0.2) | benign(0) | TCGA-IR-A3LK-01 | Cervix | cervical & endocervical cancer | Female | >=65 | I/II | Chemotherapy | cisplatin | PD | |
| ATAD3C | SNV | Missense_Mutation | rs751125730 | c.347N>T | p.Thr116Met | p.T116M | Q5T2N8 | protein_coding | deleterious(0) | possibly_damaging(0.886) | TCGA-A6-6653-01 | Colorectum | colon adenocarcinoma | Male | >=65 | I/II | Unknown | Unknown | SD |
| ATAD3C | SNV | Missense_Mutation | rs574161074 | c.794N>T | p.Thr265Met | p.T265M | Q5T2N8 | protein_coding | tolerated(0.06) | probably_damaging(0.938) | TCGA-AA-3502-01 | Colorectum | colon adenocarcinoma | Male | >=65 | I/II | Unknown | Unknown | SD |
| ATAD3C | SNV | Missense_Mutation | c.120G>T | p.Gln40His | p.Q40H | Q5T2N8 | protein_coding | deleterious(0) | possibly_damaging(0.656) | TCGA-AA-3510-01 | Colorectum | colon adenocarcinoma | Male | >=65 | I/II | Unknown | Unknown | SD | |
| ATAD3C | SNV | Missense_Mutation | novel | c.289C>T | p.Arg97Cys | p.R97C | Q5T2N8 | protein_coding | deleterious(0) | probably_damaging(0.977) | TCGA-AA-A00N-01 | Colorectum | colon adenocarcinoma | Male | >=65 | I/II | Unknown | Unknown | PD |
| ATAD3C | SNV | Missense_Mutation | rs202189170 | c.979N>T | p.Arg327Trp | p.R327W | Q5T2N8 | protein_coding | deleterious(0.04) | possibly_damaging(0.696) | TCGA-A5-A0G1-01 | Endometrium | uterine corpus endometrioid carcinoma | Female | >=65 | I/II | Unknown | Unknown | SD |
| ATAD3C | SNV | Missense_Mutation | novel | c.122N>C | p.Lys41Thr | p.K41T | Q5T2N8 | protein_coding | deleterious(0.01) | benign(0.266) | TCGA-A5-A2K5-01 | Endometrium | uterine corpus endometrioid carcinoma | Female | >=65 | I/II | Unknown | Unknown | SD |
| Page: 1 2 3 4 |
Top |
Related drugs of malignant transformation related genes |
| Identification of chemicals and drugs interact with genes involved in malignant transfromation |
| (DGIdb 4.0) |
| Entrez ID | Symbol | Category | Interaction Types | Drug Claim Name | Drug Name | PMIDs |
| Page: 1 |

Copyright 2023-Present -The University of Texas Health Science Center at Houston |