
|
|||||
|
 | |
| |
| |
| |
| |
| |
|
Gene: ATAD3A |
Gene summary for ATAD3A |
| Gene information | Species | Human | Gene symbol | ATAD3A | Gene ID | 55210 |
| Gene name | ATPase family AAA domain containing 3A | |
| Gene Alias | HAYOS | |
| Cytomap | 1p36.33 | |
| Gene Type | protein-coding | GO ID | GO:0001558 | UniProtAcc | Q9NVI7 |
Top |
Malignant transformation analysis |
| Identification of the aberrant gene expression in precancerous and cancerous lesions by comparing the gene expression of stem-like cells in diseased tissues with normal stem cells |
| Entrez ID | Symbol | Replicates | Species | Organ | Tissue | Adj P-value | Log2FC | Malignancy |
| 55210 | ATAD3A | LZE24T | Human | Esophagus | ESCC | 2.18e-11 | 3.42e-01 | 0.0596 |
| 55210 | ATAD3A | P1T-E | Human | Esophagus | ESCC | 8.43e-03 | 2.16e-01 | 0.0875 |
| 55210 | ATAD3A | P2T-E | Human | Esophagus | ESCC | 8.14e-25 | 4.18e-01 | 0.1177 |
| 55210 | ATAD3A | P4T-E | Human | Esophagus | ESCC | 1.58e-24 | 6.09e-01 | 0.1323 |
| 55210 | ATAD3A | P5T-E | Human | Esophagus | ESCC | 2.42e-14 | 3.06e-01 | 0.1327 |
| 55210 | ATAD3A | P8T-E | Human | Esophagus | ESCC | 6.37e-20 | 3.98e-01 | 0.0889 |
| 55210 | ATAD3A | P9T-E | Human | Esophagus | ESCC | 1.30e-06 | 1.70e-01 | 0.1131 |
| 55210 | ATAD3A | P10T-E | Human | Esophagus | ESCC | 4.81e-13 | 2.57e-01 | 0.116 |
| 55210 | ATAD3A | P11T-E | Human | Esophagus | ESCC | 1.46e-09 | 4.03e-01 | 0.1426 |
| 55210 | ATAD3A | P12T-E | Human | Esophagus | ESCC | 2.98e-08 | 1.77e-01 | 0.1122 |
| 55210 | ATAD3A | P15T-E | Human | Esophagus | ESCC | 1.51e-06 | 1.67e-01 | 0.1149 |
| 55210 | ATAD3A | P16T-E | Human | Esophagus | ESCC | 1.27e-16 | 2.18e-01 | 0.1153 |
| 55210 | ATAD3A | P17T-E | Human | Esophagus | ESCC | 2.39e-08 | 5.23e-01 | 0.1278 |
| 55210 | ATAD3A | P19T-E | Human | Esophagus | ESCC | 1.84e-08 | 7.20e-01 | 0.1662 |
| 55210 | ATAD3A | P20T-E | Human | Esophagus | ESCC | 5.33e-07 | 2.01e-01 | 0.1124 |
| 55210 | ATAD3A | P21T-E | Human | Esophagus | ESCC | 1.57e-20 | 4.33e-01 | 0.1617 |
| 55210 | ATAD3A | P22T-E | Human | Esophagus | ESCC | 1.41e-07 | 9.01e-02 | 0.1236 |
| 55210 | ATAD3A | P23T-E | Human | Esophagus | ESCC | 5.87e-14 | 3.50e-01 | 0.108 |
| 55210 | ATAD3A | P24T-E | Human | Esophagus | ESCC | 5.16e-23 | 4.54e-01 | 0.1287 |
| 55210 | ATAD3A | P26T-E | Human | Esophagus | ESCC | 2.89e-14 | 1.38e-01 | 0.1276 |
| Page: 1 2 3 4 5 |
| Tissue | Expression Dynamics | Abbreviation |
| Esophagus |  | ESCC: Esophageal squamous cell carcinoma |
| HGIN: High-grade intraepithelial neoplasias | ||
| LGIN: Low-grade intraepithelial neoplasias | ||
| Liver | 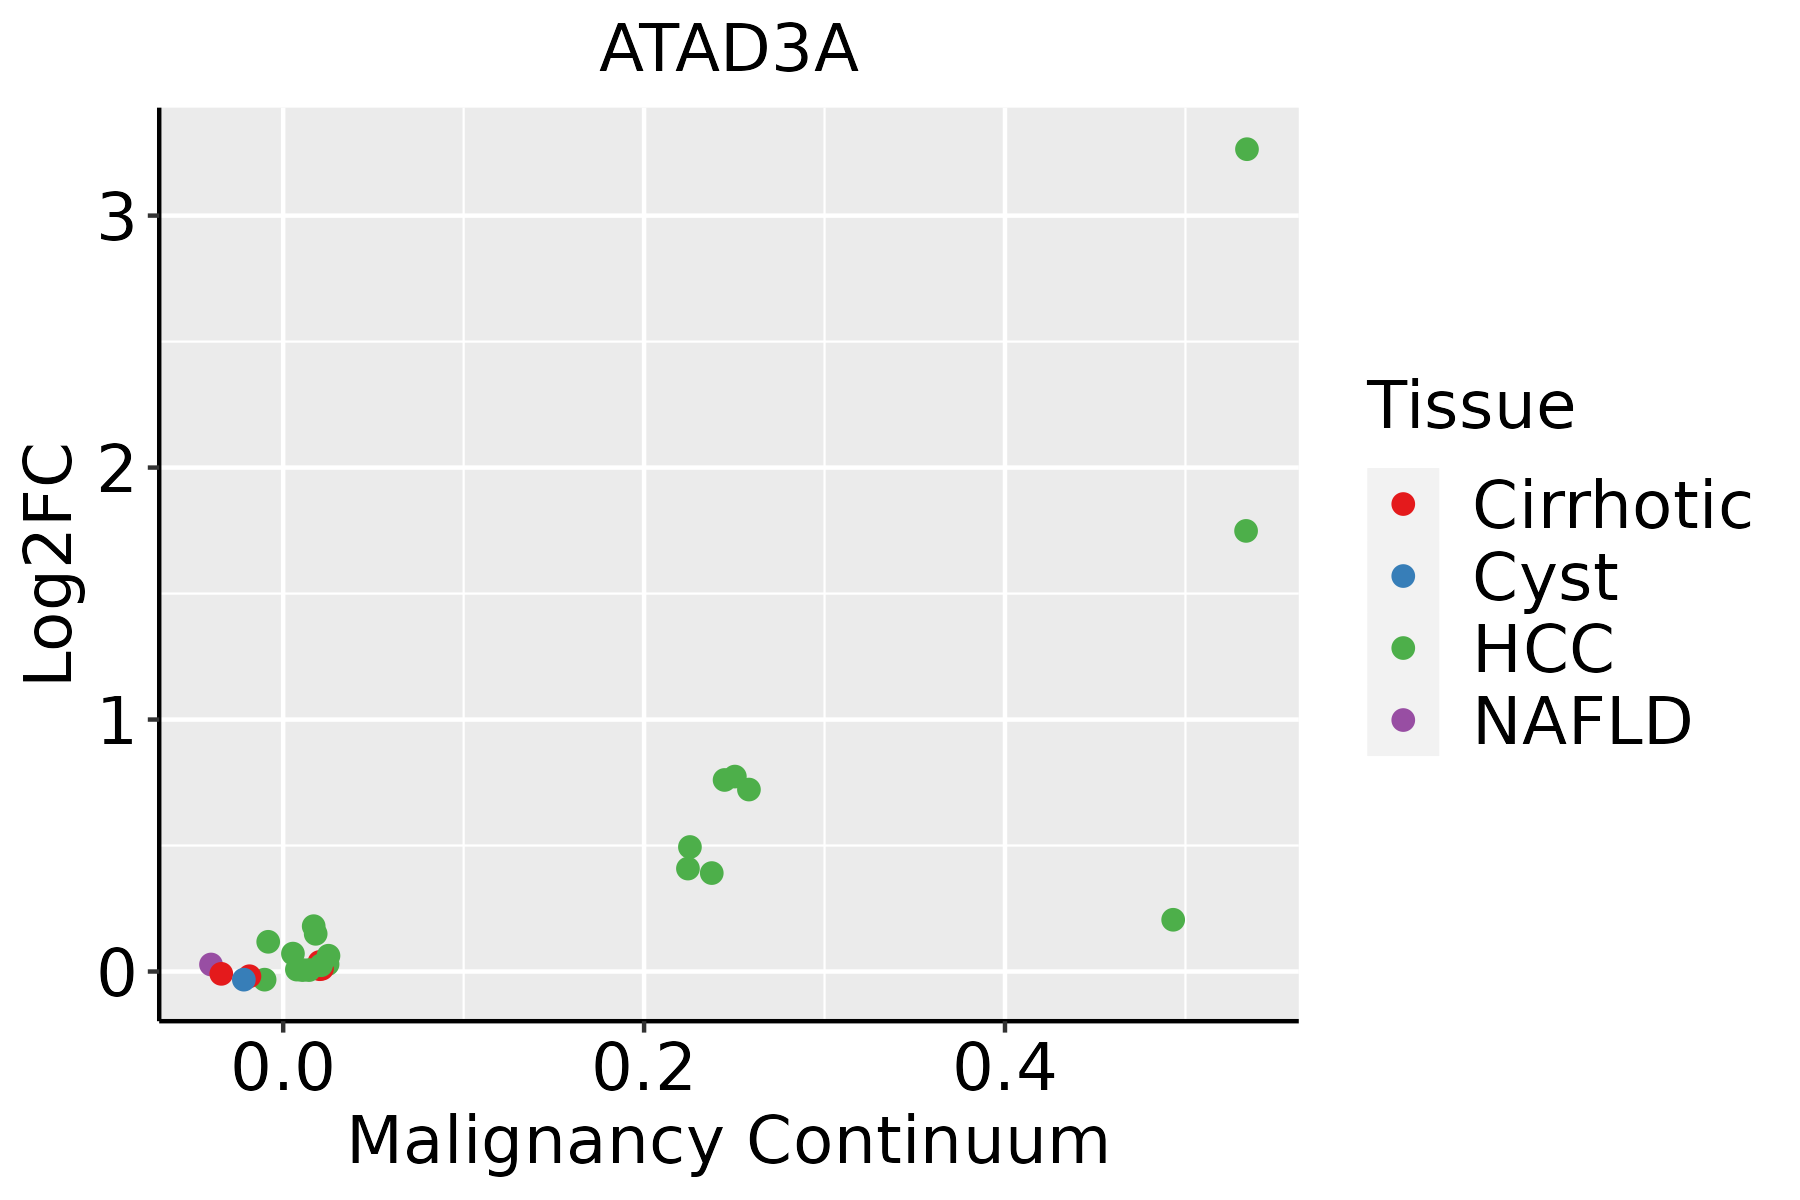 | HCC: Hepatocellular carcinoma |
| NAFLD: Non-alcoholic fatty liver disease | ||
| Oral Cavity |  | EOLP: Erosive Oral lichen planus |
| LP: leukoplakia | ||
| NEOLP: Non-erosive oral lichen planus | ||
| OSCC: Oral squamous cell carcinoma | ||
| Skin | 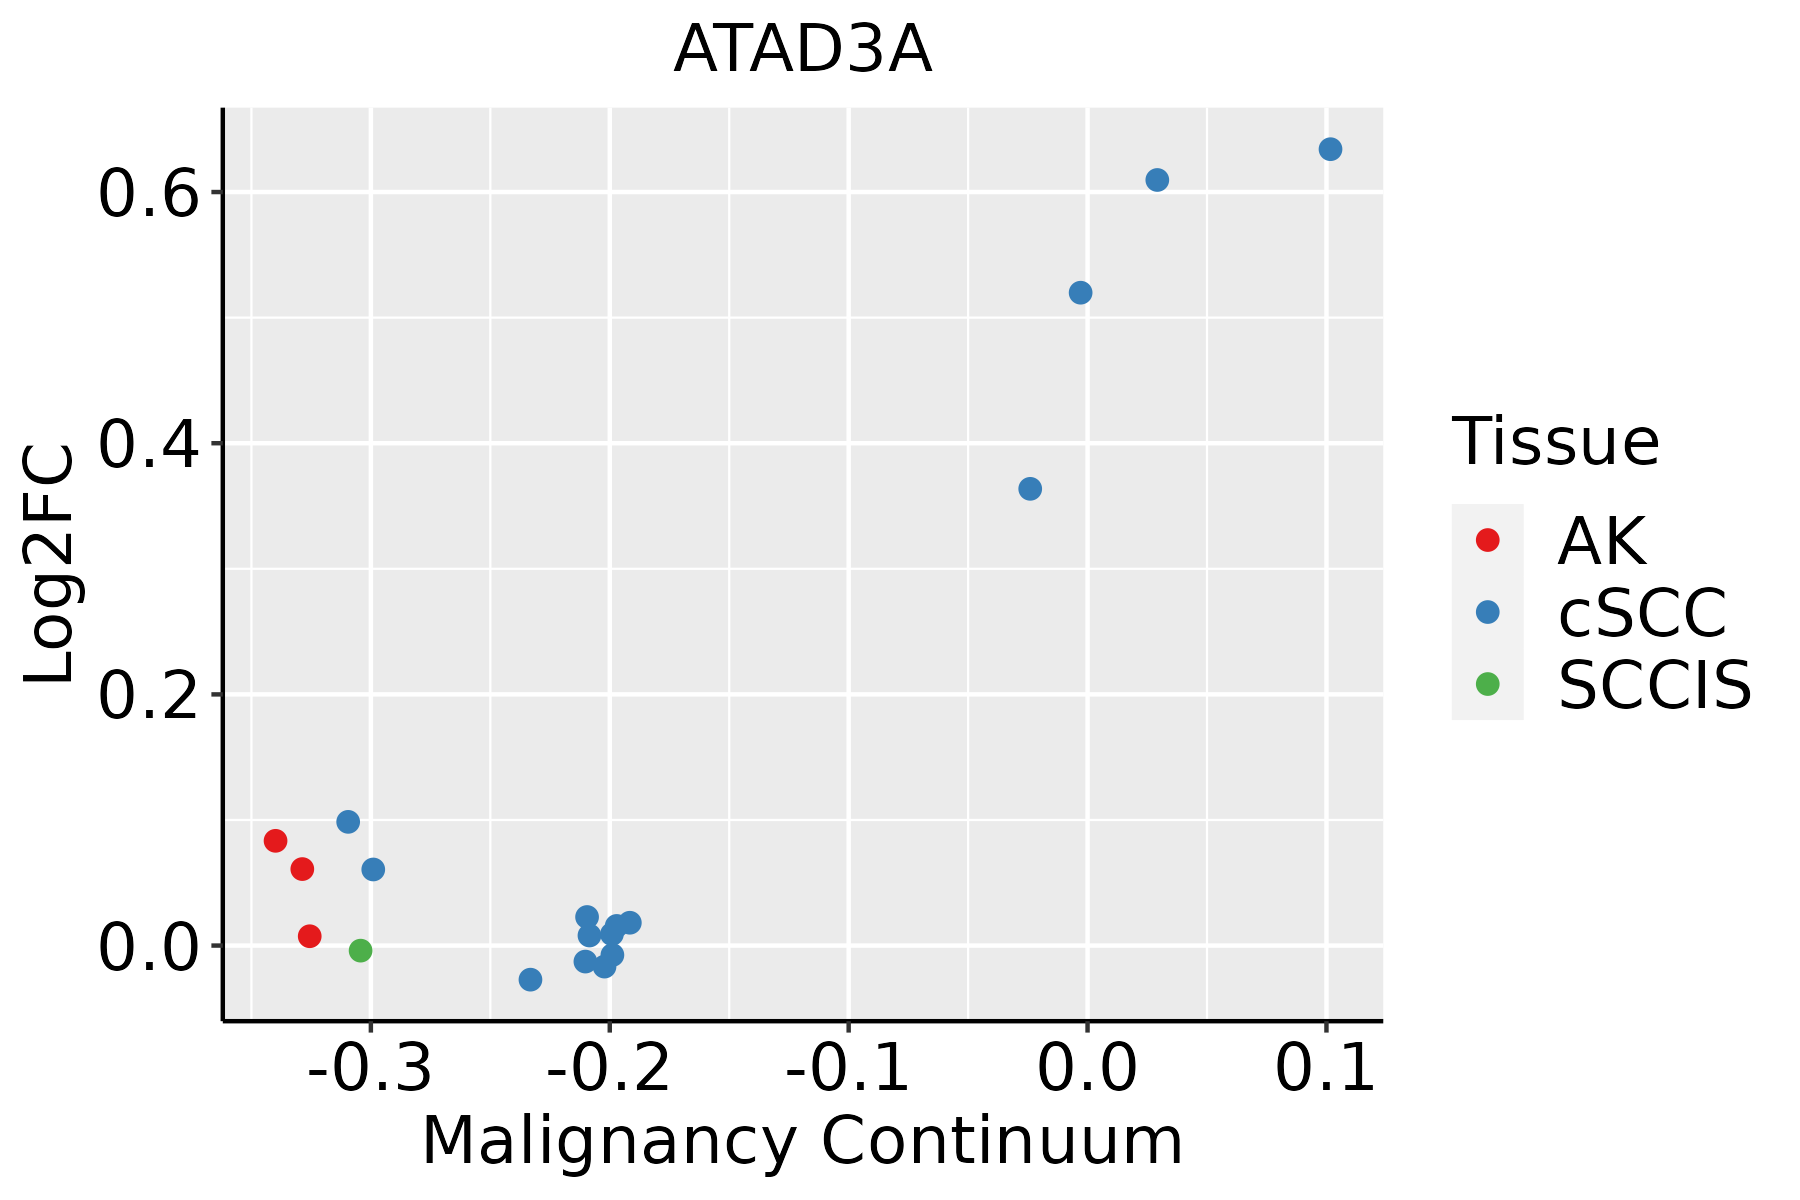 | AK: Actinic keratosis |
| cSCC: Cutaneous squamous cell carcinoma | ||
| SCCIS:squamous cell carcinoma in situ | ||
| Thyroid | 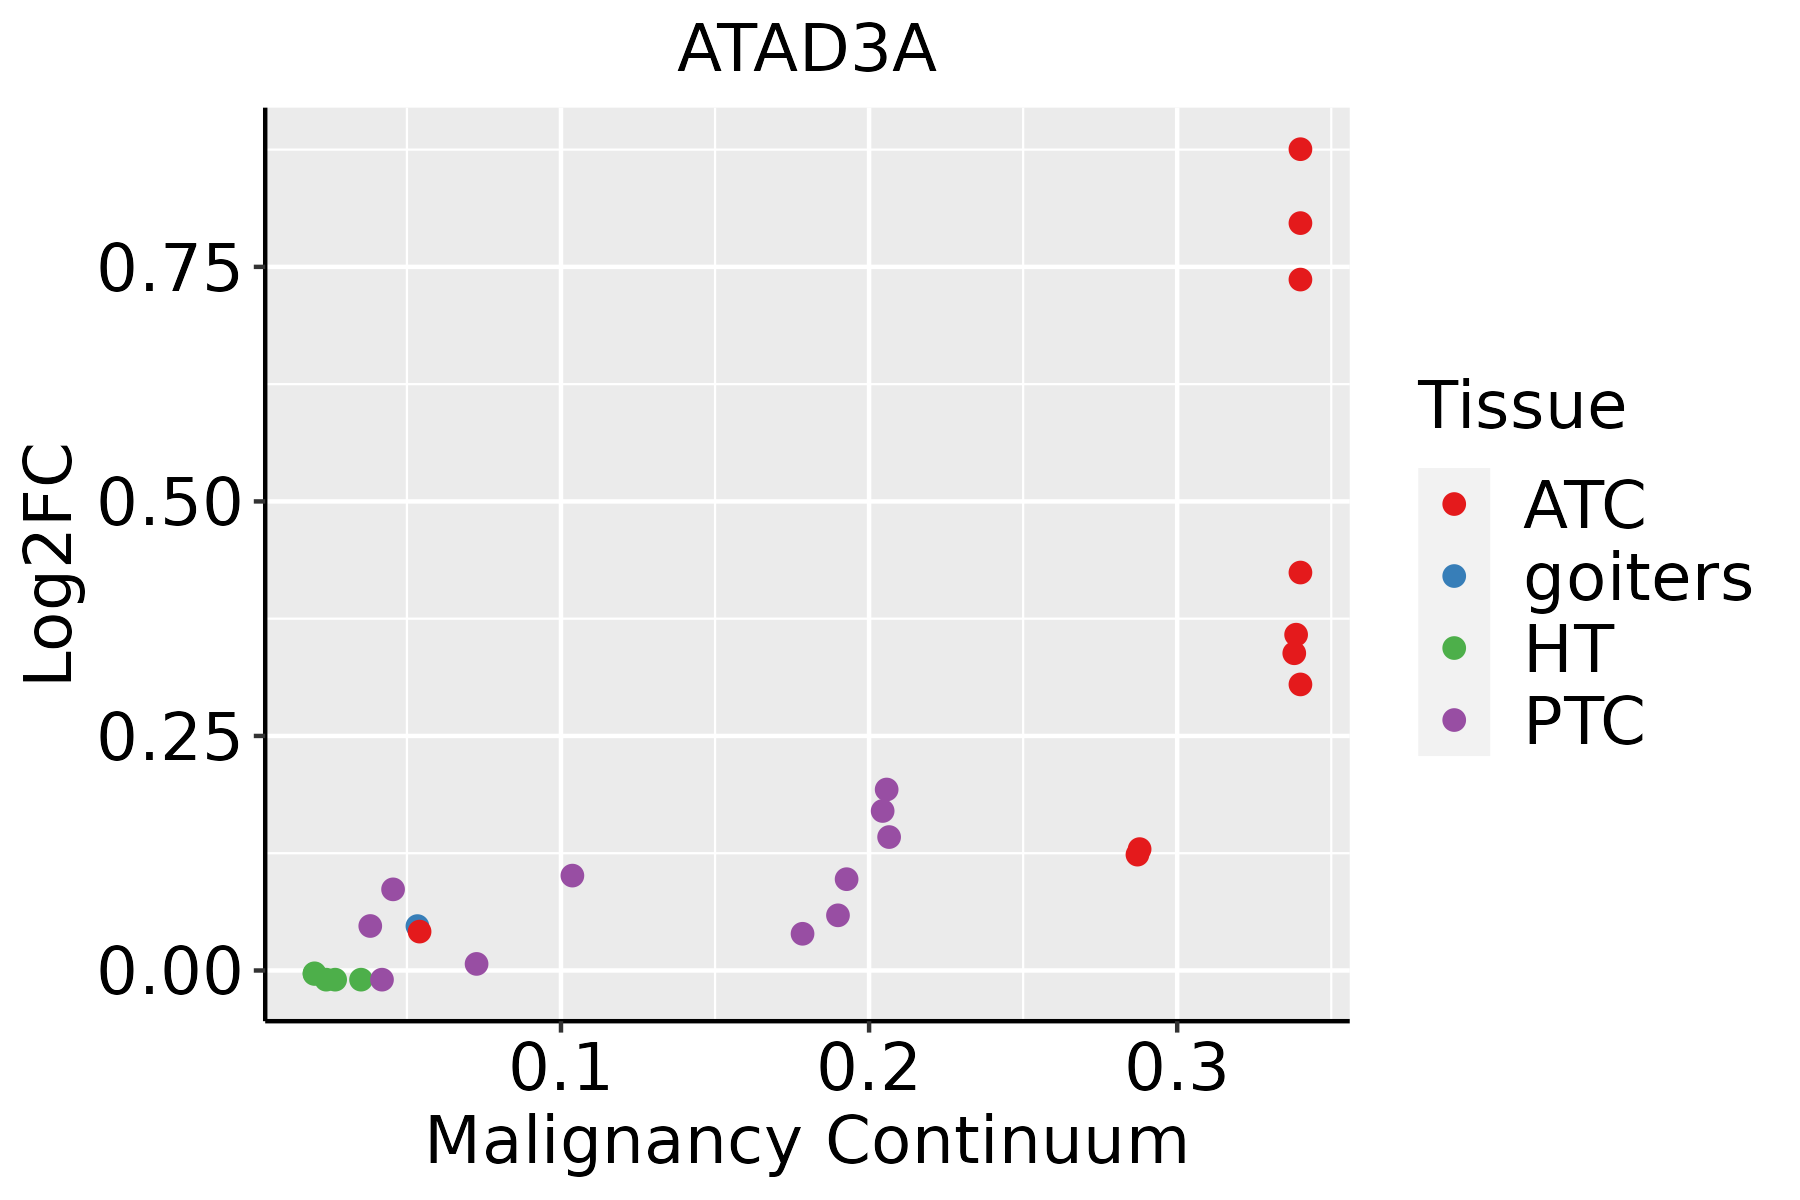 | ATC: Anaplastic thyroid cancer |
| HT: Hashimoto's thyroiditis | ||
| PTC: Papillary thyroid cancer |
| ∗log2FC in expression of this searched gene in stem-like cells from each diseased tissue sample relative to stem-like cells in normal samples in each tissue plotted against the malignancy continuum. Samples are colored based on if they are from different disease stage. |
Top |
Malignant transformation related pathway analysis |
| Find out the enriched GO biological processes and KEGG pathways involved in transition from healthy to precancer to cancer |
| Tissue | Disease Stage | Enriched GO biological Processes |
| Colorectum | AD |  |
| Colorectum | SER |  |
| Colorectum | MSS |  |
| Colorectum | MSI-H |  |
| Colorectum | FAP |  |
| ∗Top 15 enriched GO BP terms are showed in the bar plot of each disease state in each tissue. Each row represents a significant GO biological process which is colored according to the -log10(p.adjust). |
| Page: 1 2 3 4 5 6 7 8 9 |
| GO ID | Tissue | Disease Stage | Description | Gene Ratio | Bg Ratio | pvalue | p.adjust | Count |
| GO:000961518 | Esophagus | ESCC | response to virus | 238/8552 | 367/18723 | 6.65e-14 | 3.32e-12 | 238 |
| GO:0016049110 | Esophagus | ESCC | cell growth | 289/8552 | 482/18723 | 1.29e-10 | 3.77e-09 | 289 |
| GO:00516075 | Esophagus | ESCC | defense response to virus | 171/8552 | 265/18723 | 3.91e-10 | 1.05e-08 | 171 |
| GO:01405465 | Esophagus | ESCC | defense response to symbiont | 171/8552 | 265/18723 | 3.91e-10 | 1.05e-08 | 171 |
| GO:000155819 | Esophagus | ESCC | regulation of cell growth | 248/8552 | 414/18723 | 2.97e-09 | 6.45e-08 | 248 |
| GO:01403742 | Esophagus | ESCC | antiviral innate immune response | 13/8552 | 15/18723 | 1.31e-03 | 6.26e-03 | 13 |
| GO:001604921 | Liver | HCC | cell growth | 269/7958 | 482/18723 | 1.84e-09 | 5.35e-08 | 269 |
| GO:000961511 | Liver | HCC | response to virus | 210/7958 | 367/18723 | 7.32e-09 | 1.86e-07 | 210 |
| GO:000155821 | Liver | HCC | regulation of cell growth | 228/7958 | 414/18723 | 1.34e-07 | 2.55e-06 | 228 |
| GO:00516071 | Liver | HCC | defense response to virus | 151/7958 | 265/18723 | 1.27e-06 | 1.85e-05 | 151 |
| GO:01405461 | Liver | HCC | defense response to symbiont | 151/7958 | 265/18723 | 1.27e-06 | 1.85e-05 | 151 |
| GO:000961515 | Oral cavity | OSCC | response to virus | 215/7305 | 367/18723 | 1.63e-14 | 9.41e-13 | 215 |
| GO:001604917 | Oral cavity | OSCC | cell growth | 268/7305 | 482/18723 | 6.55e-14 | 3.51e-12 | 268 |
| GO:000155816 | Oral cavity | OSCC | regulation of cell growth | 228/7305 | 414/18723 | 1.74e-11 | 6.09e-10 | 228 |
| GO:00516074 | Oral cavity | OSCC | defense response to virus | 154/7305 | 265/18723 | 1.96e-10 | 5.63e-09 | 154 |
| GO:01405464 | Oral cavity | OSCC | defense response to symbiont | 154/7305 | 265/18723 | 1.96e-10 | 5.63e-09 | 154 |
| GO:0140374 | Oral cavity | OSCC | antiviral innate immune response | 13/7305 | 15/18723 | 2.07e-04 | 1.36e-03 | 13 |
| GO:000961516 | Oral cavity | LP | response to virus | 143/4623 | 367/18723 | 7.42e-10 | 3.52e-08 | 143 |
| GO:005160711 | Oral cavity | LP | defense response to virus | 97/4623 | 265/18723 | 9.31e-06 | 1.74e-04 | 97 |
| GO:014054611 | Oral cavity | LP | defense response to symbiont | 97/4623 | 265/18723 | 9.31e-06 | 1.74e-04 | 97 |
| Page: 1 2 |
| Pathway ID | Tissue | Disease Stage | Description | Gene Ratio | Bg Ratio | pvalue | p.adjust | qvalue | Count |
| Page: 1 |
Top |
Cell-cell communication analysis |
| Identification of potential cell-cell interactions between two cell types and their ligand-receptor pairs for different disease states |
| Ligand | Receptor | LRpair | Pathway | Tissue | Disease Stage |
| Page: 1 |
Top |
Single-cell gene regulatory network inference analysis |
| Find out the significant the regulons (TFs) and the target genes of each regulon across cell types for different disease states |
| TF | Cell Type | Tissue | Disease Stage | Target Gene | RSS | Regulon Activity |
| ∗The dot plots of a searched regulon are shown for all cell subpopulations in each disease state of each tissue based on the regulon specific score inferred using pySCENIC and by calculating the average expression. |
| Page: 1 |
Top |
Somatic mutation of malignant transformation related genes |
| Annotation of somatic variants for genes involved in malignant transformation |
| Hugo Symbol | Variant Class | Variant Classification | dbSNP RS | HGVSc | HGVSp | HGVSp Short | SWISSPROT | BIOTYPE | SIFT | PolyPhen | Tumor Sample Barcode | Tissue | Histology | Sex | Age | Stage | Therapy Types | Drugs | Outcome |
| ATAD3A | SNV | Missense_Mutation | c.1820N>G | p.Gln607Arg | p.Q607R | Q9NVI7 | protein_coding | tolerated(0.46) | benign(0) | TCGA-AO-A128-01 | Breast | breast invasive carcinoma | Female | <65 | I/II | Chemotherapy | doxorubicin | SD | |
| ATAD3A | SNV | Missense_Mutation | rs758391776 | c.653G>A | p.Arg218Gln | p.R218Q | Q9NVI7 | protein_coding | deleterious(0) | probably_damaging(0.978) | TCGA-GI-A2C9-01 | Breast | breast invasive carcinoma | Female | <65 | I/II | Unspecific | SD | |
| ATAD3A | insertion | Frame_Shift_Ins | novel | c.411_412insCTTGTGCCAC | p.Cys138LeufsTer11 | p.C138Lfs*11 | Q9NVI7 | protein_coding | TCGA-AO-A0J9-01 | Breast | breast invasive carcinoma | Female | <65 | III/IV | Chemotherapy | cyclophosphamide | PD | ||
| ATAD3A | SNV | Missense_Mutation | rs763043823 | c.1447G>A | p.Ala483Thr | p.A483T | Q9NVI7 | protein_coding | tolerated(0.06) | possibly_damaging(0.863) | TCGA-2W-A8YY-01 | Cervix | cervical & endocervical cancer | Female | <65 | I/II | Chemotherapy | cisplatin | CR |
| ATAD3A | SNV | Missense_Mutation | c.622N>A | p.Glu208Lys | p.E208K | Q9NVI7 | protein_coding | deleterious(0) | probably_damaging(0.952) | TCGA-EK-A3GM-01 | Cervix | cervical & endocervical cancer | Female | >=65 | I/II | Unknown | Unknown | SD | |
| ATAD3A | SNV | Missense_Mutation | novel | c.1406N>T | p.Ala469Val | p.A469V | Q9NVI7 | protein_coding | deleterious(0.02) | benign(0.201) | TCGA-VS-A959-01 | Cervix | cervical & endocervical cancer | Female | >=65 | I/II | Unknown | Unknown | SD |
| ATAD3A | SNV | Missense_Mutation | c.1634C>G | p.Ala545Gly | p.A545G | Q9NVI7 | protein_coding | deleterious(0.02) | benign(0.029) | TCGA-A6-5661-01 | Colorectum | colon adenocarcinoma | Female | >=65 | I/II | Unknown | Unknown | SD | |
| ATAD3A | SNV | Missense_Mutation | rs540171241 | c.989N>T | p.Pro330Leu | p.P330L | Q9NVI7 | protein_coding | deleterious(0) | probably_damaging(0.999) | TCGA-AA-A01P-01 | Colorectum | colon adenocarcinoma | Female | >=65 | III/IV | Unknown | Unknown | PD |
| ATAD3A | SNV | Missense_Mutation | c.1285N>A | p.Val429Met | p.V429M | Q9NVI7 | protein_coding | deleterious(0.03) | probably_damaging(0.937) | TCGA-AA-A03F-01 | Colorectum | colon adenocarcinoma | Female | >=65 | III/IV | Unknown | Unknown | PD | |
| ATAD3A | SNV | Missense_Mutation | rs779111850 | c.1084N>A | p.Ala362Thr | p.A362T | Q9NVI7 | protein_coding | deleterious(0.02) | possibly_damaging(0.509) | TCGA-AZ-6598-01 | Colorectum | colon adenocarcinoma | Female | >=65 | I/II | Unknown | Unknown | SD |
| Page: 1 2 3 4 5 6 |
Top |
Related drugs of malignant transformation related genes |
| Identification of chemicals and drugs interact with genes involved in malignant transfromation |
| (DGIdb 4.0) |
| Entrez ID | Symbol | Category | Interaction Types | Drug Claim Name | Drug Name | PMIDs |
| Page: 1 |

Copyright 2023-Present -The University of Texas Health Science Center at Houston |