
|
|||||
|
 | |
| |
| |
| |
| |
| |
|
Gene: ATAD2 |
Gene summary for ATAD2 |
| Gene information | Species | Human | Gene symbol | ATAD2 | Gene ID | 29028 |
| Gene name | ATPase family AAA domain containing 2 | |
| Gene Alias | ANCCA | |
| Cytomap | 8q24.13 | |
| Gene Type | protein-coding | GO ID | GO:0006139 | UniProtAcc | A0A024R9G7 |
Top |
Malignant transformation analysis |
| Identification of the aberrant gene expression in precancerous and cancerous lesions by comparing the gene expression of stem-like cells in diseased tissues with normal stem cells |
| Entrez ID | Symbol | Replicates | Species | Organ | Tissue | Adj P-value | Log2FC | Malignancy |
| 29028 | ATAD2 | GSM4909281 | Human | Breast | IDC | 1.71e-13 | 4.07e-01 | 0.21 |
| 29028 | ATAD2 | GSM4909282 | Human | Breast | IDC | 3.81e-18 | 5.38e-01 | -0.0288 |
| 29028 | ATAD2 | GSM4909285 | Human | Breast | IDC | 1.50e-03 | 1.85e-01 | 0.21 |
| 29028 | ATAD2 | GSM4909287 | Human | Breast | IDC | 9.94e-06 | 2.89e-01 | 0.2057 |
| 29028 | ATAD2 | GSM4909291 | Human | Breast | IDC | 1.08e-07 | 4.38e-01 | 0.1753 |
| 29028 | ATAD2 | GSM4909293 | Human | Breast | IDC | 2.21e-02 | 1.27e-01 | 0.1581 |
| 29028 | ATAD2 | GSM4909302 | Human | Breast | IDC | 1.25e-06 | 3.30e-01 | 0.1545 |
| 29028 | ATAD2 | GSM4909303 | Human | Breast | IDC | 2.01e-02 | 2.45e-01 | 0.0438 |
| 29028 | ATAD2 | GSM4909304 | Human | Breast | IDC | 4.45e-42 | 7.51e-01 | 0.1636 |
| 29028 | ATAD2 | GSM4909319 | Human | Breast | IDC | 1.22e-03 | 1.35e-01 | 0.1563 |
| 29028 | ATAD2 | M5 | Human | Breast | IDC | 8.39e-03 | 4.77e-01 | 0.1598 |
| 29028 | ATAD2 | DCIS2 | Human | Breast | DCIS | 4.76e-14 | 3.18e-02 | 0.0085 |
| 29028 | ATAD2 | CA_HPV_2 | Human | Cervix | CC | 3.95e-02 | 2.18e-01 | 0.0391 |
| 29028 | ATAD2 | CCI_1 | Human | Cervix | CC | 1.09e-06 | 7.75e-01 | 0.528 |
| 29028 | ATAD2 | CCI_2 | Human | Cervix | CC | 4.86e-09 | 1.50e+00 | 0.5249 |
| 29028 | ATAD2 | CCI_3 | Human | Cervix | CC | 5.61e-08 | 8.36e-01 | 0.516 |
| 29028 | ATAD2 | H2 | Human | Cervix | HSIL_HPV | 4.53e-06 | 3.10e-01 | 0.0632 |
| 29028 | ATAD2 | LZE2T | Human | Esophagus | ESCC | 2.21e-05 | 6.26e-01 | 0.082 |
| 29028 | ATAD2 | LZE4T | Human | Esophagus | ESCC | 3.68e-06 | 3.63e-01 | 0.0811 |
| 29028 | ATAD2 | LZE24T | Human | Esophagus | ESCC | 1.24e-06 | 2.72e-01 | 0.0596 |
| Page: 1 2 3 4 5 6 |
| Tissue | Expression Dynamics | Abbreviation |
| Breast |  | IDC: Invasive ductal carcinoma |
| DCIS: Ductal carcinoma in situ | ||
| Precancer(BRCA1-mut): Precancerous lesion from BRCA1 mutation carriers | ||
| Cervix | 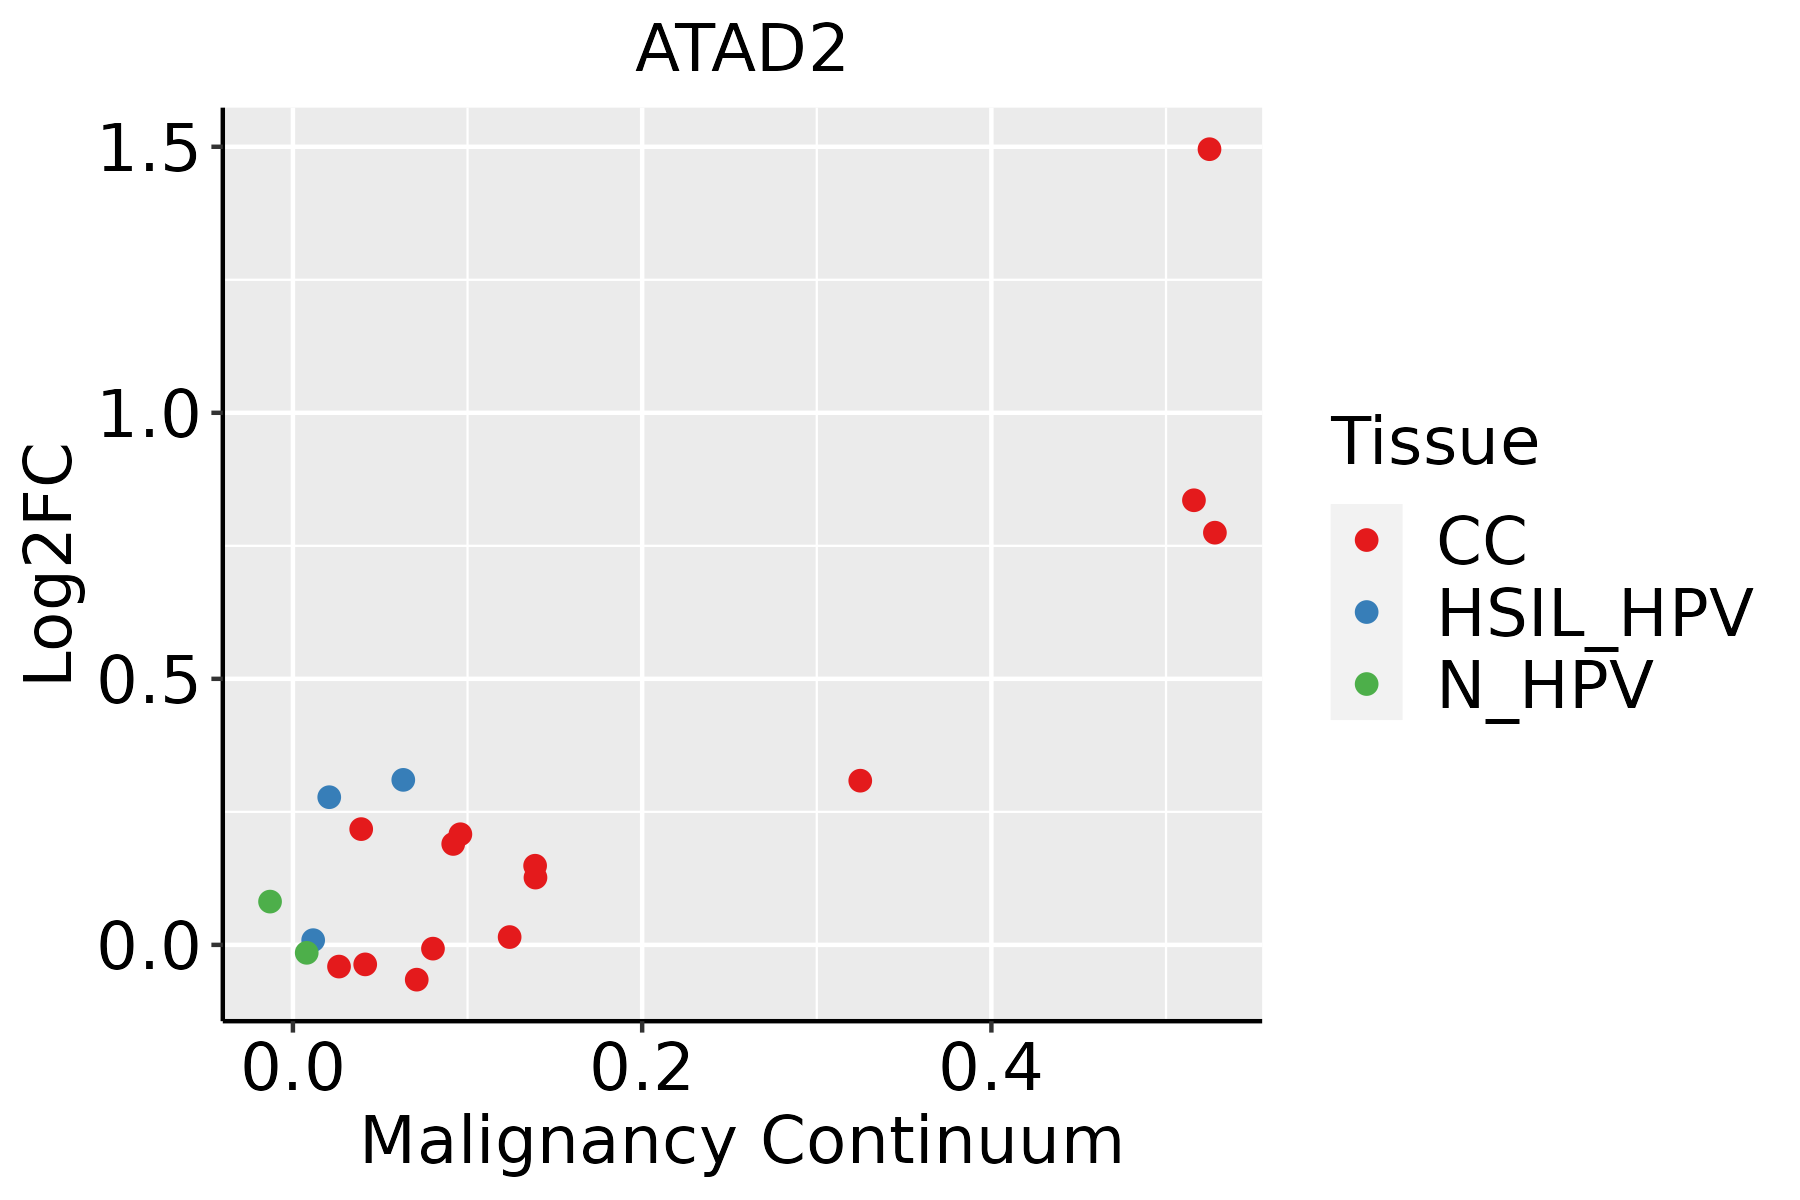 | CC: Cervix cancer |
| HSIL_HPV: HPV-infected high-grade squamous intraepithelial lesions | ||
| N_HPV: HPV-infected normal cervix | ||
| Esophagus |  | ESCC: Esophageal squamous cell carcinoma |
| HGIN: High-grade intraepithelial neoplasias | ||
| LGIN: Low-grade intraepithelial neoplasias | ||
| Liver | 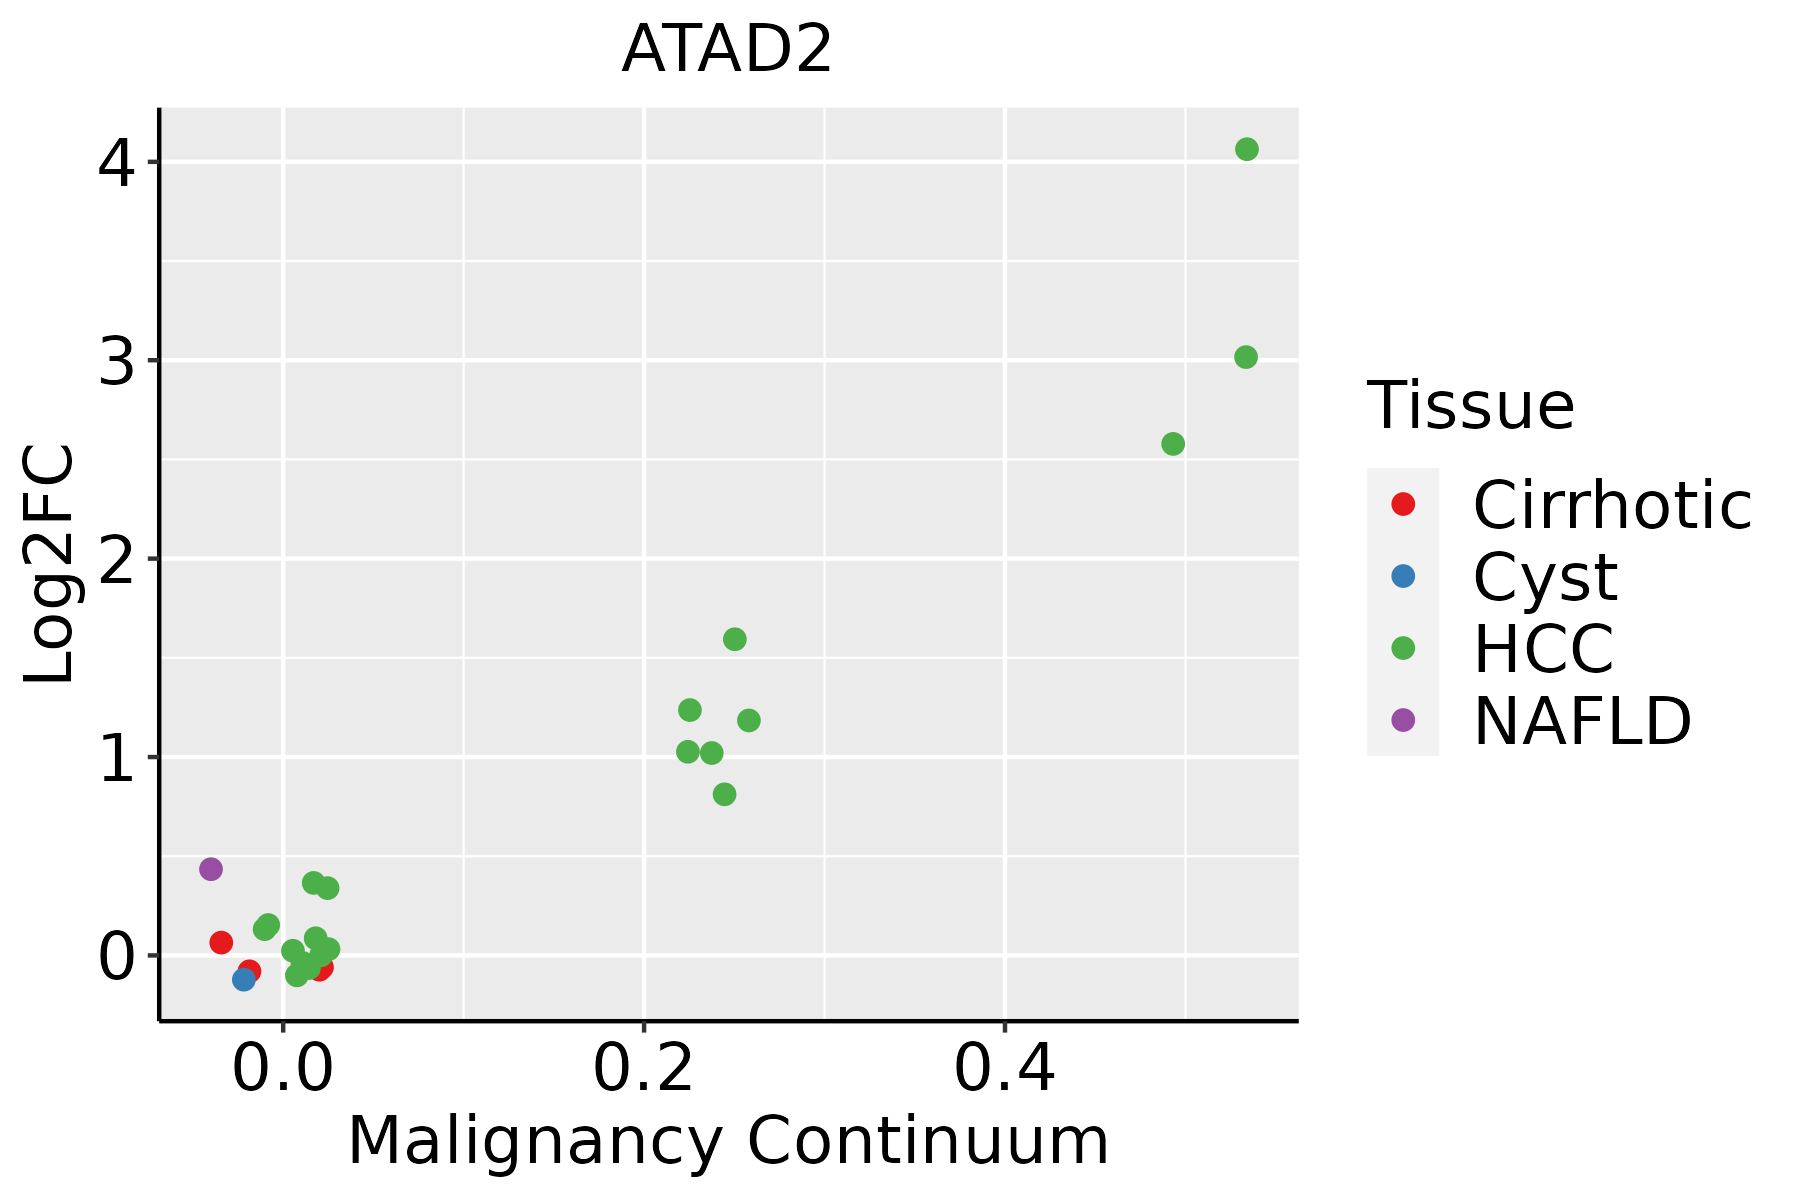 | HCC: Hepatocellular carcinoma |
| NAFLD: Non-alcoholic fatty liver disease | ||
| Oral Cavity |  | EOLP: Erosive Oral lichen planus |
| LP: leukoplakia | ||
| NEOLP: Non-erosive oral lichen planus | ||
| OSCC: Oral squamous cell carcinoma | ||
| Skin | 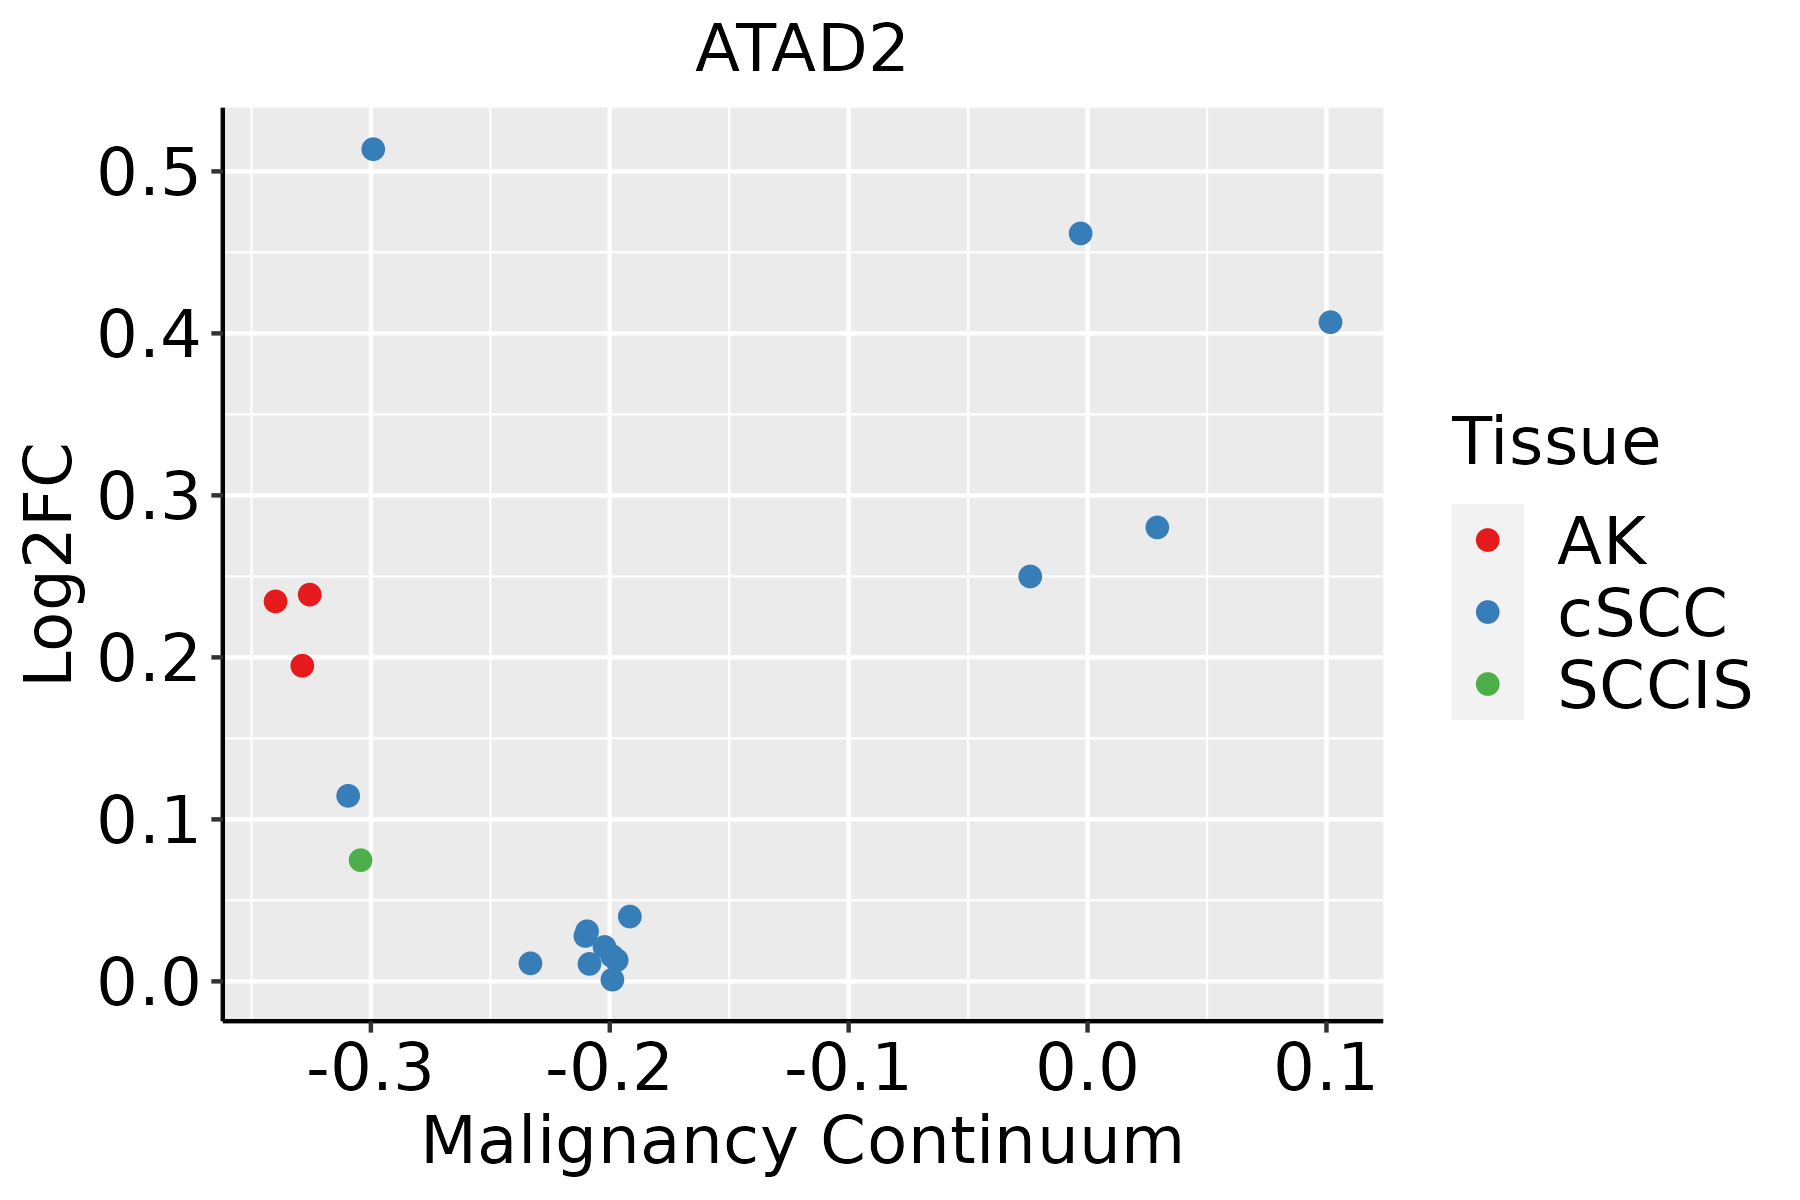 | AK: Actinic keratosis |
| cSCC: Cutaneous squamous cell carcinoma | ||
| SCCIS:squamous cell carcinoma in situ | ||
| Thyroid | 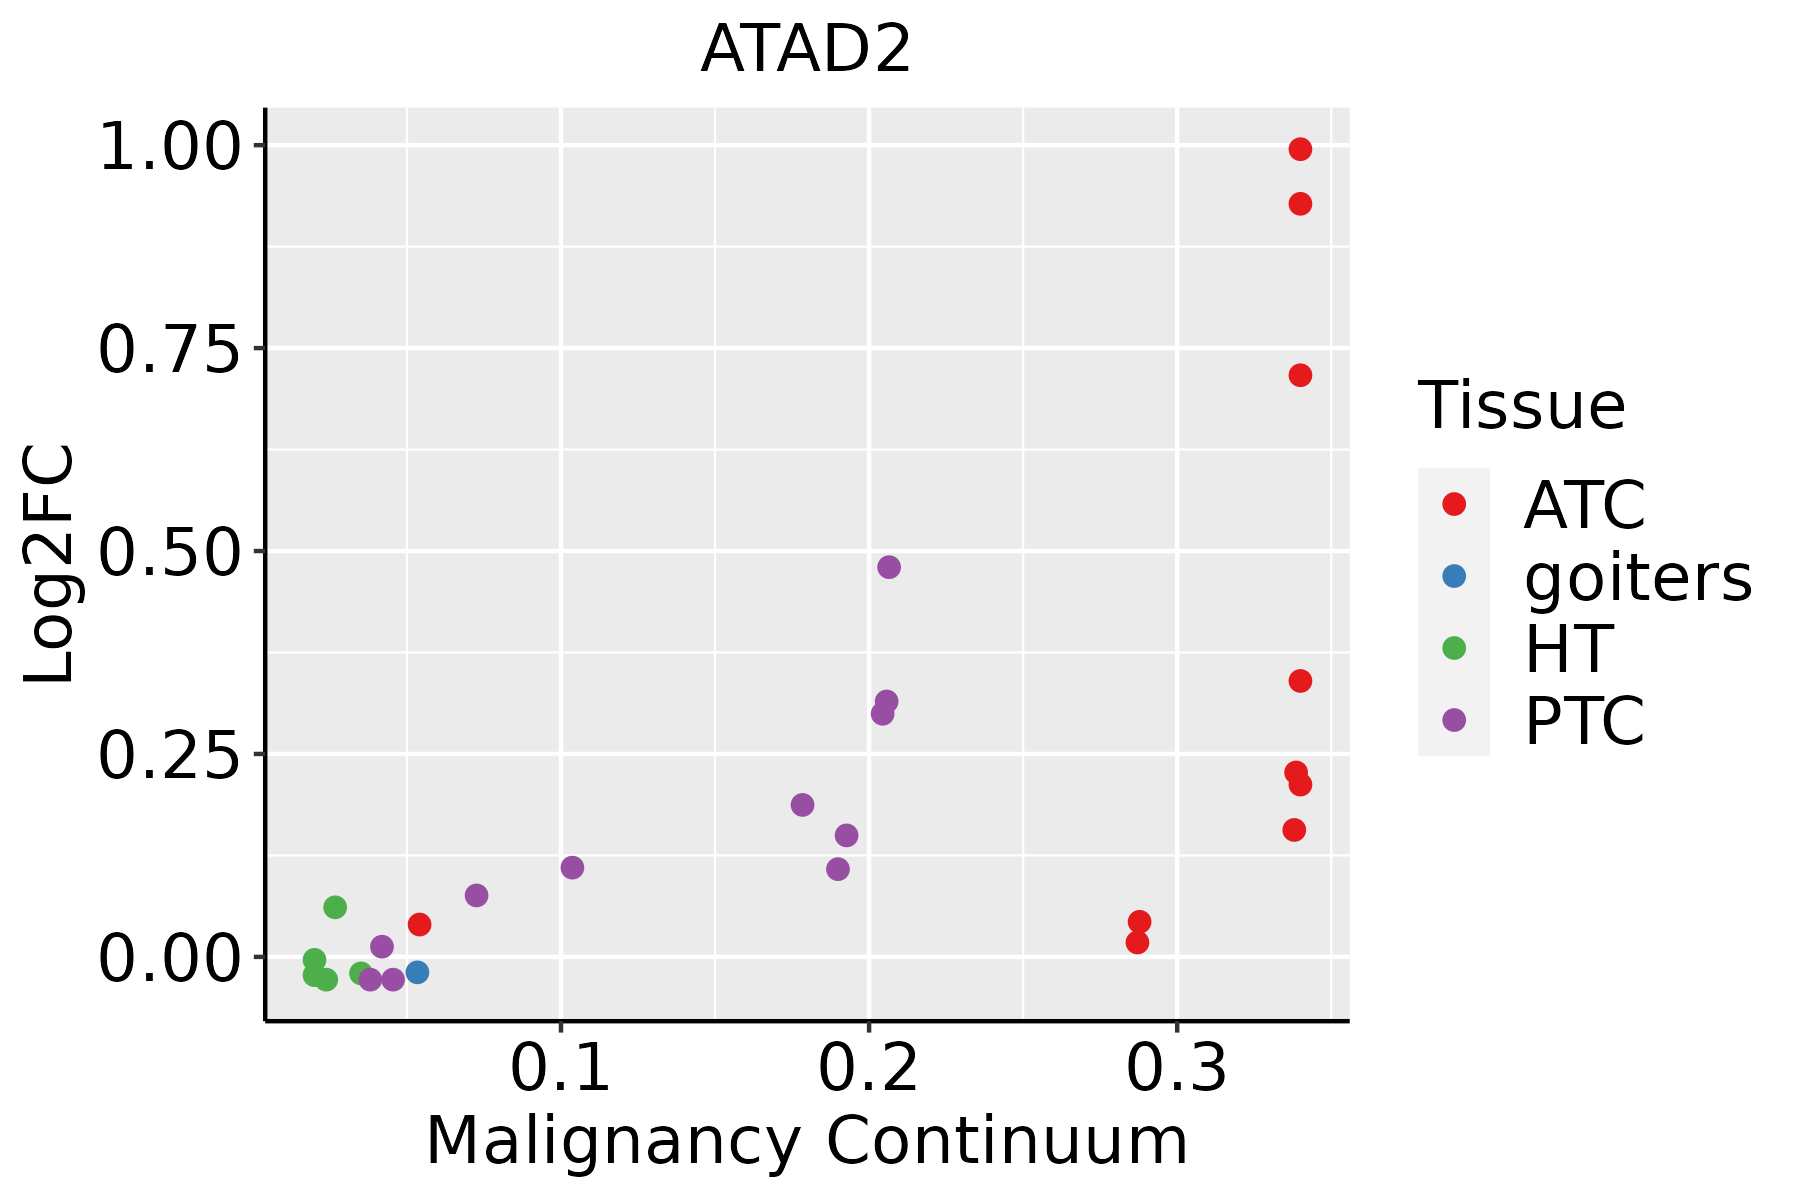 | ATC: Anaplastic thyroid cancer |
| HT: Hashimoto's thyroiditis | ||
| PTC: Papillary thyroid cancer |
| ∗log2FC in expression of this searched gene in stem-like cells from each diseased tissue sample relative to stem-like cells in normal samples in each tissue plotted against the malignancy continuum. Samples are colored based on if they are from different disease stage. |
Top |
Malignant transformation related pathway analysis |
| Find out the enriched GO biological processes and KEGG pathways involved in transition from healthy to precancer to cancer |
| Tissue | Disease Stage | Enriched GO biological Processes |
| Colorectum | AD |  |
| Colorectum | SER |  |
| Colorectum | MSS |  |
| Colorectum | MSI-H |  |
| Colorectum | FAP |  |
| ∗Top 15 enriched GO BP terms are showed in the bar plot of each disease state in each tissue. Each row represents a significant GO biological process which is colored according to the -log10(p.adjust). |
| Page: 1 2 3 4 5 6 7 8 9 |
| GO ID | Tissue | Disease Stage | Description | Gene Ratio | Bg Ratio | pvalue | p.adjust | Count |
| GO:00063257 | Cervix | CC | chromatin organization | 78/2311 | 409/18723 | 5.40e-05 | 8.02e-04 | 78 |
| GO:00063381 | Cervix | CC | chromatin remodeling | 45/2311 | 255/18723 | 8.33e-03 | 4.30e-02 | 45 |
| GO:00063258 | Endometrium | AEH | chromatin organization | 64/2100 | 409/18723 | 3.69e-03 | 2.52e-02 | 64 |
| GO:000632513 | Endometrium | EEC | chromatin organization | 65/2168 | 409/18723 | 4.98e-03 | 3.14e-02 | 65 |
| GO:00434143 | Esophagus | ESCC | macromolecule methylation | 199/8552 | 316/18723 | 3.44e-10 | 9.57e-09 | 199 |
| GO:00322592 | Esophagus | ESCC | methylation | 222/8552 | 364/18723 | 2.26e-09 | 5.09e-08 | 222 |
| GO:000632517 | Esophagus | ESCC | chromatin organization | 240/8552 | 409/18723 | 6.52e-08 | 1.14e-06 | 240 |
| GO:0006304 | Esophagus | ESCC | DNA modification | 68/8552 | 120/18723 | 9.95e-03 | 3.42e-02 | 68 |
| GO:00063255 | Liver | NAFLD | chromatin organization | 64/1882 | 409/18723 | 2.31e-04 | 3.89e-03 | 64 |
| GO:0043414 | Liver | NAFLD | macromolecule methylation | 47/1882 | 316/18723 | 4.08e-03 | 3.41e-02 | 47 |
| GO:00434141 | Liver | HCC | macromolecule methylation | 183/7958 | 316/18723 | 2.00e-08 | 4.72e-07 | 183 |
| GO:0032259 | Liver | HCC | methylation | 206/7958 | 364/18723 | 3.35e-08 | 7.53e-07 | 206 |
| GO:000632511 | Liver | HCC | chromatin organization | 206/7958 | 409/18723 | 7.23e-04 | 4.41e-03 | 206 |
| GO:00063256 | Lung | IAC | chromatin organization | 69/2061 | 409/18723 | 2.01e-04 | 3.53e-03 | 69 |
| GO:000632512 | Lung | AIS | chromatin organization | 62/1849 | 409/18723 | 4.24e-04 | 7.29e-03 | 62 |
| GO:000632510 | Oral cavity | OSCC | chromatin organization | 190/7305 | 409/18723 | 1.17e-03 | 5.97e-03 | 190 |
| GO:00434142 | Oral cavity | OSCC | macromolecule methylation | 149/7305 | 316/18723 | 1.82e-03 | 8.60e-03 | 149 |
| GO:00322591 | Oral cavity | OSCC | methylation | 168/7305 | 364/18723 | 3.03e-03 | 1.31e-02 | 168 |
| GO:000632515 | Oral cavity | EOLP | chromatin organization | 84/2218 | 409/18723 | 2.68e-07 | 8.16e-06 | 84 |
| GO:00063383 | Oral cavity | EOLP | chromatin remodeling | 46/2218 | 255/18723 | 2.34e-03 | 1.44e-02 | 46 |
| Page: 1 2 |
| Pathway ID | Tissue | Disease Stage | Description | Gene Ratio | Bg Ratio | pvalue | p.adjust | qvalue | Count |
| Page: 1 |
Top |
Cell-cell communication analysis |
| Identification of potential cell-cell interactions between two cell types and their ligand-receptor pairs for different disease states |
| Ligand | Receptor | LRpair | Pathway | Tissue | Disease Stage |
| Page: 1 |
Top |
Single-cell gene regulatory network inference analysis |
| Find out the significant the regulons (TFs) and the target genes of each regulon across cell types for different disease states |
| TF | Cell Type | Tissue | Disease Stage | Target Gene | RSS | Regulon Activity |
| ∗The dot plots of a searched regulon are shown for all cell subpopulations in each disease state of each tissue based on the regulon specific score inferred using pySCENIC and by calculating the average expression. |
| Page: 1 |
Top |
Somatic mutation of malignant transformation related genes |
| Annotation of somatic variants for genes involved in malignant transformation |
| Hugo Symbol | Variant Class | Variant Classification | dbSNP RS | HGVSc | HGVSp | HGVSp Short | SWISSPROT | BIOTYPE | SIFT | PolyPhen | Tumor Sample Barcode | Tissue | Histology | Sex | Age | Stage | Therapy Types | Drugs | Outcome |
| ATAD2 | SNV | Missense_Mutation | c.2833N>G | p.Pro945Ala | p.P945A | Q6PL18 | protein_coding | deleterious(0.01) | possibly_damaging(0.636) | TCGA-AC-A23H-01 | Breast | breast invasive carcinoma | Female | >=65 | I/II | Unknown | Unknown | PD | |
| ATAD2 | SNV | Missense_Mutation | c.467N>A | p.Arg156Gln | p.R156Q | Q6PL18 | protein_coding | deleterious(0.02) | probably_damaging(0.998) | TCGA-AN-A046-01 | Breast | breast invasive carcinoma | Female | >=65 | I/II | Unknown | Unknown | SD | |
| ATAD2 | SNV | Missense_Mutation | rs149531312 | c.825T>A | p.Asp275Glu | p.D275E | Q6PL18 | protein_coding | tolerated(0.75) | benign(0) | TCGA-AN-A0AK-01 | Breast | breast invasive carcinoma | Female | >=65 | I/II | Unknown | Unknown | SD |
| ATAD2 | SNV | Missense_Mutation | c.2481T>G | p.Ile827Met | p.I827M | Q6PL18 | protein_coding | tolerated(0.2) | benign(0.011) | TCGA-B6-A0X4-01 | Breast | breast invasive carcinoma | Female | <65 | I/II | Unknown | Unknown | PD | |
| ATAD2 | SNV | Missense_Mutation | c.2189N>A | p.Arg730Lys | p.R730K | Q6PL18 | protein_coding | tolerated(0.33) | benign(0) | TCGA-BH-A0BP-01 | Breast | breast invasive carcinoma | Female | >=65 | I/II | Unknown | Unknown | SD | |
| ATAD2 | SNV | Missense_Mutation | c.3245N>C | p.Arg1082Thr | p.R1082T | Q6PL18 | protein_coding | deleterious(0) | possibly_damaging(0.736) | TCGA-C8-A1HM-01 | Breast | breast invasive carcinoma | Female | >=65 | I/II | Chemotherapy | doxorubicin | CR | |
| ATAD2 | SNV | Missense_Mutation | c.607N>A | p.Glu203Lys | p.E203K | Q6PL18 | protein_coding | deleterious(0.02) | benign(0.272) | TCGA-C8-A26Y-01 | Breast | breast invasive carcinoma | Female | >=65 | I/II | Unknown | Unknown | SD | |
| ATAD2 | SNV | Missense_Mutation | c.1243N>C | p.Asp415His | p.D415H | Q6PL18 | protein_coding | deleterious(0) | possibly_damaging(0.642) | TCGA-D8-A1JJ-01 | Breast | breast invasive carcinoma | Female | <65 | I/II | Chemotherapy | doxorubicine | SD | |
| ATAD2 | SNV | Missense_Mutation | novel | c.2392N>A | p.Val798Ile | p.V798I | Q6PL18 | protein_coding | tolerated(0.28) | benign(0.148) | TCGA-D8-A1XQ-01 | Breast | breast invasive carcinoma | Female | >=65 | I/II | Unknown | Unknown | SD |
| ATAD2 | SNV | Missense_Mutation | c.1762N>A | p.Gly588Ser | p.G588S | Q6PL18 | protein_coding | deleterious(0) | probably_damaging(1) | TCGA-GM-A2DB-01 | Breast | breast invasive carcinoma | Female | <65 | I/II | Chemotherapy | taxol | CR |
| Page: 1 2 3 4 5 6 7 8 9 10 11 12 13 14 15 16 17 18 19 |
Top |
Related drugs of malignant transformation related genes |
| Identification of chemicals and drugs interact with genes involved in malignant transfromation |
| (DGIdb 4.0) |
| Entrez ID | Symbol | Category | Interaction Types | Drug Claim Name | Drug Name | PMIDs |
| 29028 | ATAD2 | NUCLEAR HORMONE RECEPTOR, ENZYME | inhibitor | 252827390 | ||
| 29028 | ATAD2 | NUCLEAR HORMONE RECEPTOR, ENZYME | inhibitor | 252166841 | ||
| 29028 | ATAD2 | NUCLEAR HORMONE RECEPTOR, ENZYME | inhibitor | 336446907 | ||
| 29028 | ATAD2 | NUCLEAR HORMONE RECEPTOR, ENZYME | inhibitor | 252166840 | ||
| 29028 | ATAD2 | NUCLEAR HORMONE RECEPTOR, ENZYME | inhibitor | 385612205 |
| Page: 1 |

Copyright 2023-Present -The University of Texas Health Science Center at Houston |