
|
|||||
|
 | |
| |
| |
| |
| |
| |
|
Gene: ATAD1 |
Gene summary for ATAD1 |
| Gene information | Species | Human | Gene symbol | ATAD1 | Gene ID | 84896 |
| Gene name | ATPase family AAA domain containing 1 | |
| Gene Alias | AFDC1 | |
| Cytomap | 10q23.31 | |
| Gene Type | protein-coding | GO ID | GO:0002090 | UniProtAcc | Q8NBU5 |
Top |
Malignant transformation analysis |
| Identification of the aberrant gene expression in precancerous and cancerous lesions by comparing the gene expression of stem-like cells in diseased tissues with normal stem cells |
| Entrez ID | Symbol | Replicates | Species | Organ | Tissue | Adj P-value | Log2FC | Malignancy |
| 84896 | ATAD1 | HTA11_3410_2000001011 | Human | Colorectum | AD | 1.78e-14 | -5.73e-01 | 0.0155 |
| 84896 | ATAD1 | HTA11_2487_2000001011 | Human | Colorectum | SER | 1.00e-03 | -4.62e-01 | -0.1808 |
| 84896 | ATAD1 | HTA11_696_2000001011 | Human | Colorectum | AD | 3.28e-15 | -4.76e-01 | -0.1464 |
| 84896 | ATAD1 | HTA11_866_2000001011 | Human | Colorectum | AD | 7.84e-12 | -4.42e-01 | -0.1001 |
| 84896 | ATAD1 | HTA11_866_3004761011 | Human | Colorectum | AD | 1.93e-06 | -4.70e-01 | 0.096 |
| 84896 | ATAD1 | HTA11_10711_2000001011 | Human | Colorectum | AD | 1.05e-04 | -5.22e-01 | 0.0338 |
| 84896 | ATAD1 | HTA11_7696_3000711011 | Human | Colorectum | AD | 3.86e-14 | -4.85e-01 | 0.0674 |
| 84896 | ATAD1 | HTA11_6818_2000001011 | Human | Colorectum | AD | 7.76e-03 | -5.85e-01 | 0.0112 |
| 84896 | ATAD1 | HTA11_6818_2000001021 | Human | Colorectum | AD | 3.21e-03 | -5.25e-01 | 0.0588 |
| 84896 | ATAD1 | HTA11_99999970781_79442 | Human | Colorectum | MSS | 2.12e-03 | -2.66e-01 | 0.294 |
| 84896 | ATAD1 | HTA11_99999971662_82457 | Human | Colorectum | MSS | 1.30e-07 | -3.82e-01 | 0.3859 |
| 84896 | ATAD1 | HTA11_99999973899_84307 | Human | Colorectum | MSS | 2.56e-02 | -5.27e-01 | 0.2585 |
| 84896 | ATAD1 | HTA11_99999974143_84620 | Human | Colorectum | MSS | 7.90e-16 | -4.81e-01 | 0.3005 |
| 84896 | ATAD1 | A015-C-203 | Human | Colorectum | FAP | 1.78e-23 | -4.20e-01 | -0.1294 |
| 84896 | ATAD1 | A015-C-204 | Human | Colorectum | FAP | 2.42e-04 | -3.52e-01 | -0.0228 |
| 84896 | ATAD1 | A002-C-201 | Human | Colorectum | FAP | 8.61e-09 | -3.90e-01 | 0.0324 |
| 84896 | ATAD1 | A002-C-203 | Human | Colorectum | FAP | 6.78e-05 | -2.06e-01 | 0.2786 |
| 84896 | ATAD1 | A001-C-119 | Human | Colorectum | FAP | 7.39e-05 | -3.93e-01 | -0.1557 |
| 84896 | ATAD1 | A001-C-108 | Human | Colorectum | FAP | 5.02e-13 | -3.51e-01 | -0.0272 |
| 84896 | ATAD1 | A002-C-205 | Human | Colorectum | FAP | 2.94e-16 | -5.12e-01 | -0.1236 |
| Page: 1 2 3 4 5 6 7 8 |
| Tissue | Expression Dynamics | Abbreviation |
| Colorectum (GSE201348) |  | FAP: Familial adenomatous polyposis |
| CRC: Colorectal cancer | ||
| Colorectum (HTA11) |  | AD: Adenomas |
| SER: Sessile serrated lesions | ||
| MSI-H: Microsatellite-high colorectal cancer | ||
| MSS: Microsatellite stable colorectal cancer | ||
| Esophagus |  | ESCC: Esophageal squamous cell carcinoma |
| HGIN: High-grade intraepithelial neoplasias | ||
| LGIN: Low-grade intraepithelial neoplasias | ||
| Liver |  | HCC: Hepatocellular carcinoma |
| NAFLD: Non-alcoholic fatty liver disease | ||
| Oral Cavity | 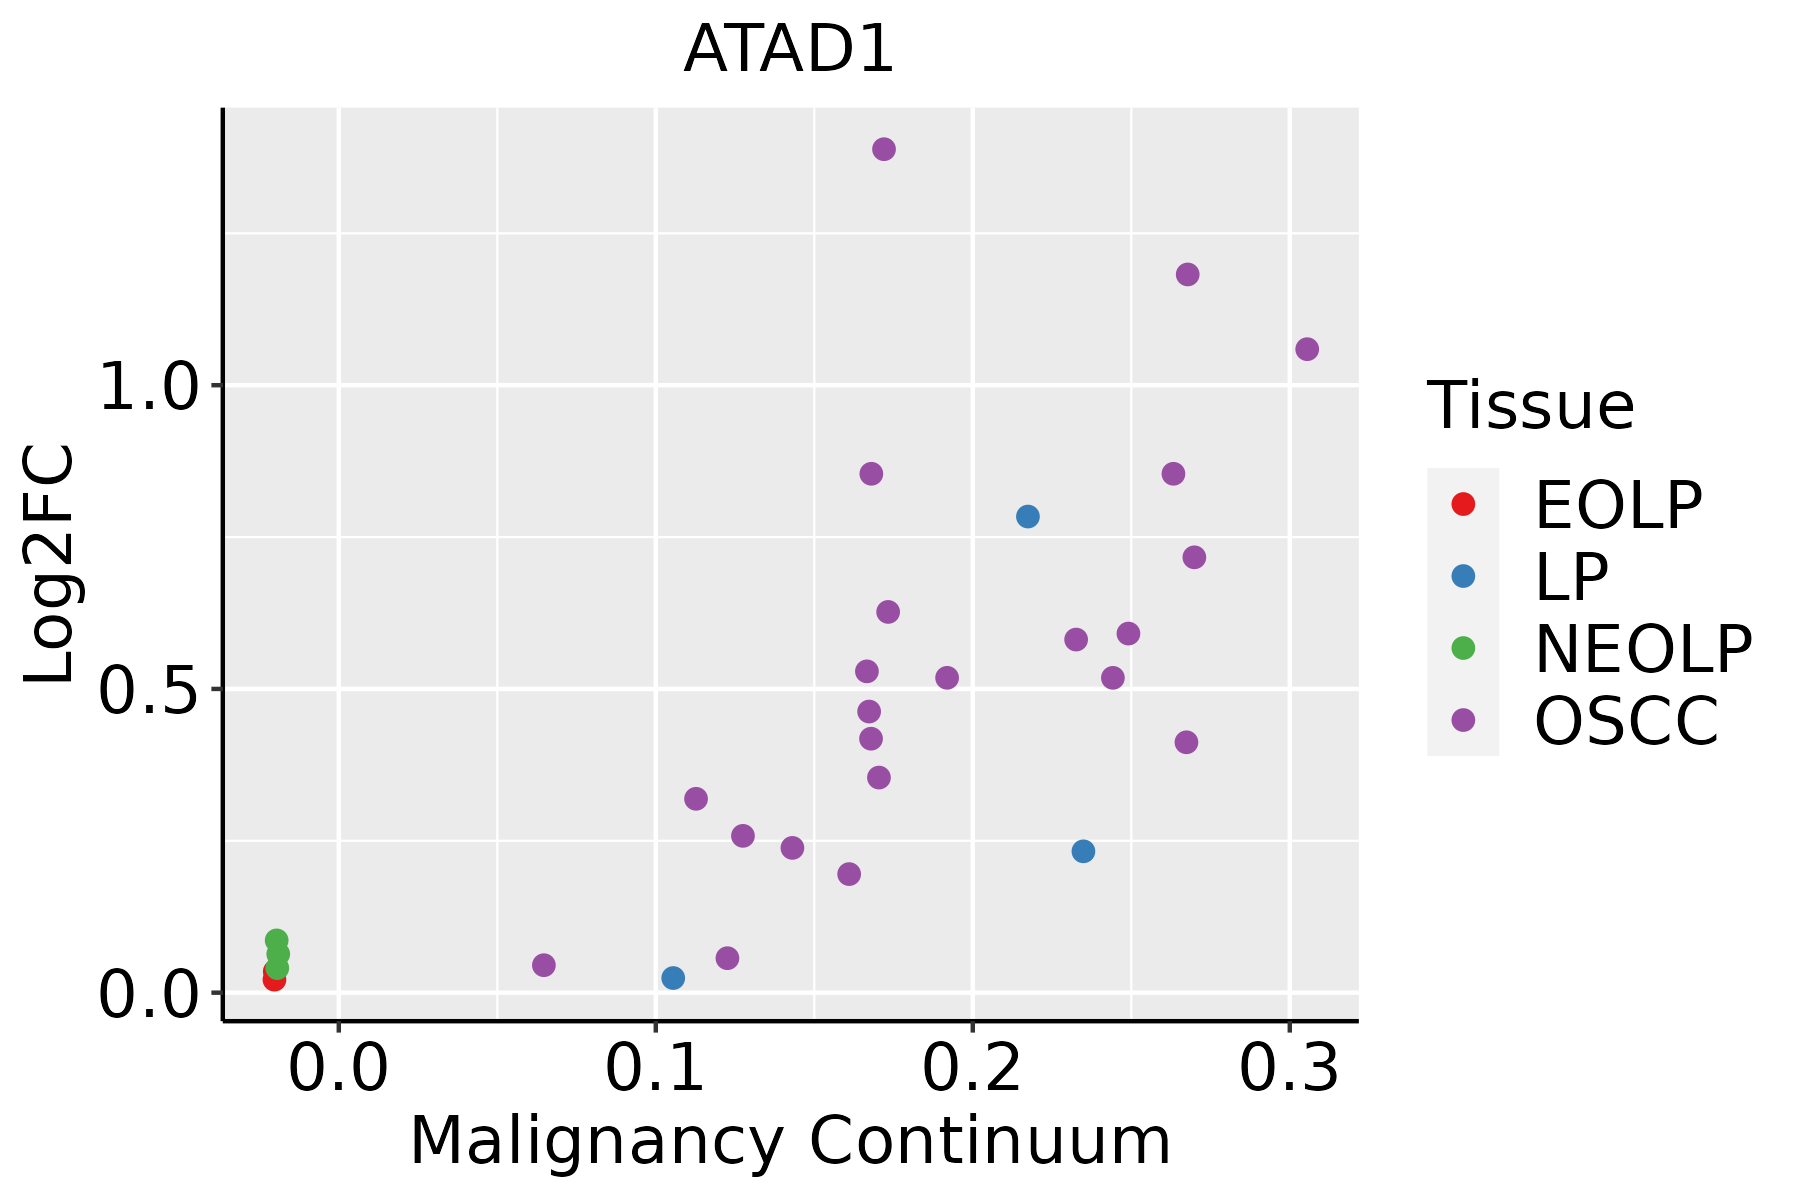 | EOLP: Erosive Oral lichen planus |
| LP: leukoplakia | ||
| NEOLP: Non-erosive oral lichen planus | ||
| OSCC: Oral squamous cell carcinoma | ||
| Skin | 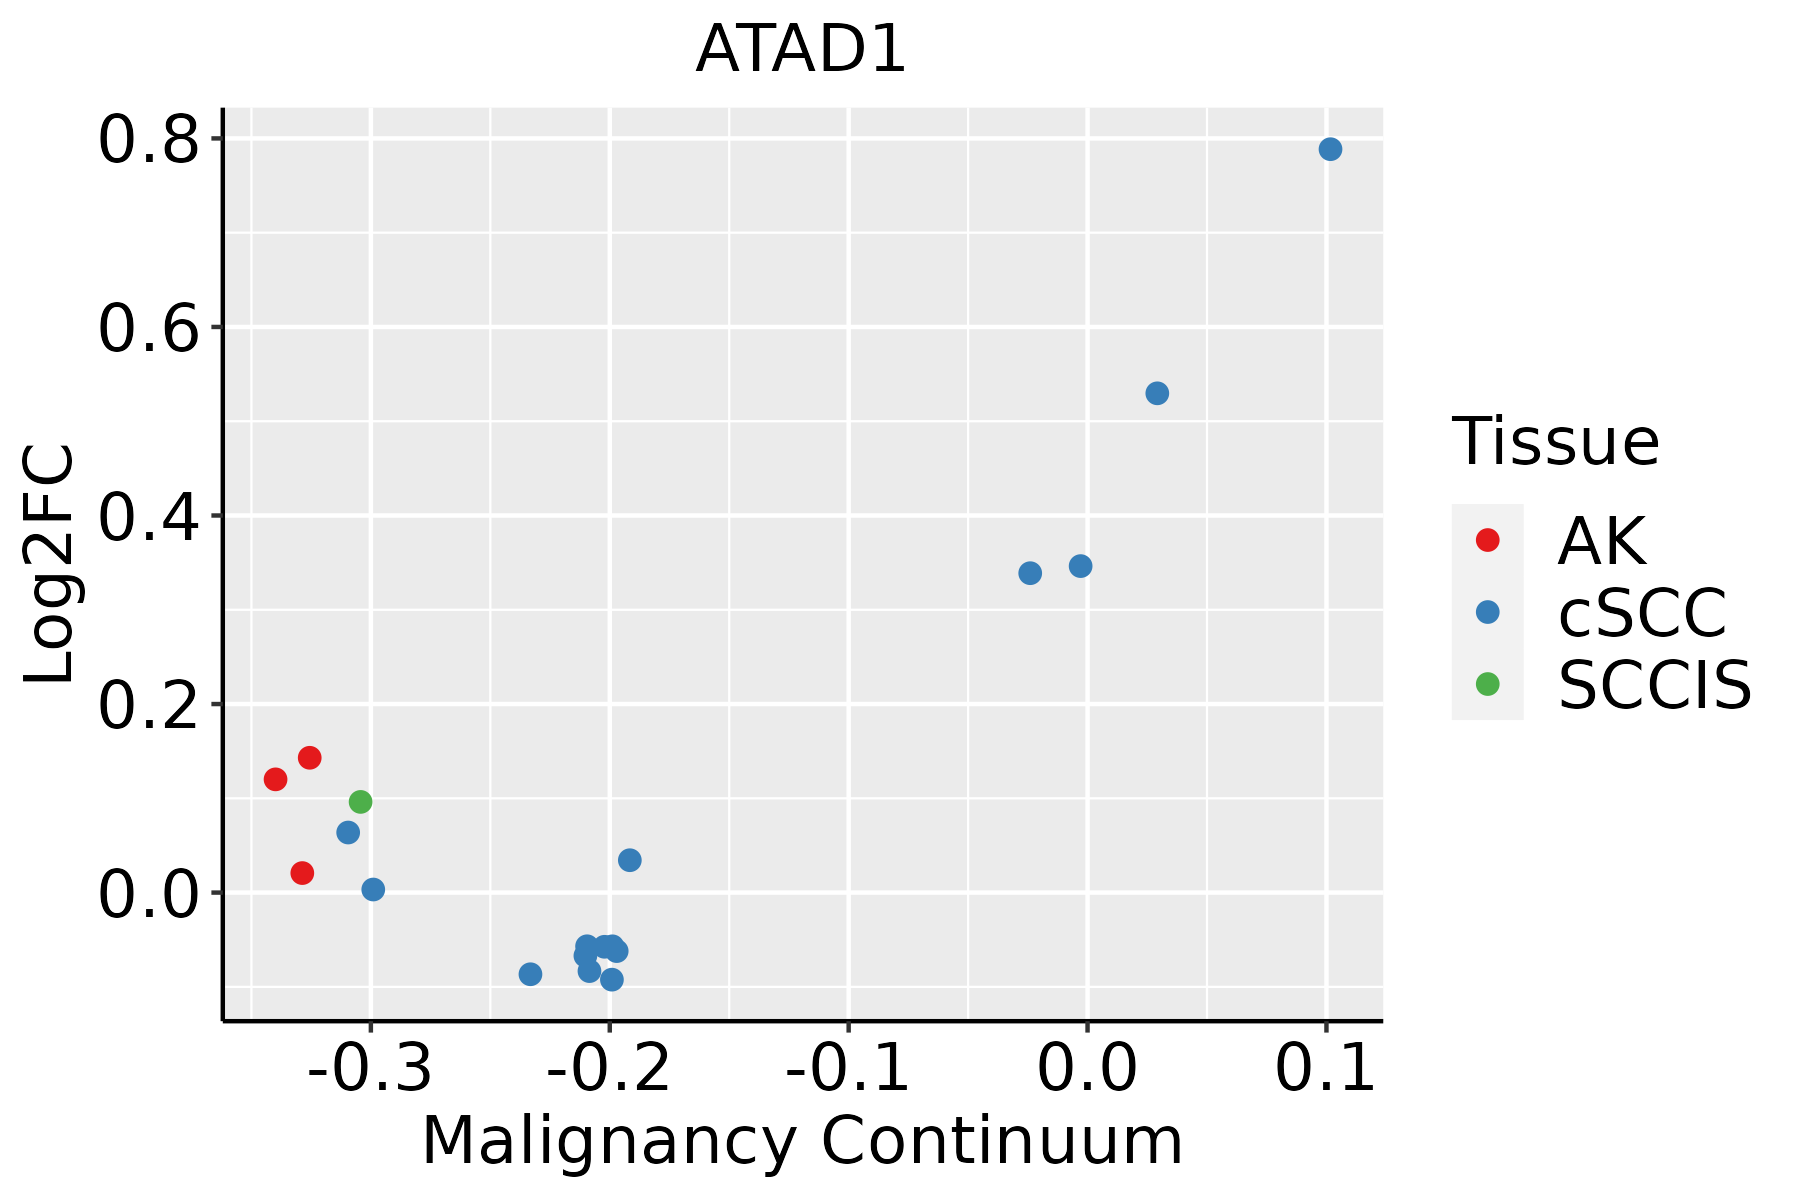 | AK: Actinic keratosis |
| cSCC: Cutaneous squamous cell carcinoma | ||
| SCCIS:squamous cell carcinoma in situ | ||
| Thyroid | 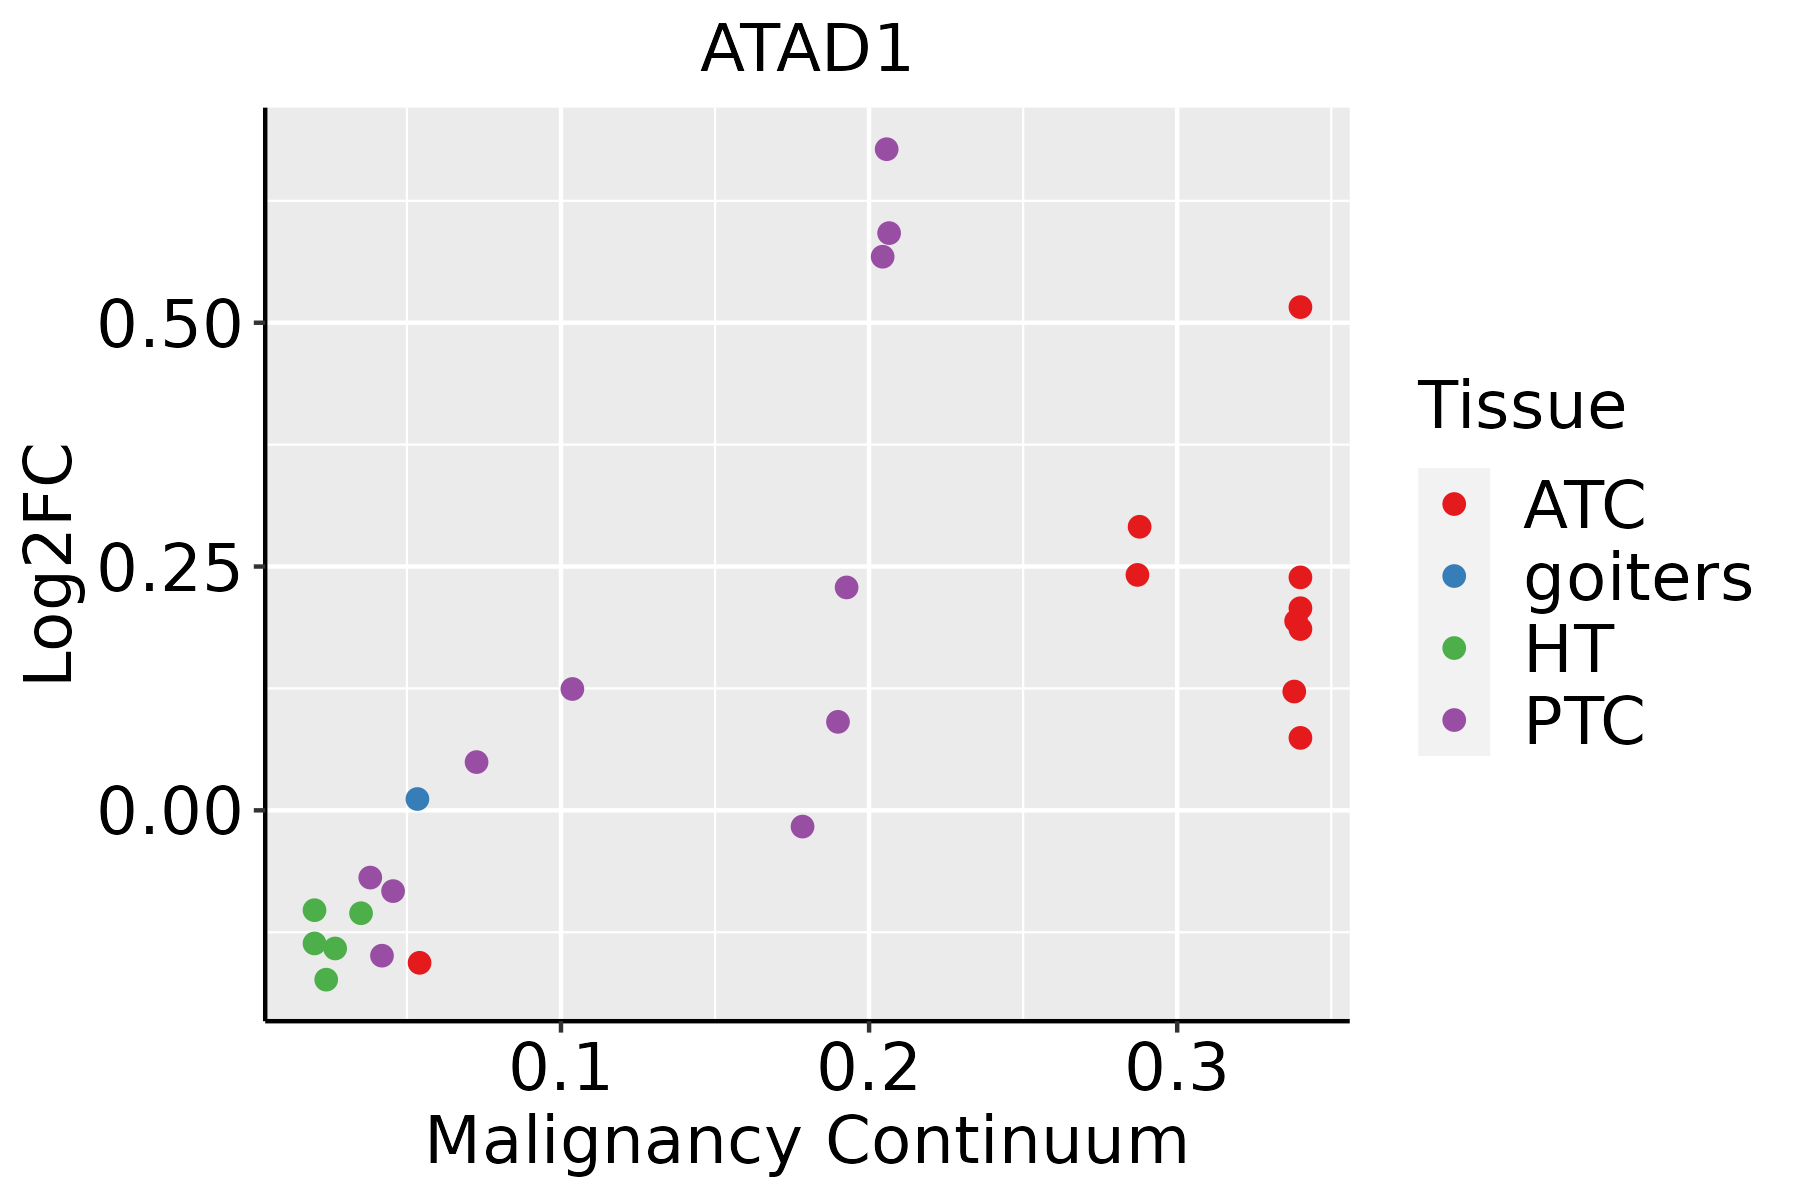 | ATC: Anaplastic thyroid cancer |
| HT: Hashimoto's thyroiditis | ||
| PTC: Papillary thyroid cancer |
| ∗log2FC in expression of this searched gene in stem-like cells from each diseased tissue sample relative to stem-like cells in normal samples in each tissue plotted against the malignancy continuum. Samples are colored based on if they are from different disease stage. |
Top |
Malignant transformation related pathway analysis |
| Find out the enriched GO biological processes and KEGG pathways involved in transition from healthy to precancer to cancer |
| Tissue | Disease Stage | Enriched GO biological Processes |
| Colorectum | AD |  |
| Colorectum | SER |  |
| Colorectum | MSS |  |
| Colorectum | MSI-H |  |
| Colorectum | FAP |  |
| ∗Top 15 enriched GO BP terms are showed in the bar plot of each disease state in each tissue. Each row represents a significant GO biological process which is colored according to the -log10(p.adjust). |
| Page: 1 2 3 4 5 6 7 8 9 |
| GO ID | Tissue | Disease Stage | Description | Gene Ratio | Bg Ratio | pvalue | p.adjust | Count |
| GO:0090150 | Colorectum | AD | establishment of protein localization to membrane | 100/3918 | 260/18723 | 6.01e-11 | 6.33e-09 | 100 |
| GO:0043112 | Colorectum | AD | receptor metabolic process | 62/3918 | 166/18723 | 8.18e-07 | 2.85e-05 | 62 |
| GO:0006898 | Colorectum | AD | receptor-mediated endocytosis | 76/3918 | 244/18723 | 1.07e-04 | 1.59e-03 | 76 |
| GO:0030100 | Colorectum | AD | regulation of endocytosis | 67/3918 | 211/18723 | 1.42e-04 | 2.01e-03 | 67 |
| GO:0045807 | Colorectum | AD | positive regulation of endocytosis | 35/3918 | 100/18723 | 7.78e-04 | 7.78e-03 | 35 |
| GO:0048260 | Colorectum | AD | positive regulation of receptor-mediated endocytosis | 20/3918 | 52/18723 | 2.87e-03 | 2.14e-02 | 20 |
| GO:0048259 | Colorectum | AD | regulation of receptor-mediated endocytosis | 35/3918 | 110/18723 | 4.85e-03 | 3.27e-02 | 35 |
| GO:0031623 | Colorectum | AD | receptor internalization | 35/3918 | 113/18723 | 7.72e-03 | 4.66e-02 | 35 |
| GO:00901501 | Colorectum | SER | establishment of protein localization to membrane | 68/2897 | 260/18723 | 5.55e-06 | 2.01e-04 | 68 |
| GO:00301001 | Colorectum | SER | regulation of endocytosis | 48/2897 | 211/18723 | 3.29e-03 | 2.82e-02 | 48 |
| GO:00901502 | Colorectum | MSS | establishment of protein localization to membrane | 90/3467 | 260/18723 | 4.11e-10 | 3.49e-08 | 90 |
| GO:00431121 | Colorectum | MSS | receptor metabolic process | 57/3467 | 166/18723 | 8.47e-07 | 2.97e-05 | 57 |
| GO:00301002 | Colorectum | MSS | regulation of endocytosis | 63/3467 | 211/18723 | 4.05e-05 | 7.66e-04 | 63 |
| GO:00068981 | Colorectum | MSS | receptor-mediated endocytosis | 69/3467 | 244/18723 | 1.18e-04 | 1.82e-03 | 69 |
| GO:00458071 | Colorectum | MSS | positive regulation of endocytosis | 33/3467 | 100/18723 | 3.73e-04 | 4.72e-03 | 33 |
| GO:00482601 | Colorectum | MSS | positive regulation of receptor-mediated endocytosis | 19/3467 | 52/18723 | 1.66e-03 | 1.49e-02 | 19 |
| GO:00482591 | Colorectum | MSS | regulation of receptor-mediated endocytosis | 33/3467 | 110/18723 | 2.33e-03 | 1.90e-02 | 33 |
| GO:00316231 | Colorectum | MSS | receptor internalization | 32/3467 | 113/18723 | 7.02e-03 | 4.50e-02 | 32 |
| GO:00901504 | Colorectum | FAP | establishment of protein localization to membrane | 69/2622 | 260/18723 | 6.40e-08 | 4.54e-06 | 69 |
| GO:00068982 | Colorectum | FAP | receptor-mediated endocytosis | 62/2622 | 244/18723 | 1.47e-06 | 6.39e-05 | 62 |
| Page: 1 2 3 4 5 6 |
| Pathway ID | Tissue | Disease Stage | Description | Gene Ratio | Bg Ratio | pvalue | p.adjust | qvalue | Count |
| Page: 1 |
Top |
Cell-cell communication analysis |
| Identification of potential cell-cell interactions between two cell types and their ligand-receptor pairs for different disease states |
| Ligand | Receptor | LRpair | Pathway | Tissue | Disease Stage |
| Page: 1 |
Top |
Single-cell gene regulatory network inference analysis |
| Find out the significant the regulons (TFs) and the target genes of each regulon across cell types for different disease states |
| TF | Cell Type | Tissue | Disease Stage | Target Gene | RSS | Regulon Activity |
| ∗The dot plots of a searched regulon are shown for all cell subpopulations in each disease state of each tissue based on the regulon specific score inferred using pySCENIC and by calculating the average expression. |
| Page: 1 |
Top |
Somatic mutation of malignant transformation related genes |
| Annotation of somatic variants for genes involved in malignant transformation |
| Hugo Symbol | Variant Class | Variant Classification | dbSNP RS | HGVSc | HGVSp | HGVSp Short | SWISSPROT | BIOTYPE | SIFT | PolyPhen | Tumor Sample Barcode | Tissue | Histology | Sex | Age | Stage | Therapy Types | Drugs | Outcome |
| ATAD1 | SNV | Missense_Mutation | novel | c.134G>A | p.Arg45Lys | p.R45K | Q8NBU5 | protein_coding | tolerated(0.37) | benign(0.027) | TCGA-BH-A2L8-01 | Breast | breast invasive carcinoma | Female | <65 | I/II | Chemotherapy | cytoxan | CR |
| ATAD1 | SNV | Missense_Mutation | c.238N>T | p.Leu80Phe | p.L80F | Q8NBU5 | protein_coding | tolerated(0.08) | possibly_damaging(0.533) | TCGA-IR-A3LL-01 | Cervix | cervical & endocervical cancer | Female | <65 | I/II | Chemotherapy | cisplatin | CR | |
| ATAD1 | SNV | Missense_Mutation | novel | c.37N>T | p.Arg13Trp | p.R13W | Q8NBU5 | protein_coding | deleterious(0) | probably_damaging(0.983) | TCGA-A6-6137-01 | Colorectum | colon adenocarcinoma | Male | <65 | III/IV | Chemotherapy | fluorouracil | SD |
| ATAD1 | SNV | Missense_Mutation | novel | c.682N>G | p.Ser228Gly | p.S228G | Q8NBU5 | protein_coding | tolerated(0.14) | benign(0.003) | TCGA-AA-3972-01 | Colorectum | colon adenocarcinoma | Male | >=65 | III/IV | Chemotherapy | capecitabine | PD |
| ATAD1 | SNV | Missense_Mutation | rs780964486 | c.716N>A | p.Arg239His | p.R239H | Q8NBU5 | protein_coding | deleterious(0.02) | possibly_damaging(0.672) | TCGA-AZ-4313-01 | Colorectum | colon adenocarcinoma | Female | <65 | I/II | Unknown | Unknown | SD |
| ATAD1 | SNV | Missense_Mutation | c.188G>A | p.Gly63Glu | p.G63E | Q8NBU5 | protein_coding | deleterious(0) | probably_damaging(0.924) | TCGA-AZ-4315-01 | Colorectum | colon adenocarcinoma | Male | <65 | I/II | Unknown | Unknown | SD | |
| ATAD1 | SNV | Missense_Mutation | novel | c.1026N>T | p.Lys342Asn | p.K342N | Q8NBU5 | protein_coding | deleterious(0.03) | benign(0.051) | TCGA-AG-A002-01 | Colorectum | rectum adenocarcinoma | Male | <65 | I/II | Unknown | Unknown | SD |
| ATAD1 | SNV | Missense_Mutation | novel | c.313N>T | p.Asp105Tyr | p.D105Y | Q8NBU5 | protein_coding | deleterious(0) | possibly_damaging(0.77) | TCGA-AG-A002-01 | Colorectum | rectum adenocarcinoma | Male | <65 | I/II | Unknown | Unknown | SD |
| ATAD1 | SNV | Missense_Mutation | c.490N>A | p.Asp164Asn | p.D164N | Q8NBU5 | protein_coding | deleterious(0.05) | probably_damaging(0.969) | TCGA-AP-A0LM-01 | Endometrium | uterine corpus endometrioid carcinoma | Female | <65 | III/IV | Chemotherapy | cisplatin | SD | |
| ATAD1 | SNV | Missense_Mutation | novel | c.773A>C | p.Asn258Thr | p.N258T | Q8NBU5 | protein_coding | tolerated(0.1) | benign(0.216) | TCGA-AX-A0IS-01 | Endometrium | uterine corpus endometrioid carcinoma | Female | <65 | I/II | Chemotherapy | carboplatin | PD |
| Page: 1 2 3 |
Top |
Related drugs of malignant transformation related genes |
| Identification of chemicals and drugs interact with genes involved in malignant transfromation |
| (DGIdb 4.0) |
| Entrez ID | Symbol | Category | Interaction Types | Drug Claim Name | Drug Name | PMIDs |
| Page: 1 |

Copyright 2023-Present -The University of Texas Health Science Center at Houston |