
|
|||||
|
 | |
| |
| |
| |
| |
| |
|
Gene: ASXL2 |
Gene summary for ASXL2 |
| Gene information | Species | Human | Gene symbol | ASXL2 | Gene ID | 55252 |
| Gene name | ASXL transcriptional regulator 2 | |
| Gene Alias | ASXH2 | |
| Cytomap | 2p23.3 | |
| Gene Type | protein-coding | GO ID | GO:0006139 | UniProtAcc | Q76L83 |
Top |
Malignant transformation analysis |
| Identification of the aberrant gene expression in precancerous and cancerous lesions by comparing the gene expression of stem-like cells in diseased tissues with normal stem cells |
| Entrez ID | Symbol | Replicates | Species | Organ | Tissue | Adj P-value | Log2FC | Malignancy |
| 55252 | ASXL2 | CCI_1 | Human | Cervix | CC | 7.23e-04 | 6.82e-01 | 0.528 |
| 55252 | ASXL2 | CCI_2 | Human | Cervix | CC | 1.39e-09 | 1.09e+00 | 0.5249 |
| 55252 | ASXL2 | HTA11_3410_2000001011 | Human | Colorectum | AD | 1.01e-07 | -3.80e-01 | 0.0155 |
| 55252 | ASXL2 | HTA11_347_2000001011 | Human | Colorectum | AD | 1.45e-03 | 3.67e-01 | -0.1954 |
| 55252 | ASXL2 | HTA11_7696_3000711011 | Human | Colorectum | AD | 2.45e-03 | -2.87e-01 | 0.0674 |
| 55252 | ASXL2 | A001-C-207 | Human | Colorectum | FAP | 7.51e-04 | -2.79e-01 | 0.1278 |
| 55252 | ASXL2 | A015-C-203 | Human | Colorectum | FAP | 9.45e-24 | -3.71e-01 | -0.1294 |
| 55252 | ASXL2 | A015-C-204 | Human | Colorectum | FAP | 7.39e-07 | -2.70e-01 | -0.0228 |
| 55252 | ASXL2 | A014-C-040 | Human | Colorectum | FAP | 6.20e-06 | -5.68e-01 | -0.1184 |
| 55252 | ASXL2 | A002-C-201 | Human | Colorectum | FAP | 3.04e-15 | -3.50e-01 | 0.0324 |
| 55252 | ASXL2 | A001-C-119 | Human | Colorectum | FAP | 7.84e-05 | -1.19e-01 | -0.1557 |
| 55252 | ASXL2 | A001-C-108 | Human | Colorectum | FAP | 3.29e-11 | -2.12e-01 | -0.0272 |
| 55252 | ASXL2 | A002-C-205 | Human | Colorectum | FAP | 1.49e-22 | -4.45e-01 | -0.1236 |
| 55252 | ASXL2 | A001-C-104 | Human | Colorectum | FAP | 7.52e-05 | -2.42e-01 | 0.0184 |
| 55252 | ASXL2 | A015-C-005 | Human | Colorectum | FAP | 5.61e-05 | -2.19e-01 | -0.0336 |
| 55252 | ASXL2 | A015-C-006 | Human | Colorectum | FAP | 1.34e-14 | -4.39e-01 | -0.0994 |
| 55252 | ASXL2 | A015-C-106 | Human | Colorectum | FAP | 1.16e-08 | -1.74e-01 | -0.0511 |
| 55252 | ASXL2 | A002-C-114 | Human | Colorectum | FAP | 5.80e-16 | -3.53e-01 | -0.1561 |
| 55252 | ASXL2 | A015-C-104 | Human | Colorectum | FAP | 6.44e-24 | -4.79e-01 | -0.1899 |
| 55252 | ASXL2 | A001-C-014 | Human | Colorectum | FAP | 1.42e-14 | -3.61e-01 | 0.0135 |
| Page: 1 2 3 4 5 |
| Tissue | Expression Dynamics | Abbreviation |
| Cervix | 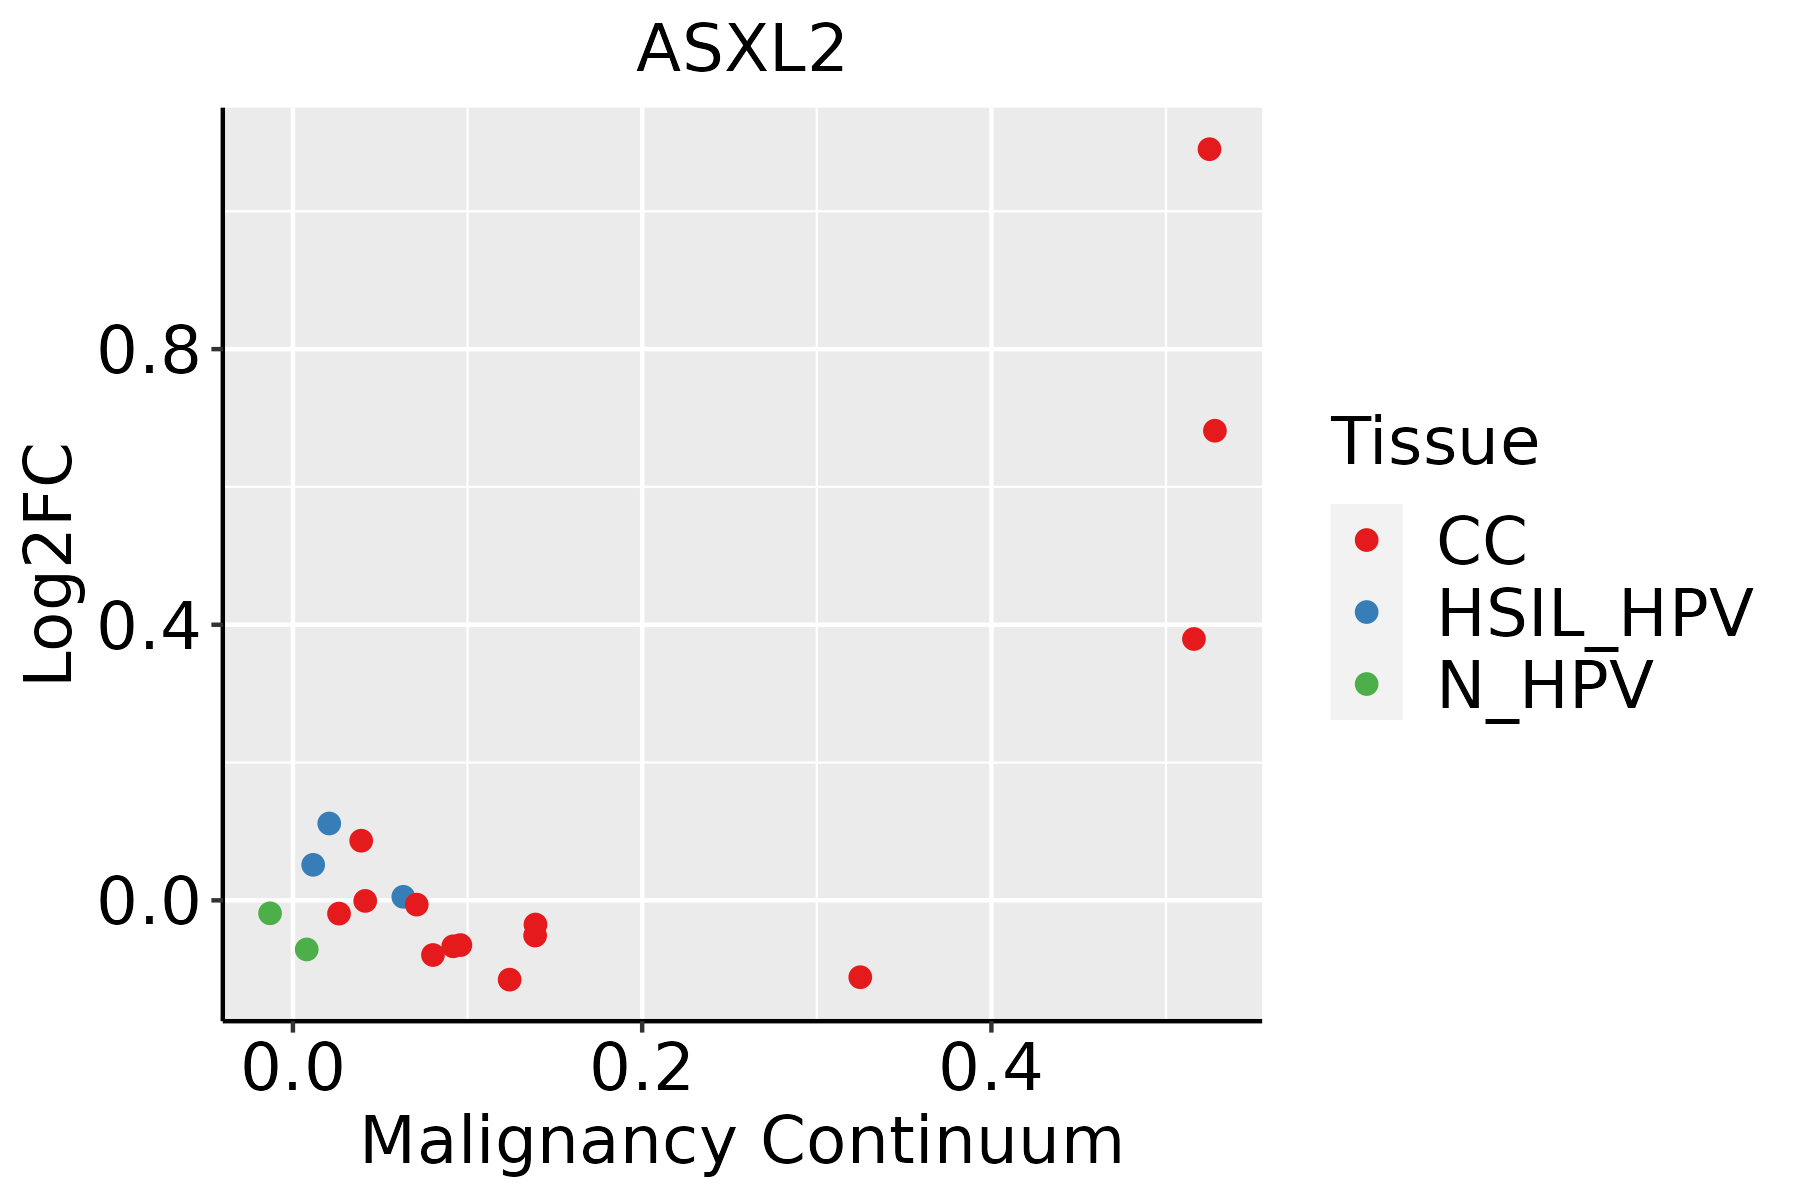 | CC: Cervix cancer |
| HSIL_HPV: HPV-infected high-grade squamous intraepithelial lesions | ||
| N_HPV: HPV-infected normal cervix | ||
| Colorectum (GSE201348) |  | FAP: Familial adenomatous polyposis |
| CRC: Colorectal cancer | ||
| Colorectum (HTA11) |  | AD: Adenomas |
| SER: Sessile serrated lesions | ||
| MSI-H: Microsatellite-high colorectal cancer | ||
| MSS: Microsatellite stable colorectal cancer | ||
| Esophagus | 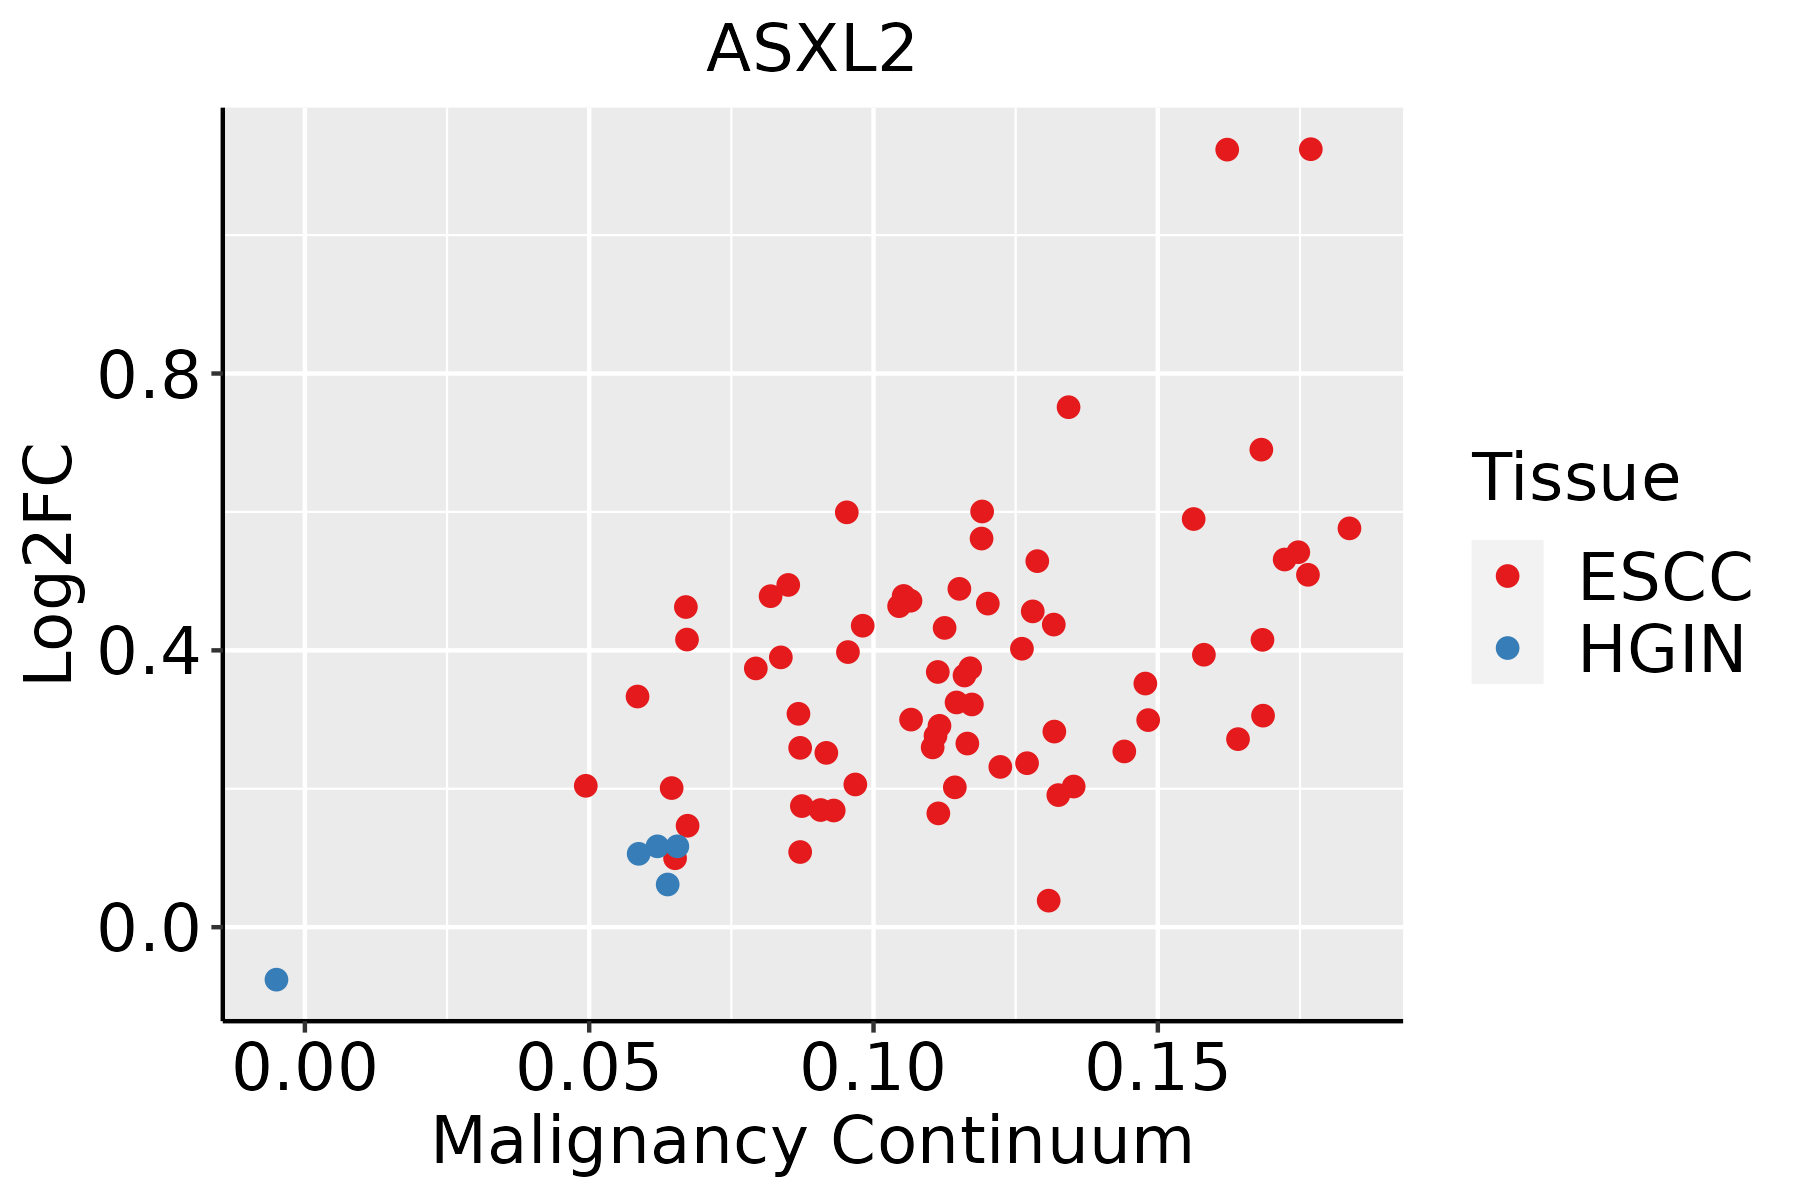 | ESCC: Esophageal squamous cell carcinoma |
| HGIN: High-grade intraepithelial neoplasias | ||
| LGIN: Low-grade intraepithelial neoplasias | ||
| Liver | 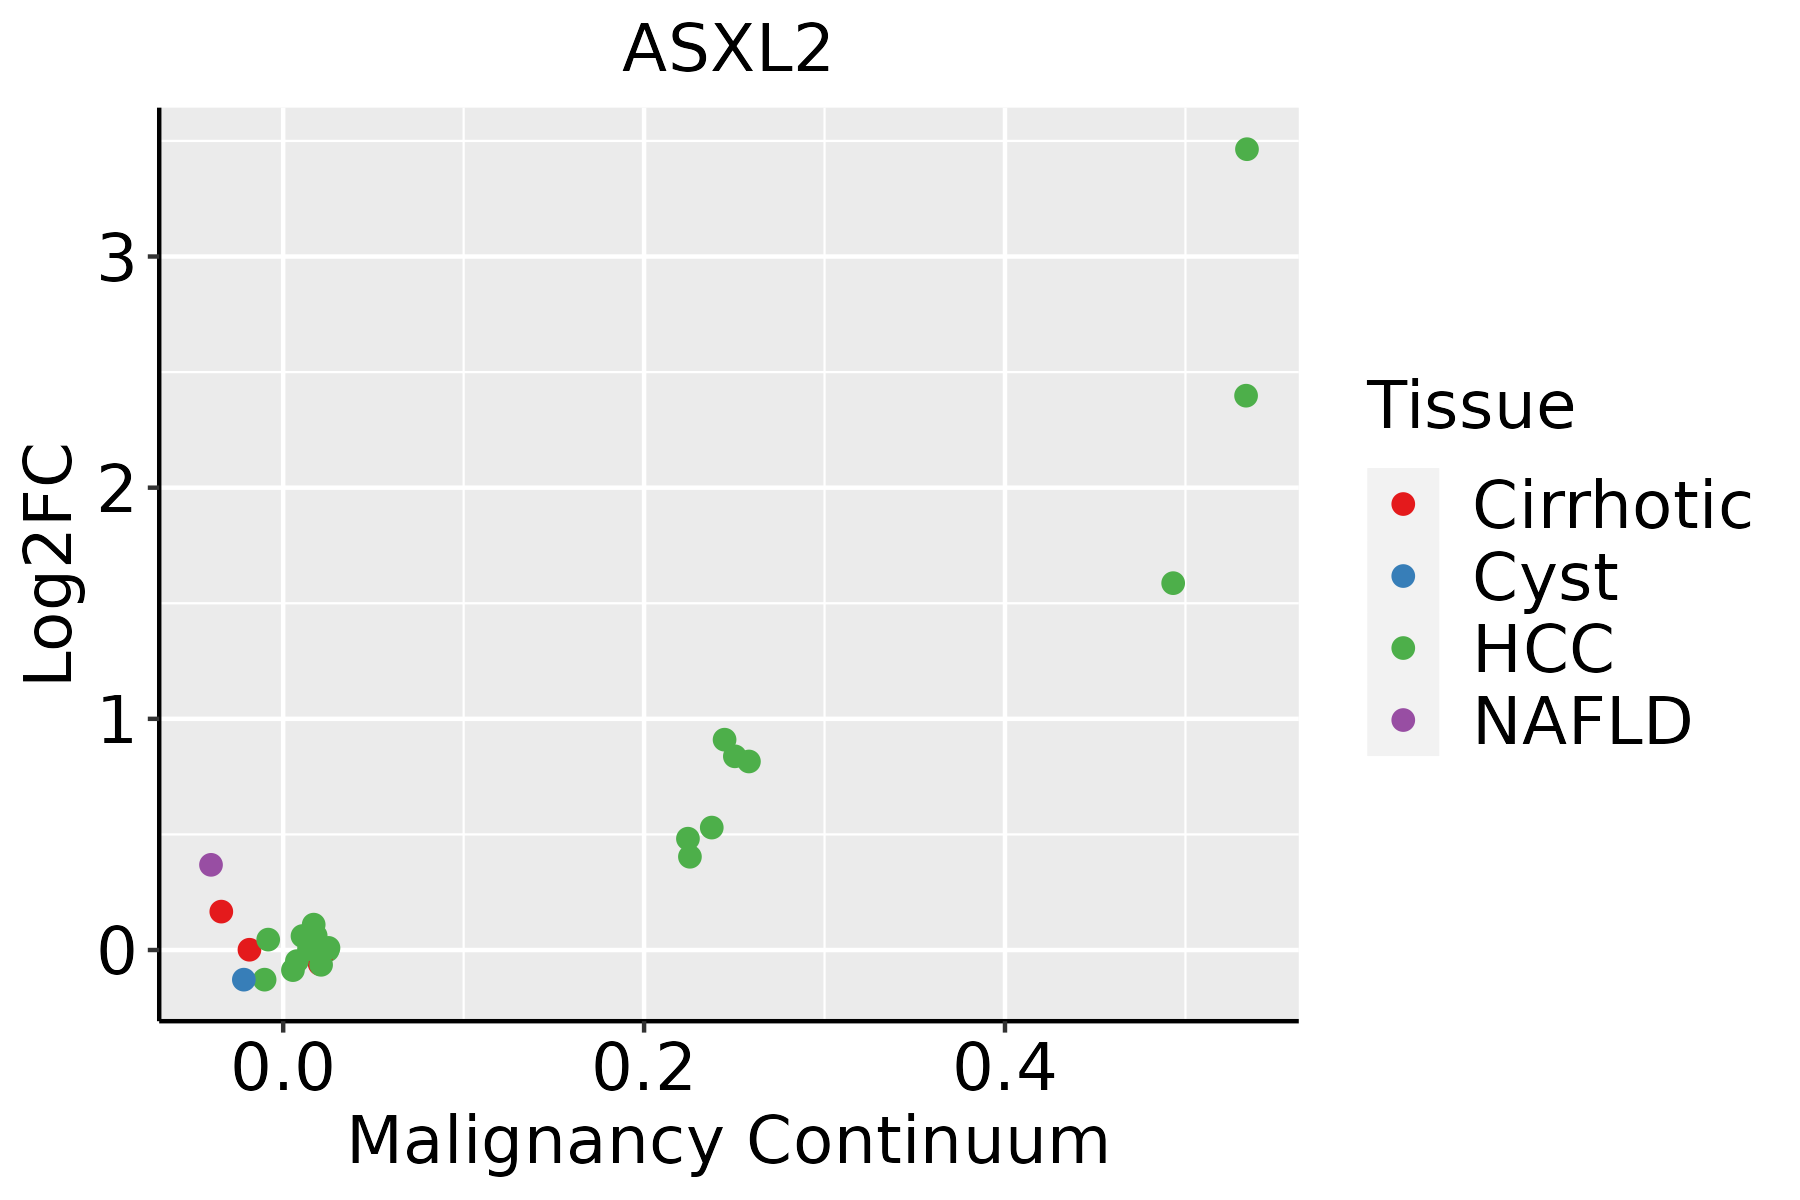 | HCC: Hepatocellular carcinoma |
| NAFLD: Non-alcoholic fatty liver disease |
| ∗log2FC in expression of this searched gene in stem-like cells from each diseased tissue sample relative to stem-like cells in normal samples in each tissue plotted against the malignancy continuum. Samples are colored based on if they are from different disease stage. |
Top |
Malignant transformation related pathway analysis |
| Find out the enriched GO biological processes and KEGG pathways involved in transition from healthy to precancer to cancer |
| Tissue | Disease Stage | Enriched GO biological Processes |
| Colorectum | AD |  |
| Colorectum | SER |  |
| Colorectum | MSS |  |
| Colorectum | MSI-H |  |
| Colorectum | FAP |  |
| ∗Top 15 enriched GO BP terms are showed in the bar plot of each disease state in each tissue. Each row represents a significant GO biological process which is colored according to the -log10(p.adjust). |
| Page: 1 2 3 4 5 6 7 8 9 |
| GO ID | Tissue | Disease Stage | Description | Gene Ratio | Bg Ratio | pvalue | p.adjust | Count |
| GO:00512359 | Cervix | CC | maintenance of location | 78/2311 | 327/18723 | 5.18e-09 | 4.92e-07 | 78 |
| GO:00305229 | Cervix | CC | intracellular receptor signaling pathway | 60/2311 | 265/18723 | 1.89e-06 | 5.97e-05 | 60 |
| GO:00454445 | Cervix | CC | fat cell differentiation | 53/2311 | 229/18723 | 3.72e-06 | 9.75e-05 | 53 |
| GO:0045598 | Cervix | CC | regulation of fat cell differentiation | 31/2311 | 139/18723 | 7.06e-04 | 6.41e-03 | 31 |
| GO:00456004 | Cervix | CC | positive regulation of fat cell differentiation | 18/2311 | 66/18723 | 8.09e-04 | 7.07e-03 | 18 |
| GO:00108834 | Cervix | CC | regulation of lipid storage | 15/2311 | 57/18723 | 3.13e-03 | 2.05e-02 | 15 |
| GO:0030522 | Colorectum | AD | intracellular receptor signaling pathway | 87/3918 | 265/18723 | 3.69e-06 | 1.03e-04 | 87 |
| GO:0010876 | Colorectum | AD | lipid localization | 120/3918 | 448/18723 | 1.59e-03 | 1.33e-02 | 120 |
| GO:00305223 | Colorectum | FAP | intracellular receptor signaling pathway | 67/2622 | 265/18723 | 6.84e-07 | 3.28e-05 | 67 |
| GO:00108762 | Colorectum | FAP | lipid localization | 85/2622 | 448/18723 | 1.92e-03 | 1.63e-02 | 85 |
| GO:00305224 | Colorectum | CRC | intracellular receptor signaling pathway | 61/2078 | 265/18723 | 2.00e-08 | 3.23e-06 | 61 |
| GO:00108763 | Colorectum | CRC | lipid localization | 68/2078 | 448/18723 | 4.60e-03 | 3.58e-02 | 68 |
| GO:0030522110 | Esophagus | ESCC | intracellular receptor signaling pathway | 170/8552 | 265/18723 | 8.58e-10 | 2.09e-08 | 170 |
| GO:0051235110 | Esophagus | ESCC | maintenance of location | 200/8552 | 327/18723 | 1.01e-08 | 2.02e-07 | 200 |
| GO:00454449 | Esophagus | ESCC | fat cell differentiation | 135/8552 | 229/18723 | 3.38e-05 | 2.78e-04 | 135 |
| GO:00199155 | Esophagus | ESCC | lipid storage | 58/8552 | 87/18723 | 6.15e-05 | 4.72e-04 | 58 |
| GO:00456007 | Esophagus | ESCC | positive regulation of fat cell differentiation | 46/8552 | 66/18723 | 6.72e-05 | 5.11e-04 | 46 |
| GO:00455984 | Esophagus | ESCC | regulation of fat cell differentiation | 79/8552 | 139/18723 | 5.23e-03 | 1.97e-02 | 79 |
| GO:00108836 | Esophagus | ESCC | regulation of lipid storage | 36/8552 | 57/18723 | 5.87e-03 | 2.17e-02 | 36 |
| GO:00305226 | Liver | NAFLD | intracellular receptor signaling pathway | 55/1882 | 265/18723 | 1.39e-07 | 1.03e-05 | 55 |
| Page: 1 2 |
| Pathway ID | Tissue | Disease Stage | Description | Gene Ratio | Bg Ratio | pvalue | p.adjust | qvalue | Count |
| Page: 1 |
Top |
Cell-cell communication analysis |
| Identification of potential cell-cell interactions between two cell types and their ligand-receptor pairs for different disease states |
| Ligand | Receptor | LRpair | Pathway | Tissue | Disease Stage |
| Page: 1 |
Top |
Single-cell gene regulatory network inference analysis |
| Find out the significant the regulons (TFs) and the target genes of each regulon across cell types for different disease states |
| TF | Cell Type | Tissue | Disease Stage | Target Gene | RSS | Regulon Activity |
| ∗The dot plots of a searched regulon are shown for all cell subpopulations in each disease state of each tissue based on the regulon specific score inferred using pySCENIC and by calculating the average expression. |
| Page: 1 |
Top |
Somatic mutation of malignant transformation related genes |
| Annotation of somatic variants for genes involved in malignant transformation |
| Hugo Symbol | Variant Class | Variant Classification | dbSNP RS | HGVSc | HGVSp | HGVSp Short | SWISSPROT | BIOTYPE | SIFT | PolyPhen | Tumor Sample Barcode | Tissue | Histology | Sex | Age | Stage | Therapy Types | Drugs | Outcome |
| ASXL2 | SNV | Missense_Mutation | c.221N>T | p.Ser74Leu | p.S74L | Q76L83 | protein_coding | deleterious(0) | probably_damaging(0.992) | TCGA-A2-A25A-01 | Breast | breast invasive carcinoma | Female | <65 | I/II | Unspecific | Cytoxan | SD | |
| ASXL2 | SNV | Missense_Mutation | rs374101562 | c.1246N>A | p.Ala416Thr | p.A416T | Q76L83 | protein_coding | deleterious(0.02) | probably_damaging(0.998) | TCGA-A7-A0DA-01 | Breast | breast invasive carcinoma | Female | <65 | I/II | Chemotherapy | adriamycin | SD |
| ASXL2 | SNV | Missense_Mutation | novel | c.1211N>T | p.Ala404Val | p.A404V | Q76L83 | protein_coding | deleterious(0) | probably_damaging(0.999) | TCGA-A7-A13E-01 | Breast | breast invasive carcinoma | Female | <65 | I/II | Targeted Molecular therapy | bevacizumab | PD |
| ASXL2 | SNV | Missense_Mutation | c.208N>A | p.Glu70Lys | p.E70K | Q76L83 | protein_coding | deleterious(0) | probably_damaging(0.998) | TCGA-AC-A23H-01 | Breast | breast invasive carcinoma | Female | >=65 | I/II | Unknown | Unknown | PD | |
| ASXL2 | SNV | Missense_Mutation | c.964N>C | p.Glu322Gln | p.E322Q | Q76L83 | protein_coding | deleterious(0) | probably_damaging(0.974) | TCGA-BH-A0DZ-01 | Breast | breast invasive carcinoma | Female | <65 | I/II | Chemotherapy | docetaxel | SD | |
| ASXL2 | SNV | Missense_Mutation | c.229N>G | p.Gln77Glu | p.Q77E | protein_coding | tolerated(0.22) | benign(0.444) | TCGA-BH-A0HP-01 | Breast | breast invasive carcinoma | Female | >=65 | III/IV | Chemotherapy | doxorubicin | SD | ||
| ASXL2 | SNV | Missense_Mutation | c.1333G>T | p.Gly445Cys | p.G445C | Q76L83 | protein_coding | deleterious_low_confidence(0.01) | possibly_damaging(0.694) | TCGA-BH-A18G-01 | Breast | breast invasive carcinoma | Female | >=65 | I/II | Unknown | Unknown | SD | |
| ASXL2 | SNV | Missense_Mutation | c.1195N>A | p.Asp399Asn | p.D399N | Q76L83 | protein_coding | deleterious(0) | probably_damaging(1) | TCGA-BH-A1F0-01 | Breast | breast invasive carcinoma | Female | >=65 | I/II | Unknown | Unknown | PD | |
| ASXL2 | SNV | Missense_Mutation | novel | c.1546N>C | p.Thr516Pro | p.T516P | Q76L83 | protein_coding | deleterious_low_confidence(0.01) | possibly_damaging(0.563) | TCGA-D8-A1JK-01 | Breast | breast invasive carcinoma | Female | >=65 | I/II | Unknown | Unknown | SD |
| ASXL2 | SNV | Missense_Mutation | c.41C>T | p.Pro14Leu | p.P14L | Q76L83 | protein_coding | deleterious(0) | probably_damaging(1) | TCGA-E2-A1L9-01 | Breast | breast invasive carcinoma | Female | <65 | I/II | Chemotherapy | cytoxan | SD |
| Page: 1 2 3 4 5 6 7 8 9 10 11 |
Top |
Related drugs of malignant transformation related genes |
| Identification of chemicals and drugs interact with genes involved in malignant transfromation |
| (DGIdb 4.0) |
| Entrez ID | Symbol | Category | Interaction Types | Drug Claim Name | Drug Name | PMIDs |
| Page: 1 |

Copyright 2023-Present -The University of Texas Health Science Center at Houston |