
|
|||||
|
 | |
| |
| |
| |
| |
| |
|
Gene: ASXL1 |
Gene summary for ASXL1 |
| Gene information | Species | Human | Gene symbol | ASXL1 | Gene ID | 171023 |
| Gene name | ASXL transcriptional regulator 1 | |
| Gene Alias | BOPS | |
| Cytomap | 20q11.21 | |
| Gene Type | protein-coding | GO ID | GO:0000902 | UniProtAcc | Q498B9 |
Top |
Malignant transformation analysis |
| Identification of the aberrant gene expression in precancerous and cancerous lesions by comparing the gene expression of stem-like cells in diseased tissues with normal stem cells |
| Entrez ID | Symbol | Replicates | Species | Organ | Tissue | Adj P-value | Log2FC | Malignancy |
| 171023 | ASXL1 | AEH-subject1 | Human | Endometrium | AEH | 4.92e-23 | 5.80e-01 | -0.3059 |
| 171023 | ASXL1 | AEH-subject2 | Human | Endometrium | AEH | 2.43e-08 | 4.08e-01 | -0.2525 |
| 171023 | ASXL1 | AEH-subject3 | Human | Endometrium | AEH | 6.68e-14 | 4.87e-01 | -0.2576 |
| 171023 | ASXL1 | AEH-subject4 | Human | Endometrium | AEH | 1.34e-15 | 6.00e-01 | -0.2657 |
| 171023 | ASXL1 | AEH-subject5 | Human | Endometrium | AEH | 5.99e-24 | 6.79e-01 | -0.2953 |
| 171023 | ASXL1 | EEC-subject1 | Human | Endometrium | EEC | 1.36e-23 | 6.42e-01 | -0.2682 |
| 171023 | ASXL1 | EEC-subject2 | Human | Endometrium | EEC | 3.60e-08 | 3.75e-01 | -0.2607 |
| 171023 | ASXL1 | EEC-subject3 | Human | Endometrium | EEC | 2.34e-06 | 2.60e-01 | -0.2525 |
| 171023 | ASXL1 | EEC-subject4 | Human | Endometrium | EEC | 4.94e-11 | 4.50e-01 | -0.2571 |
| 171023 | ASXL1 | EEC-subject5 | Human | Endometrium | EEC | 1.84e-04 | 3.21e-01 | -0.249 |
| 171023 | ASXL1 | GSM5276934 | Human | Endometrium | EEC | 1.51e-04 | 2.85e-01 | -0.0913 |
| 171023 | ASXL1 | GSM6177620_NYU_UCEC1_lib1_lib1 | Human | Endometrium | EEC | 2.03e-07 | 1.71e-02 | -0.1869 |
| 171023 | ASXL1 | GSM6177620_NYU_UCEC1_lib2_lib2 | Human | Endometrium | EEC | 1.38e-07 | -3.47e-02 | -0.1875 |
| 171023 | ASXL1 | GSM6177620_NYU_UCEC1_lib3_lib3 | Human | Endometrium | EEC | 1.16e-10 | 4.64e-03 | -0.1883 |
| 171023 | ASXL1 | GSM6177621_NYU_UCEC2_lib1_lib1 | Human | Endometrium | EEC | 1.20e-08 | 5.95e-02 | -0.1934 |
| 171023 | ASXL1 | GSM6177622_NYU_UCEC3_lib1_lib1 | Human | Endometrium | EEC | 5.84e-13 | -3.02e-02 | -0.1917 |
| 171023 | ASXL1 | GSM6177622_NYU_UCEC3_lib2_lib2 | Human | Endometrium | EEC | 1.34e-15 | -5.23e-02 | -0.1916 |
| 171023 | ASXL1 | GSM6177623_NYU_UCEC3_Vis | Human | Endometrium | EEC | 3.43e-05 | 2.74e-01 | -0.1269 |
| 171023 | ASXL1 | LZE4T | Human | Esophagus | ESCC | 1.81e-07 | 5.23e-01 | 0.0811 |
| 171023 | ASXL1 | LZE7T | Human | Esophagus | ESCC | 2.06e-13 | 5.85e-01 | 0.0667 |
| Page: 1 2 3 4 5 6 7 8 9 |
| Tissue | Expression Dynamics | Abbreviation |
| Endometrium |  | AEH: Atypical endometrial hyperplasia |
| EEC: Endometrioid Cancer | ||
| Esophagus |  | ESCC: Esophageal squamous cell carcinoma |
| HGIN: High-grade intraepithelial neoplasias | ||
| LGIN: Low-grade intraepithelial neoplasias | ||
| Liver |  | HCC: Hepatocellular carcinoma |
| NAFLD: Non-alcoholic fatty liver disease | ||
| Lung | 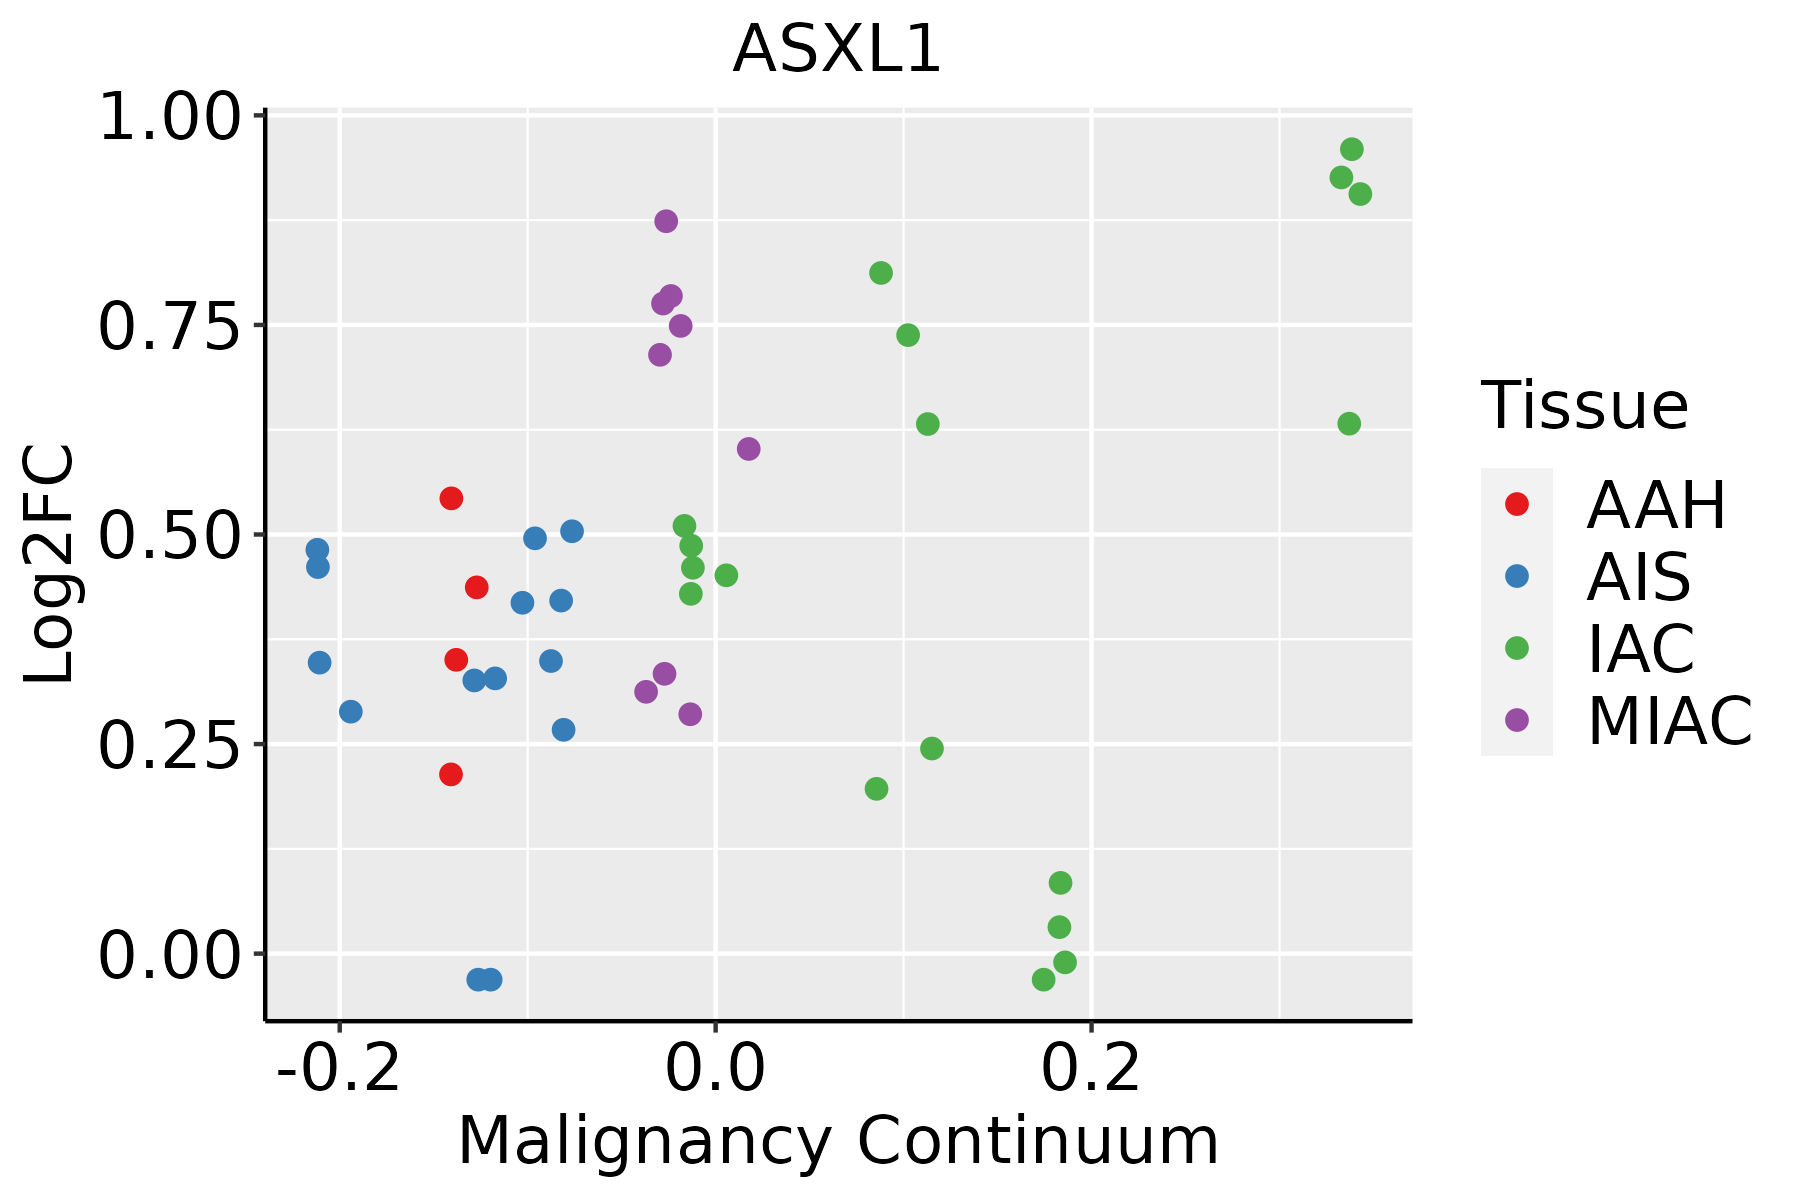 | AAH: Atypical adenomatous hyperplasia |
| AIS: Adenocarcinoma in situ | ||
| IAC: Invasive lung adenocarcinoma | ||
| MIA: Minimally invasive adenocarcinoma | ||
| Oral Cavity | 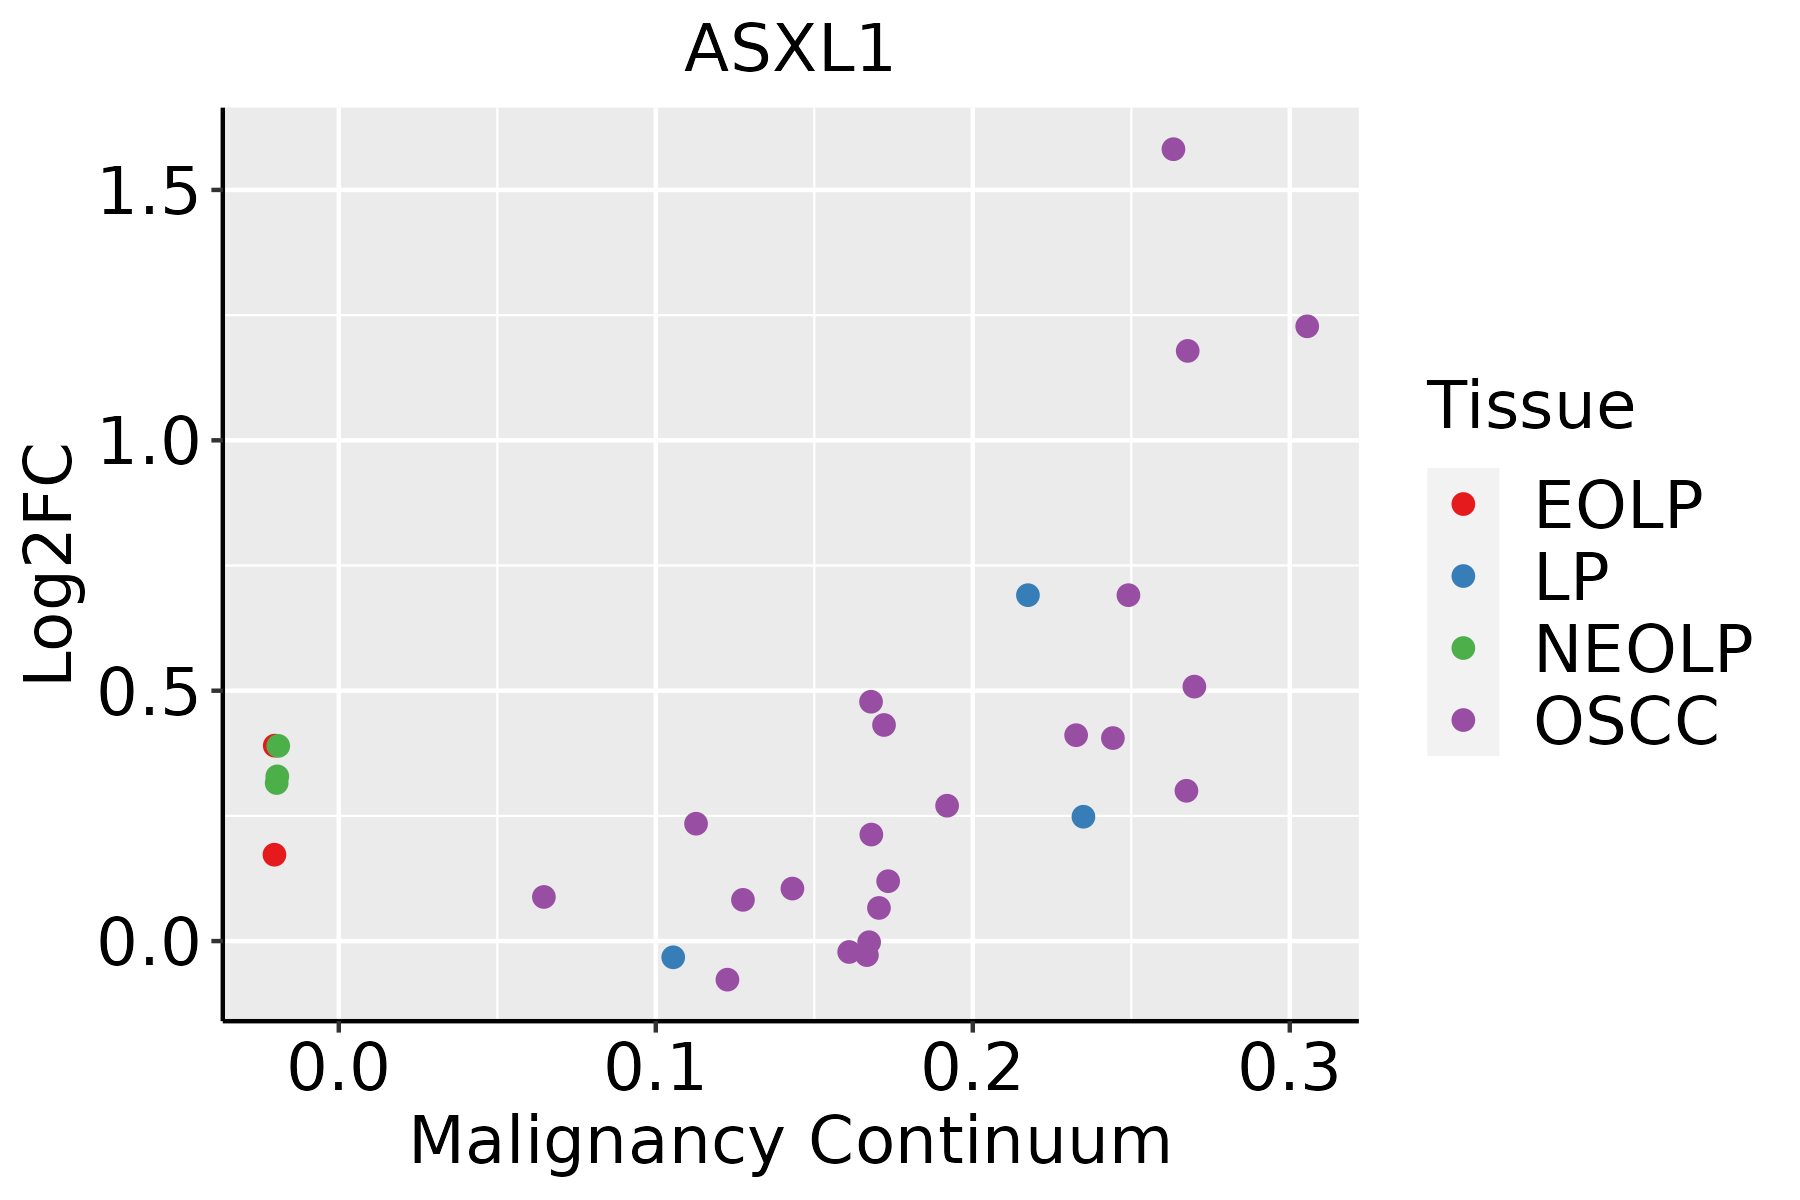 | EOLP: Erosive Oral lichen planus |
| LP: leukoplakia | ||
| NEOLP: Non-erosive oral lichen planus | ||
| OSCC: Oral squamous cell carcinoma | ||
| Prostate | 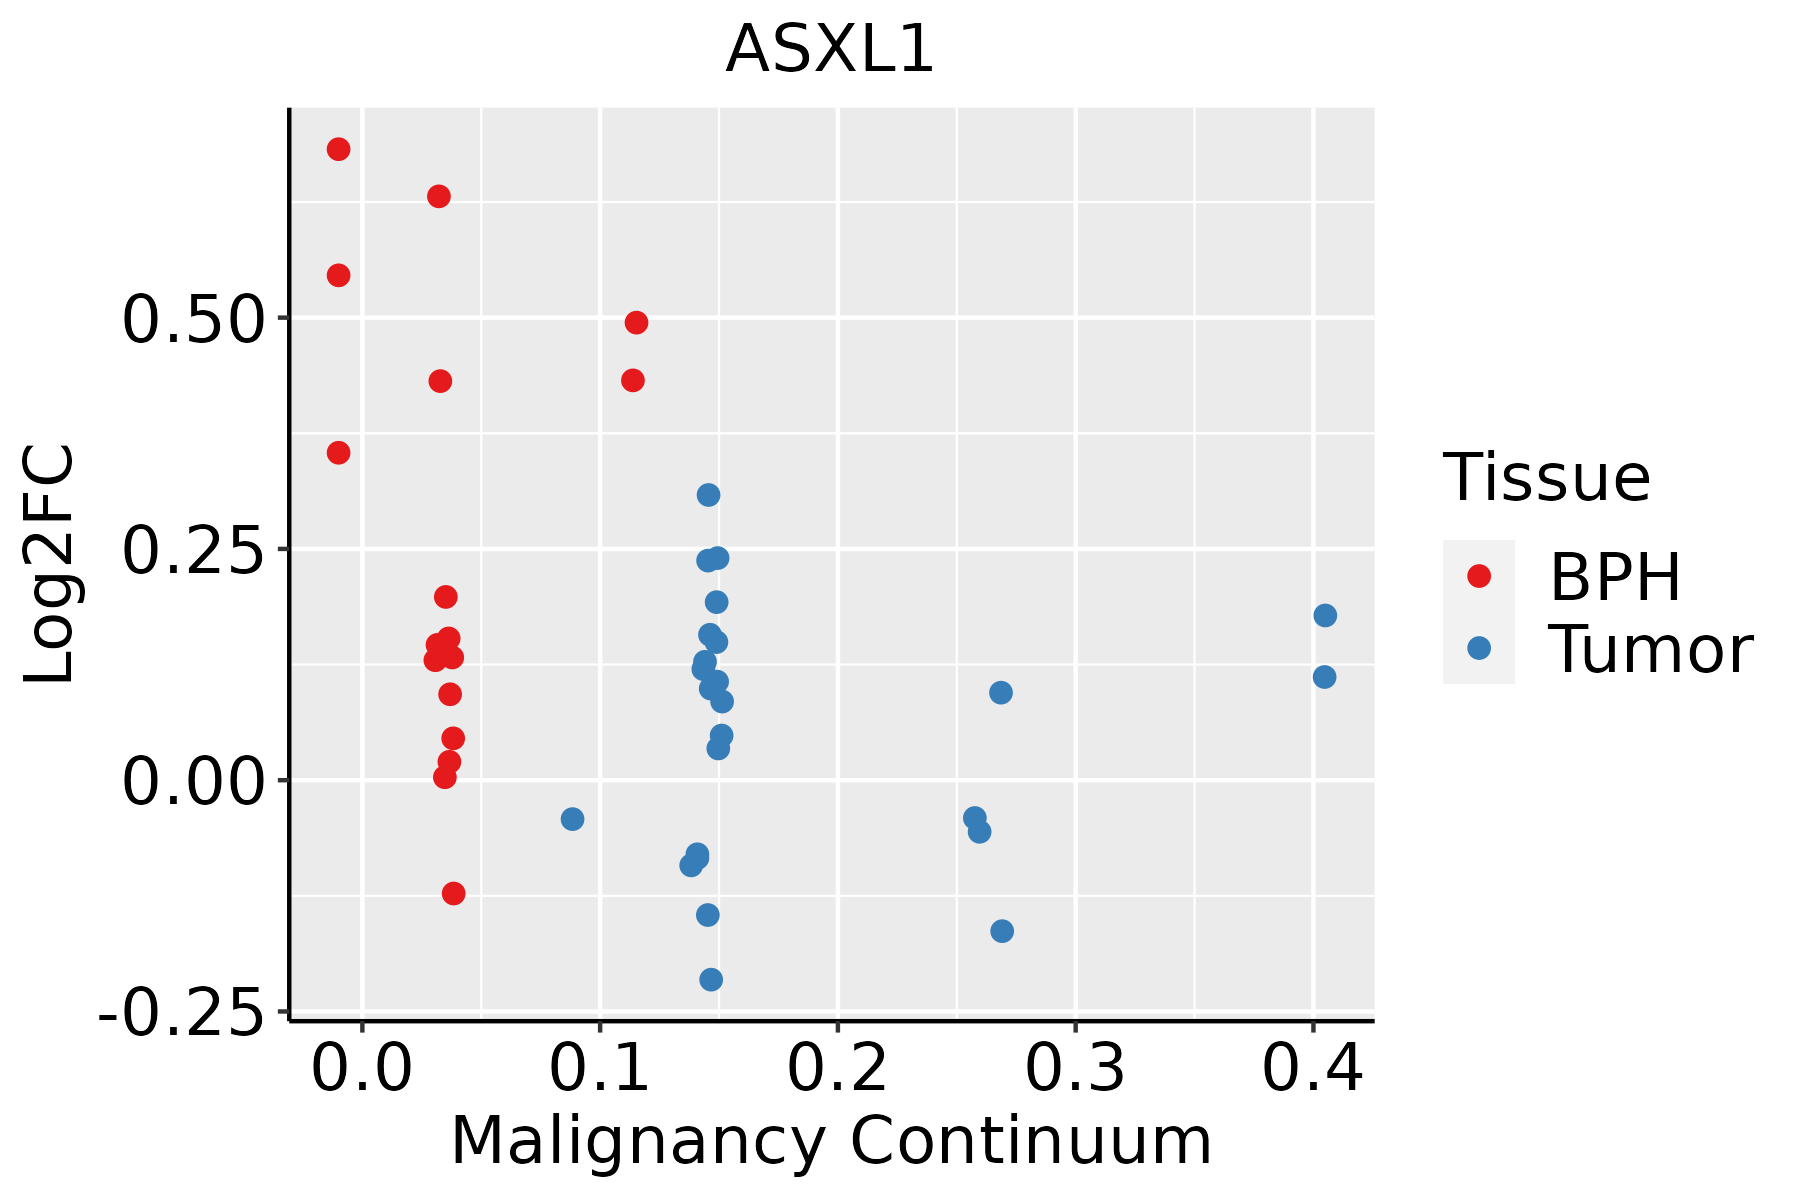 | BPH: Benign Prostatic Hyperplasia |
| Skin | 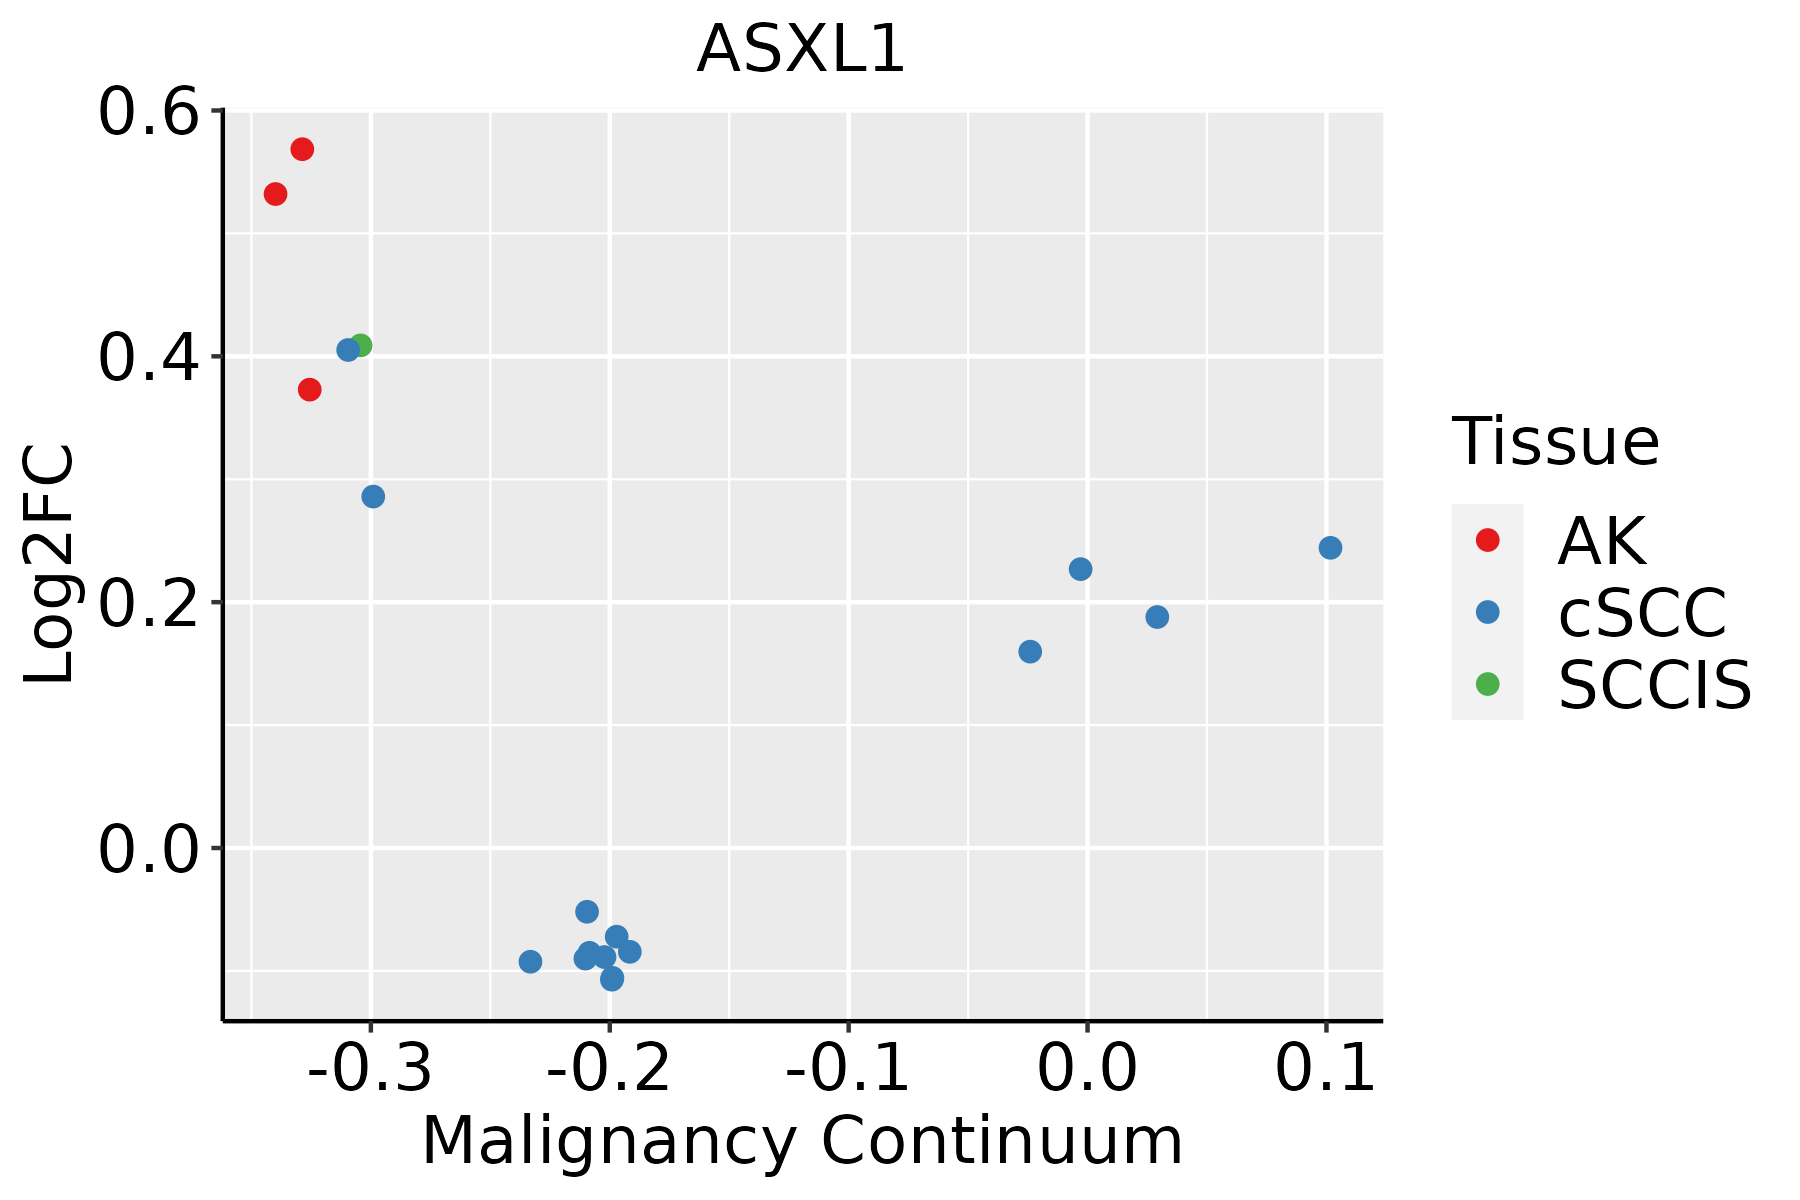 | AK: Actinic keratosis |
| cSCC: Cutaneous squamous cell carcinoma | ||
| SCCIS:squamous cell carcinoma in situ | ||
| Thyroid |  | ATC: Anaplastic thyroid cancer |
| HT: Hashimoto's thyroiditis | ||
| PTC: Papillary thyroid cancer |
| ∗log2FC in expression of this searched gene in stem-like cells from each diseased tissue sample relative to stem-like cells in normal samples in each tissue plotted against the malignancy continuum. Samples are colored based on if they are from different disease stage. |
Top |
Malignant transformation related pathway analysis |
| Find out the enriched GO biological processes and KEGG pathways involved in transition from healthy to precancer to cancer |
| Tissue | Disease Stage | Enriched GO biological Processes |
| Colorectum | AD |  |
| Colorectum | SER |  |
| Colorectum | MSS |  |
| Colorectum | MSI-H |  |
| Colorectum | FAP |  |
| ∗Top 15 enriched GO BP terms are showed in the bar plot of each disease state in each tissue. Each row represents a significant GO biological process which is colored according to the -log10(p.adjust). |
| Page: 1 2 3 4 5 6 7 8 9 |
| GO ID | Tissue | Disease Stage | Description | Gene Ratio | Bg Ratio | pvalue | p.adjust | Count |
| GO:003052210 | Endometrium | AEH | intracellular receptor signaling pathway | 60/2100 | 265/18723 | 7.16e-08 | 3.77e-06 | 60 |
| GO:004873216 | Endometrium | AEH | gland development | 83/2100 | 436/18723 | 8.62e-07 | 3.11e-05 | 83 |
| GO:00016556 | Endometrium | AEH | urogenital system development | 67/2100 | 338/18723 | 2.30e-06 | 6.76e-05 | 67 |
| GO:00720015 | Endometrium | AEH | renal system development | 61/2100 | 302/18723 | 3.43e-06 | 9.24e-05 | 61 |
| GO:00018224 | Endometrium | AEH | kidney development | 57/2100 | 293/18723 | 2.25e-05 | 4.35e-04 | 57 |
| GO:004887216 | Endometrium | AEH | homeostasis of number of cells | 53/2100 | 272/18723 | 4.10e-05 | 6.99e-04 | 53 |
| GO:00609932 | Endometrium | AEH | kidney morphogenesis | 24/2100 | 93/18723 | 6.73e-05 | 1.04e-03 | 24 |
| GO:005123510 | Endometrium | AEH | maintenance of location | 60/2100 | 327/18723 | 8.19e-05 | 1.22e-03 | 60 |
| GO:000206415 | Endometrium | AEH | epithelial cell development | 43/2100 | 220/18723 | 1.94e-04 | 2.48e-03 | 43 |
| GO:00720736 | Endometrium | AEH | kidney epithelium development | 29/2100 | 136/18723 | 4.71e-04 | 4.91e-03 | 29 |
| GO:00030072 | Endometrium | AEH | heart morphogenesis | 45/2100 | 246/18723 | 6.41e-04 | 6.23e-03 | 45 |
| GO:00720093 | Endometrium | AEH | nephron epithelium development | 24/2100 | 109/18723 | 8.69e-04 | 8.03e-03 | 24 |
| GO:00720064 | Endometrium | AEH | nephron development | 29/2100 | 142/18723 | 9.80e-04 | 8.89e-03 | 29 |
| GO:00610052 | Endometrium | AEH | cell differentiation involved in kidney development | 15/2100 | 57/18723 | 1.20e-03 | 1.04e-02 | 15 |
| GO:00483842 | Endometrium | AEH | retinoic acid receptor signaling pathway | 10/2100 | 31/18723 | 1.48e-03 | 1.23e-02 | 10 |
| GO:00358504 | Endometrium | AEH | epithelial cell differentiation involved in kidney development | 13/2100 | 47/18723 | 1.53e-03 | 1.26e-02 | 13 |
| GO:00605414 | Endometrium | AEH | respiratory system development | 37/2100 | 203/18723 | 1.97e-03 | 1.54e-02 | 37 |
| GO:00303246 | Endometrium | AEH | lung development | 33/2100 | 177/18723 | 2.30e-03 | 1.74e-02 | 33 |
| GO:00303236 | Endometrium | AEH | respiratory tube development | 33/2100 | 181/18723 | 3.33e-03 | 2.32e-02 | 33 |
| GO:00483852 | Endometrium | AEH | regulation of retinoic acid receptor signaling pathway | 6/2100 | 16/18723 | 5.84e-03 | 3.55e-02 | 6 |
| Page: 1 2 3 4 5 6 7 8 9 10 11 12 13 14 15 16 17 18 19 20 |
| Pathway ID | Tissue | Disease Stage | Description | Gene Ratio | Bg Ratio | pvalue | p.adjust | qvalue | Count |
| Page: 1 |
Top |
Cell-cell communication analysis |
| Identification of potential cell-cell interactions between two cell types and their ligand-receptor pairs for different disease states |
| Ligand | Receptor | LRpair | Pathway | Tissue | Disease Stage |
| Page: 1 |
Top |
Single-cell gene regulatory network inference analysis |
| Find out the significant the regulons (TFs) and the target genes of each regulon across cell types for different disease states |
| TF | Cell Type | Tissue | Disease Stage | Target Gene | RSS | Regulon Activity |
| ∗The dot plots of a searched regulon are shown for all cell subpopulations in each disease state of each tissue based on the regulon specific score inferred using pySCENIC and by calculating the average expression. |
| Page: 1 |
Top |
Somatic mutation of malignant transformation related genes |
| Annotation of somatic variants for genes involved in malignant transformation |
| Hugo Symbol | Variant Class | Variant Classification | dbSNP RS | HGVSc | HGVSp | HGVSp Short | SWISSPROT | BIOTYPE | SIFT | PolyPhen | Tumor Sample Barcode | Tissue | Histology | Sex | Age | Stage | Therapy Types | Drugs | Outcome |
| ASXL1 | SNV | Missense_Mutation | c.3992N>A | p.Pro1331Gln | p.P1331Q | Q8IXJ9 | protein_coding | deleterious_low_confidence(0) | possibly_damaging(0.887) | TCGA-A2-A04W-01 | Breast | breast invasive carcinoma | Female | <65 | I/II | Chemotherapy | cytoxan | SD | |
| ASXL1 | SNV | Missense_Mutation | c.124N>A | p.Gly42Arg | p.G42R | Q8IXJ9 | protein_coding | deleterious(0.03) | probably_damaging(0.998) | TCGA-B6-A40B-01 | Breast | breast invasive carcinoma | Female | >=65 | I/II | Unknown | Unknown | SD | |
| ASXL1 | SNV | Missense_Mutation | novel | c.2068N>C | p.Asp690His | p.D690H | Q8IXJ9 | protein_coding | deleterious(0) | probably_damaging(0.988) | TCGA-BH-A0B9-01 | Breast | breast invasive carcinoma | Female | <65 | I/II | Chemotherapy | cyclophosphamide | SD |
| ASXL1 | SNV | Missense_Mutation | c.2587N>C | p.Asp863His | p.D863H | Q8IXJ9 | protein_coding | deleterious_low_confidence(0.01) | possibly_damaging(0.897) | TCGA-BH-A0B9-01 | Breast | breast invasive carcinoma | Female | <65 | I/II | Chemotherapy | cyclophosphamide | SD | |
| ASXL1 | SNV | Missense_Mutation | c.3016N>A | p.Glu1006Lys | p.E1006K | Q8IXJ9 | protein_coding | deleterious(0) | probably_damaging(0.952) | TCGA-BH-A0B9-01 | Breast | breast invasive carcinoma | Female | <65 | I/II | Chemotherapy | cyclophosphamide | SD | |
| ASXL1 | SNV | Missense_Mutation | c.3382N>T | p.Asp1128Tyr | p.D1128Y | Q8IXJ9 | protein_coding | deleterious(0.01) | possibly_damaging(0.69) | TCGA-BH-A0B9-01 | Breast | breast invasive carcinoma | Female | <65 | I/II | Chemotherapy | cyclophosphamide | SD | |
| ASXL1 | SNV | Missense_Mutation | c.3593N>T | p.Gly1198Val | p.G1198V | Q8IXJ9 | protein_coding | deleterious(0) | probably_damaging(0.947) | TCGA-BH-A0B9-01 | Breast | breast invasive carcinoma | Female | <65 | I/II | Chemotherapy | cyclophosphamide | SD | |
| ASXL1 | SNV | Missense_Mutation | c.3047N>T | p.Ala1016Val | p.A1016V | Q8IXJ9 | protein_coding | tolerated(0.39) | benign(0.073) | TCGA-BH-A0HF-01 | Breast | breast invasive carcinoma | Female | >=65 | I/II | Hormone Therapy | arimidex | SD | |
| ASXL1 | SNV | Missense_Mutation | c.3557N>T | p.Thr1186Ile | p.T1186I | Q8IXJ9 | protein_coding | deleterious(0.01) | benign(0.251) | TCGA-BH-A0HF-01 | Breast | breast invasive carcinoma | Female | >=65 | I/II | Hormone Therapy | arimidex | SD | |
| ASXL1 | SNV | Missense_Mutation | c.2024N>T | p.Pro675Leu | p.P675L | Q8IXJ9 | protein_coding | tolerated_low_confidence(0.16) | benign(0.009) | TCGA-D8-A1JK-01 | Breast | breast invasive carcinoma | Female | >=65 | I/II | Unknown | Unknown | SD |
| Page: 1 2 3 4 5 6 7 8 9 10 11 12 13 14 15 16 17 18 |
Top |
Related drugs of malignant transformation related genes |
| Identification of chemicals and drugs interact with genes involved in malignant transfromation |
| (DGIdb 4.0) |
| Entrez ID | Symbol | Category | Interaction Types | Drug Claim Name | Drug Name | PMIDs |
| 171023 | ASXL1 | CLINICALLY ACTIONABLE, NUCLEAR HORMONE RECEPTOR | N/A | 24220272,26849014,20880116,21714648,23690417 | ||
| 171023 | ASXL1 | CLINICALLY ACTIONABLE, NUCLEAR HORMONE RECEPTOR | Azacitidine | AZACITIDINE | 25224413 | |
| 171023 | ASXL1 | CLINICALLY ACTIONABLE, NUCLEAR HORMONE RECEPTOR | Decitabine | DECITABINE | 25224413 |
| Page: 1 |

Copyright 2023-Present -The University of Texas Health Science Center at Houston |