
|
|||||
|
 | |
| |
| |
| |
| |
| |
|
Gene: ASTN2 |
Gene summary for ASTN2 |
| Gene information | Species | Human | Gene symbol | ASTN2 | Gene ID | 23245 |
| Gene name | astrotactin 2 | |
| Gene Alias | bA67K19.1 | |
| Cytomap | 9q33.1 | |
| Gene Type | protein-coding | GO ID | GO:0001736 | UniProtAcc | B7ZKP4 |
Top |
Malignant transformation analysis |
| Identification of the aberrant gene expression in precancerous and cancerous lesions by comparing the gene expression of stem-like cells in diseased tissues with normal stem cells |
| Entrez ID | Symbol | Replicates | Species | Organ | Tissue | Adj P-value | Log2FC | Malignancy |
| 23245 | ASTN2 | HTA11_3410_2000001011 | Human | Colorectum | AD | 3.45e-50 | 1.04e+00 | 0.0155 |
| 23245 | ASTN2 | HTA11_2487_2000001011 | Human | Colorectum | SER | 6.90e-23 | 1.11e+00 | -0.1808 |
| 23245 | ASTN2 | HTA11_2951_2000001011 | Human | Colorectum | AD | 2.80e-17 | 1.36e+00 | 0.0216 |
| 23245 | ASTN2 | HTA11_1938_2000001011 | Human | Colorectum | AD | 5.74e-30 | 1.10e+00 | -0.0811 |
| 23245 | ASTN2 | HTA11_78_2000001011 | Human | Colorectum | AD | 3.04e-15 | 6.17e-01 | -0.1088 |
| 23245 | ASTN2 | HTA11_347_2000001011 | Human | Colorectum | AD | 2.01e-51 | 1.38e+00 | -0.1954 |
| 23245 | ASTN2 | HTA11_411_2000001011 | Human | Colorectum | SER | 3.94e-18 | 1.69e+00 | -0.2602 |
| 23245 | ASTN2 | HTA11_3361_2000001011 | Human | Colorectum | AD | 6.45e-36 | 1.60e+00 | -0.1207 |
| 23245 | ASTN2 | HTA11_83_2000001011 | Human | Colorectum | SER | 6.84e-17 | 8.98e-01 | -0.1526 |
| 23245 | ASTN2 | HTA11_696_2000001011 | Human | Colorectum | AD | 3.47e-53 | 1.26e+00 | -0.1464 |
| 23245 | ASTN2 | HTA11_866_2000001011 | Human | Colorectum | AD | 1.52e-38 | 1.03e+00 | -0.1001 |
| 23245 | ASTN2 | HTA11_1391_2000001011 | Human | Colorectum | AD | 1.20e-44 | 1.53e+00 | -0.059 |
| 23245 | ASTN2 | HTA11_2992_2000001011 | Human | Colorectum | SER | 1.70e-17 | 1.41e+00 | -0.1706 |
| 23245 | ASTN2 | HTA11_5212_2000001011 | Human | Colorectum | AD | 1.16e-05 | 6.58e-01 | -0.2061 |
| 23245 | ASTN2 | HTA11_5216_2000001011 | Human | Colorectum | SER | 3.05e-18 | 1.50e+00 | -0.1462 |
| 23245 | ASTN2 | HTA11_546_2000001011 | Human | Colorectum | AD | 2.06e-24 | 1.22e+00 | -0.0842 |
| 23245 | ASTN2 | HTA11_866_3004761011 | Human | Colorectum | AD | 4.15e-32 | 8.68e-01 | 0.096 |
| 23245 | ASTN2 | HTA11_4255_2000001011 | Human | Colorectum | SER | 1.09e-09 | 9.85e-01 | 0.0446 |
| 23245 | ASTN2 | HTA11_9408_2000001011 | Human | Colorectum | AD | 8.70e-08 | 1.01e+00 | 0.0451 |
| 23245 | ASTN2 | HTA11_8622_2000001021 | Human | Colorectum | SER | 6.56e-04 | 5.97e-01 | 0.0528 |
| Page: 1 2 3 |
| Tissue | Expression Dynamics | Abbreviation |
| Colorectum (GSE201348) | 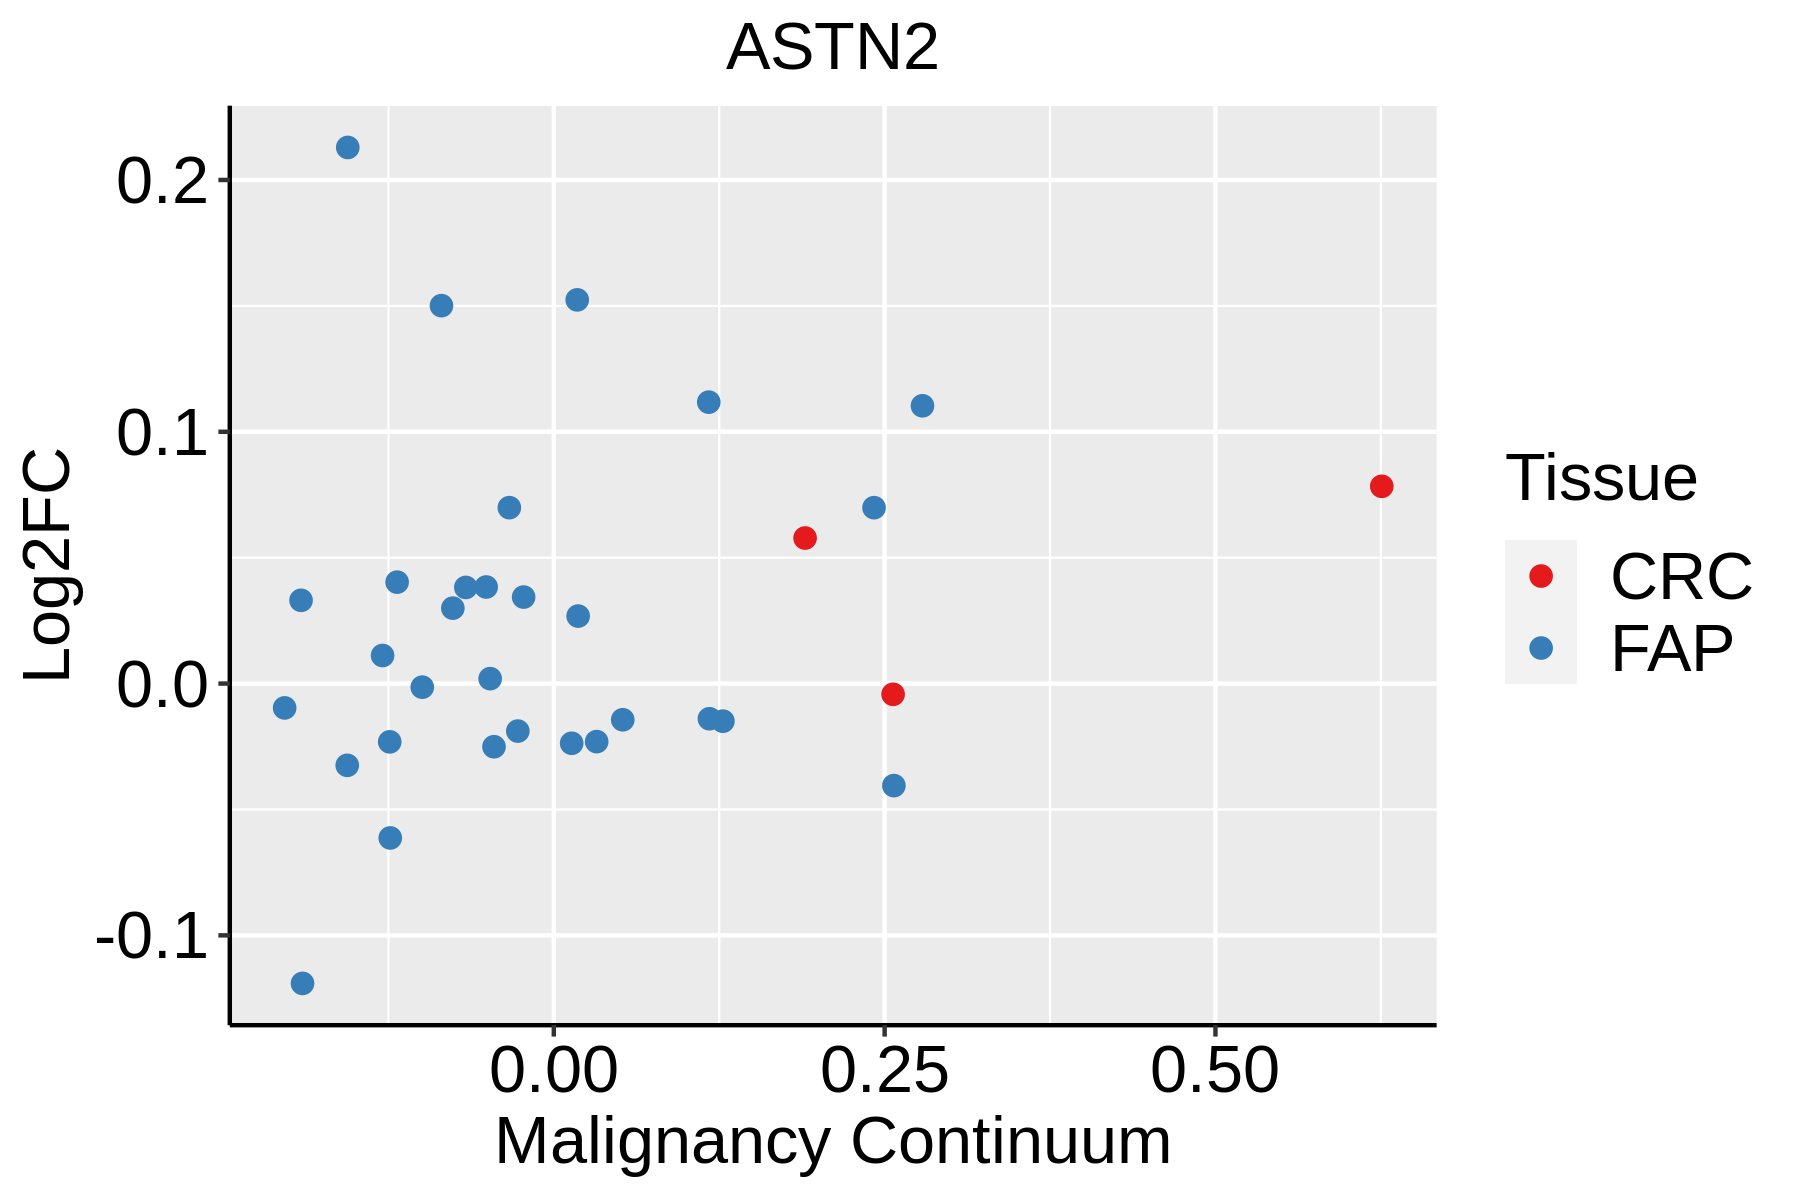 | FAP: Familial adenomatous polyposis |
| CRC: Colorectal cancer | ||
| Colorectum (HTA11) | 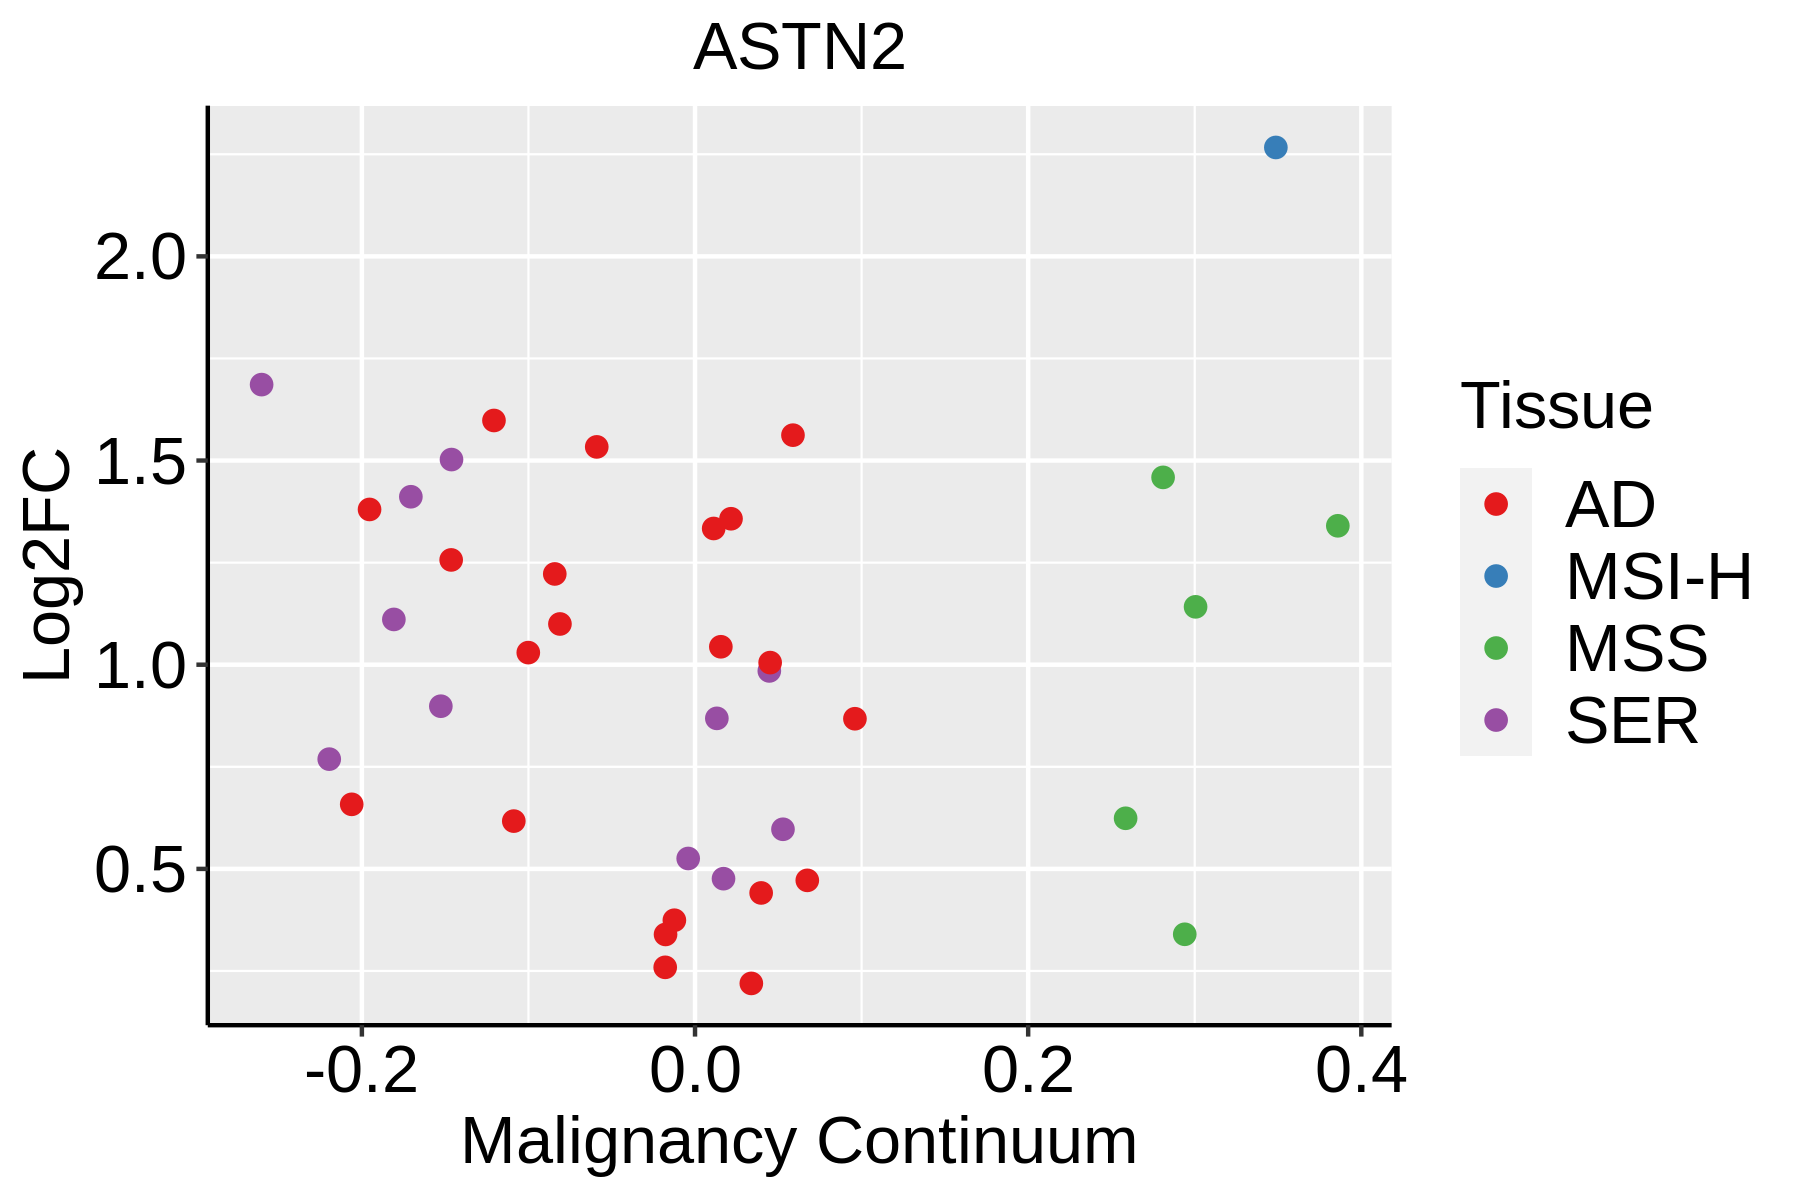 | AD: Adenomas |
| SER: Sessile serrated lesions | ||
| MSI-H: Microsatellite-high colorectal cancer | ||
| MSS: Microsatellite stable colorectal cancer | ||
| Liver | 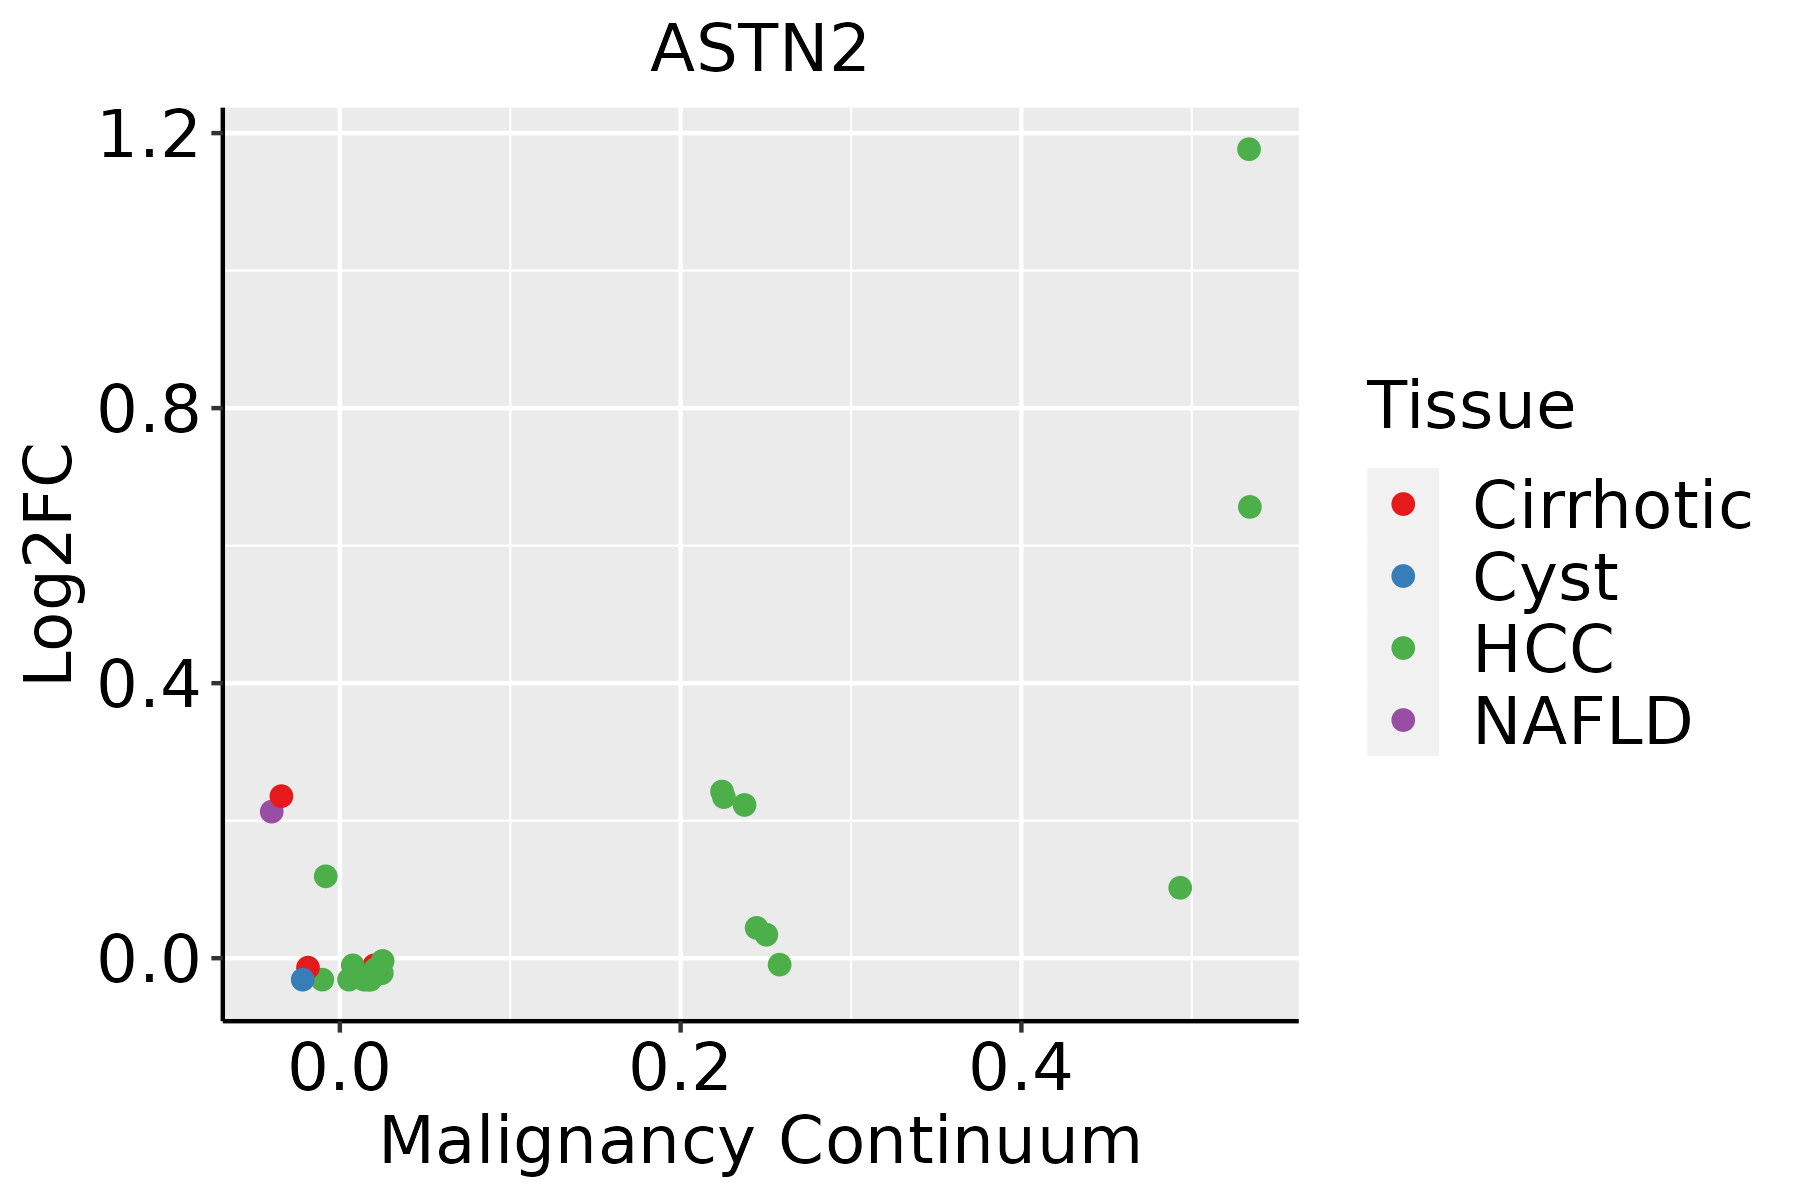 | HCC: Hepatocellular carcinoma |
| NAFLD: Non-alcoholic fatty liver disease | ||
| Prostate |  | BPH: Benign Prostatic Hyperplasia |
| ∗log2FC in expression of this searched gene in stem-like cells from each diseased tissue sample relative to stem-like cells in normal samples in each tissue plotted against the malignancy continuum. Samples are colored based on if they are from different disease stage. |
Top |
Malignant transformation related pathway analysis |
| Find out the enriched GO biological processes and KEGG pathways involved in transition from healthy to precancer to cancer |
| Tissue | Disease Stage | Enriched GO biological Processes |
| Colorectum | AD |  |
| Colorectum | SER |  |
| Colorectum | MSS |  |
| Colorectum | MSI-H |  |
| Colorectum | FAP |  |
| ∗Top 15 enriched GO BP terms are showed in the bar plot of each disease state in each tissue. Each row represents a significant GO biological process which is colored according to the -log10(p.adjust). |
| Page: 1 2 3 4 5 6 7 8 9 |
| GO ID | Tissue | Disease Stage | Description | Gene Ratio | Bg Ratio | pvalue | p.adjust | Count |
| GO:1903828 | Colorectum | AD | negative regulation of cellular protein localization | 39/3918 | 117/18723 | 1.18e-03 | 1.06e-02 | 39 |
| GO:0001738 | Colorectum | AD | morphogenesis of a polarized epithelium | 31/3918 | 94/18723 | 4.30e-03 | 2.95e-02 | 31 |
| GO:0034394 | Colorectum | AD | protein localization to cell surface | 24/3918 | 68/18723 | 4.33e-03 | 2.97e-02 | 24 |
| GO:2000009 | Colorectum | AD | negative regulation of protein localization to cell surface | 7/3918 | 12/18723 | 5.09e-03 | 3.38e-02 | 7 |
| GO:19038281 | Colorectum | SER | negative regulation of cellular protein localization | 30/2897 | 117/18723 | 2.96e-03 | 2.62e-02 | 30 |
| GO:20000091 | Colorectum | SER | negative regulation of protein localization to cell surface | 6/2897 | 12/18723 | 5.42e-03 | 4.03e-02 | 6 |
| GO:19038282 | Colorectum | MSS | negative regulation of cellular protein localization | 36/3467 | 117/18723 | 9.19e-04 | 9.34e-03 | 36 |
| GO:20000092 | Colorectum | MSS | negative regulation of protein localization to cell surface | 7/3467 | 12/18723 | 2.45e-03 | 1.97e-02 | 7 |
| GO:00343941 | Colorectum | MSS | protein localization to cell surface | 22/3467 | 68/18723 | 4.37e-03 | 3.10e-02 | 22 |
| GO:2000008 | Colorectum | MSS | regulation of protein localization to cell surface | 15/3467 | 41/18723 | 4.88e-03 | 3.40e-02 | 15 |
| GO:190382811 | Liver | HCC | negative regulation of cellular protein localization | 71/7958 | 117/18723 | 5.44e-05 | 5.12e-04 | 71 |
| GO:19038287 | Prostate | BPH | negative regulation of cellular protein localization | 36/3107 | 117/18723 | 1.04e-04 | 9.58e-04 | 36 |
| GO:00017386 | Prostate | BPH | morphogenesis of a polarized epithelium | 25/3107 | 94/18723 | 9.36e-03 | 3.98e-02 | 25 |
| GO:190382812 | Prostate | Tumor | negative regulation of cellular protein localization | 36/3246 | 117/18723 | 2.55e-04 | 2.14e-03 | 36 |
| Page: 1 |
| Pathway ID | Tissue | Disease Stage | Description | Gene Ratio | Bg Ratio | pvalue | p.adjust | qvalue | Count |
| Page: 1 |
Top |
Cell-cell communication analysis |
| Identification of potential cell-cell interactions between two cell types and their ligand-receptor pairs for different disease states |
| Ligand | Receptor | LRpair | Pathway | Tissue | Disease Stage |
| Page: 1 |
Top |
Single-cell gene regulatory network inference analysis |
| Find out the significant the regulons (TFs) and the target genes of each regulon across cell types for different disease states |
| TF | Cell Type | Tissue | Disease Stage | Target Gene | RSS | Regulon Activity |
| ∗The dot plots of a searched regulon are shown for all cell subpopulations in each disease state of each tissue based on the regulon specific score inferred using pySCENIC and by calculating the average expression. |
| Page: 1 |
Top |
Somatic mutation of malignant transformation related genes |
| Annotation of somatic variants for genes involved in malignant transformation |
| Hugo Symbol | Variant Class | Variant Classification | dbSNP RS | HGVSc | HGVSp | HGVSp Short | SWISSPROT | BIOTYPE | SIFT | PolyPhen | Tumor Sample Barcode | Tissue | Histology | Sex | Age | Stage | Therapy Types | Drugs | Outcome |
| ASTN2 | SNV | Missense_Mutation | novel | c.772N>A | p.Val258Met | p.V258M | O75129 | protein_coding | deleterious_low_confidence(0) | probably_damaging(0.997) | TCGA-A8-A06X-01 | Breast | breast invasive carcinoma | Female | >=65 | I/II | Unknown | Unknown | SD |
| ASTN2 | SNV | Missense_Mutation | c.874N>A | p.Asp292Asn | p.D292N | O75129 | protein_coding | tolerated_low_confidence(0.17) | possibly_damaging(0.794) | TCGA-AC-A23H-01 | Breast | breast invasive carcinoma | Female | >=65 | I/II | Unknown | Unknown | PD | |
| ASTN2 | SNV | Missense_Mutation | c.1426N>A | p.Asp476Asn | p.D476N | O75129 | protein_coding | deleterious(0) | possibly_damaging(0.842) | TCGA-AC-A2FE-01 | Breast | breast invasive carcinoma | Female | <65 | III/IV | Chemotherapy | adriamycin | PD | |
| ASTN2 | SNV | Missense_Mutation | c.2281N>A | p.Asp761Asn | p.D761N | O75129 | protein_coding | deleterious(0.01) | probably_damaging(0.998) | TCGA-BH-A0EE-01 | Breast | breast invasive carcinoma | Female | >=65 | I/II | Chemotherapy | docetaxel | SD | |
| ASTN2 | SNV | Missense_Mutation | c.1667N>G | p.Glu556Gly | p.E556G | O75129 | protein_coding | deleterious(0.02) | probably_damaging(0.997) | TCGA-BH-A18G-01 | Breast | breast invasive carcinoma | Female | >=65 | I/II | Unknown | Unknown | SD | |
| ASTN2 | SNV | Missense_Mutation | novel | c.1328C>A | p.Pro443Gln | p.P443Q | O75129 | protein_coding | deleterious(0) | probably_damaging(1) | TCGA-D8-A73U-01 | Breast | breast invasive carcinoma | Female | >=65 | I/II | Hormone Therapy | tamoxiphen | SD |
| ASTN2 | SNV | Missense_Mutation | c.1765N>C | p.Glu589Gln | p.E589Q | O75129 | protein_coding | deleterious(0.01) | possibly_damaging(0.6) | TCGA-EW-A1J5-01 | Breast | breast invasive carcinoma | Female | <65 | I/II | Chemotherapy | adriamycin | SD | |
| ASTN2 | SNV | Missense_Mutation | c.2664N>C | p.Glu888Asp | p.E888D | O75129 | protein_coding | tolerated_low_confidence(0.13) | benign(0.007) | TCGA-GM-A2DH-01 | Breast | breast invasive carcinoma | Female | <65 | I/II | Chemotherapy | taxol | CR | |
| ASTN2 | SNV | Missense_Mutation | novel | c.3496N>C | p.Glu1166Gln | p.E1166Q | O75129 | protein_coding | deleterious(0.01) | probably_damaging(0.994) | TCGA-OL-A5DA-01 | Breast | breast invasive carcinoma | Female | <65 | I/II | Unknown | Unknown | SD |
| ASTN2 | insertion | Frame_Shift_Ins | novel | c.770_771insCTACCTTTCCCAGCTTCTAA | p.Val258TyrfsTer68 | p.V258Yfs*68 | O75129 | protein_coding | TCGA-A8-A06X-01 | Breast | breast invasive carcinoma | Female | >=65 | I/II | Unknown | Unknown | SD |
| Page: 1 2 3 4 5 6 7 8 9 10 11 12 13 14 15 16 17 18 19 20 21 22 23 24 |
Top |
Related drugs of malignant transformation related genes |
| Identification of chemicals and drugs interact with genes involved in malignant transfromation |
| (DGIdb 4.0) |
| Entrez ID | Symbol | Category | Interaction Types | Drug Claim Name | Drug Name | PMIDs |
| Page: 1 |

Copyright 2023-Present -The University of Texas Health Science Center at Houston |