
|
|||||
|
 | |
| |
| |
| |
| |
| |
|
Gene: ASTE1 |
Gene summary for ASTE1 |
| Gene information | Species | Human | Gene symbol | ASTE1 | Gene ID | 28990 |
| Gene name | asteroid homolog 1 | |
| Gene Alias | HT001 | |
| Cytomap | 3q22.1 | |
| Gene Type | protein-coding | GO ID | GO:0006139 | UniProtAcc | D6RG30 |
Top |
Malignant transformation analysis |
| Identification of the aberrant gene expression in precancerous and cancerous lesions by comparing the gene expression of stem-like cells in diseased tissues with normal stem cells |
| Entrez ID | Symbol | Replicates | Species | Organ | Tissue | Adj P-value | Log2FC | Malignancy |
| 28990 | ASTE1 | LZE4T | Human | Esophagus | ESCC | 1.20e-04 | 1.54e-01 | 0.0811 |
| 28990 | ASTE1 | LZE24T | Human | Esophagus | ESCC | 1.28e-07 | 1.90e-01 | 0.0596 |
| 28990 | ASTE1 | P2T-E | Human | Esophagus | ESCC | 1.61e-32 | 5.06e-01 | 0.1177 |
| 28990 | ASTE1 | P4T-E | Human | Esophagus | ESCC | 6.14e-11 | 2.39e-01 | 0.1323 |
| 28990 | ASTE1 | P5T-E | Human | Esophagus | ESCC | 2.02e-06 | 1.54e-01 | 0.1327 |
| 28990 | ASTE1 | P8T-E | Human | Esophagus | ESCC | 3.89e-12 | 2.17e-01 | 0.0889 |
| 28990 | ASTE1 | P10T-E | Human | Esophagus | ESCC | 1.53e-19 | 3.12e-01 | 0.116 |
| 28990 | ASTE1 | P11T-E | Human | Esophagus | ESCC | 1.72e-04 | 1.69e-01 | 0.1426 |
| 28990 | ASTE1 | P12T-E | Human | Esophagus | ESCC | 1.47e-14 | 2.61e-01 | 0.1122 |
| 28990 | ASTE1 | P15T-E | Human | Esophagus | ESCC | 5.19e-07 | 1.66e-01 | 0.1149 |
| 28990 | ASTE1 | P16T-E | Human | Esophagus | ESCC | 6.56e-15 | 2.12e-01 | 0.1153 |
| 28990 | ASTE1 | P17T-E | Human | Esophagus | ESCC | 1.49e-02 | 1.49e-01 | 0.1278 |
| 28990 | ASTE1 | P20T-E | Human | Esophagus | ESCC | 4.80e-17 | 3.44e-01 | 0.1124 |
| 28990 | ASTE1 | P21T-E | Human | Esophagus | ESCC | 1.96e-05 | 1.40e-01 | 0.1617 |
| 28990 | ASTE1 | P22T-E | Human | Esophagus | ESCC | 4.40e-09 | 1.89e-01 | 0.1236 |
| 28990 | ASTE1 | P23T-E | Human | Esophagus | ESCC | 2.89e-02 | 1.25e-01 | 0.108 |
| 28990 | ASTE1 | P24T-E | Human | Esophagus | ESCC | 1.78e-03 | 9.39e-02 | 0.1287 |
| 28990 | ASTE1 | P26T-E | Human | Esophagus | ESCC | 1.76e-12 | 2.82e-01 | 0.1276 |
| 28990 | ASTE1 | P27T-E | Human | Esophagus | ESCC | 2.06e-08 | 1.95e-01 | 0.1055 |
| 28990 | ASTE1 | P28T-E | Human | Esophagus | ESCC | 8.84e-05 | 1.39e-01 | 0.1149 |
| Page: 1 2 3 |
| Tissue | Expression Dynamics | Abbreviation |
| Esophagus | 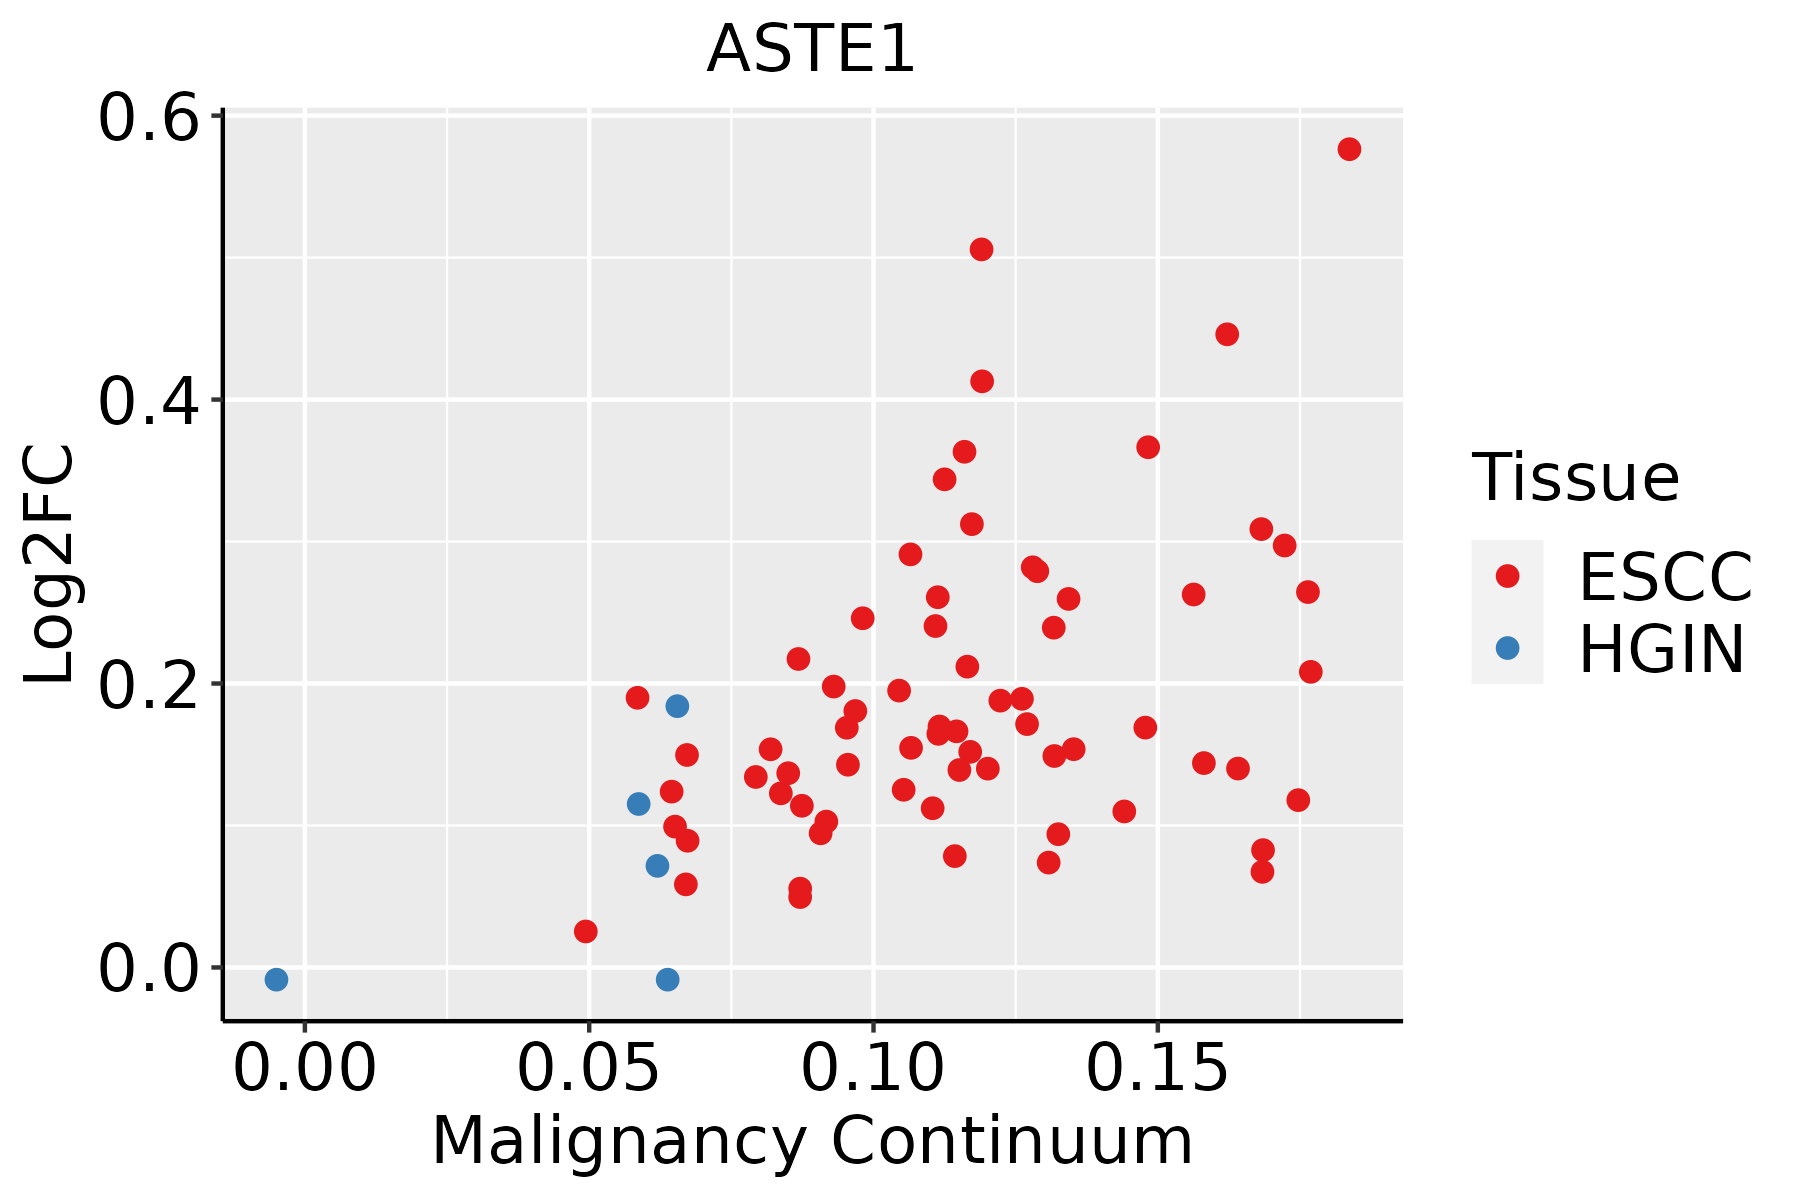 | ESCC: Esophageal squamous cell carcinoma |
| HGIN: High-grade intraepithelial neoplasias | ||
| LGIN: Low-grade intraepithelial neoplasias |
| ∗log2FC in expression of this searched gene in stem-like cells from each diseased tissue sample relative to stem-like cells in normal samples in each tissue plotted against the malignancy continuum. Samples are colored based on if they are from different disease stage. |
Top |
Malignant transformation related pathway analysis |
| Find out the enriched GO biological processes and KEGG pathways involved in transition from healthy to precancer to cancer |
| Tissue | Disease Stage | Enriched GO biological Processes |
| Colorectum | AD |  |
| Colorectum | SER |  |
| Colorectum | MSS |  |
| Colorectum | MSI-H |  |
| Colorectum | FAP |  |
| ∗Top 15 enriched GO BP terms are showed in the bar plot of each disease state in each tissue. Each row represents a significant GO biological process which is colored according to the -log10(p.adjust). |
| Page: 1 2 3 4 5 6 7 8 9 |
| GO ID | Tissue | Disease Stage | Description | Gene Ratio | Bg Ratio | pvalue | p.adjust | Count |
| GO:00903053 | Esophagus | ESCC | nucleic acid phosphodiester bond hydrolysis | 163/8552 | 261/18723 | 3.07e-08 | 5.73e-07 | 163 |
| Page: 1 |
| Pathway ID | Tissue | Disease Stage | Description | Gene Ratio | Bg Ratio | pvalue | p.adjust | qvalue | Count |
| Page: 1 |
Top |
Cell-cell communication analysis |
| Identification of potential cell-cell interactions between two cell types and their ligand-receptor pairs for different disease states |
| Ligand | Receptor | LRpair | Pathway | Tissue | Disease Stage |
| Page: 1 |
Top |
Single-cell gene regulatory network inference analysis |
| Find out the significant the regulons (TFs) and the target genes of each regulon across cell types for different disease states |
| TF | Cell Type | Tissue | Disease Stage | Target Gene | RSS | Regulon Activity |
| ∗The dot plots of a searched regulon are shown for all cell subpopulations in each disease state of each tissue based on the regulon specific score inferred using pySCENIC and by calculating the average expression. |
| Page: 1 |
Top |
Somatic mutation of malignant transformation related genes |
| Annotation of somatic variants for genes involved in malignant transformation |
| Hugo Symbol | Variant Class | Variant Classification | dbSNP RS | HGVSc | HGVSp | HGVSp Short | SWISSPROT | BIOTYPE | SIFT | PolyPhen | Tumor Sample Barcode | Tissue | Histology | Sex | Age | Stage | Therapy Types | Drugs | Outcome |
| ASTE1 | SNV | Missense_Mutation | novel | c.892N>A | p.Glu298Lys | p.E298K | protein_coding | deleterious(0.01) | possibly_damaging(0.875) | TCGA-A8-A09K-01 | Breast | breast invasive carcinoma | Female | >=65 | I/II | Unknown | Unknown | SD | |
| ASTE1 | SNV | Missense_Mutation | c.269N>A | p.Thr90Lys | p.T90K | protein_coding | tolerated(0.91) | benign(0.001) | TCGA-AO-A1KR-01 | Breast | breast invasive carcinoma | Female | <65 | I/II | Chemotherapy | cyclophosphamide | SD | ||
| ASTE1 | SNV | Missense_Mutation | c.793N>A | p.His265Asn | p.H265N | protein_coding | tolerated(0.42) | benign(0.003) | TCGA-BH-A0EE-01 | Breast | breast invasive carcinoma | Female | >=65 | I/II | Chemotherapy | docetaxel | SD | ||
| ASTE1 | insertion | Frame_Shift_Ins | novel | c.794_795insAAGTG | p.His265GlnfsTer11 | p.H265Qfs*11 | protein_coding | TCGA-A2-A04V-01 | Breast | breast invasive carcinoma | Female | <65 | I/II | Chemotherapy | cytoxan | PD | |||
| ASTE1 | insertion | Frame_Shift_Ins | novel | c.792_793insAATACTAATGAAATTTTTGTAAAGTACTTTACAGGATA | p.His265AsnfsTer22 | p.H265Nfs*22 | protein_coding | TCGA-A2-A04V-01 | Breast | breast invasive carcinoma | Female | <65 | I/II | Chemotherapy | cytoxan | PD | |||
| ASTE1 | insertion | Nonsense_Mutation | novel | c.889_890insTCTTTTTATATTACATATATATTT | p.Glu297delinsValPheLeuTyrTyrIleTyrIleTer | p.E297delinsVFLYYIYI* | protein_coding | TCGA-A8-A09K-01 | Breast | breast invasive carcinoma | Female | >=65 | I/II | Unknown | Unknown | SD | |||
| ASTE1 | SNV | Missense_Mutation | novel | c.755G>A | p.Arg252Lys | p.R252K | protein_coding | tolerated(0.84) | benign(0.014) | TCGA-2W-A8YY-01 | Cervix | cervical & endocervical cancer | Female | <65 | I/II | Chemotherapy | cisplatin | CR | |
| ASTE1 | SNV | Missense_Mutation | novel | c.460T>C | p.Cys154Arg | p.C154R | protein_coding | deleterious(0) | probably_damaging(1) | TCGA-2W-A8YY-01 | Cervix | cervical & endocervical cancer | Female | <65 | I/II | Chemotherapy | cisplatin | CR | |
| ASTE1 | SNV | Missense_Mutation | c.235N>C | p.Asp79His | p.D79H | protein_coding | deleterious(0) | probably_damaging(1) | TCGA-C5-A7CL-01 | Cervix | cervical & endocervical cancer | Female | <65 | III/IV | Chemotherapy | cisplatin | PD | ||
| ASTE1 | SNV | Missense_Mutation | novel | c.2102N>G | p.Ser701Cys | p.S701C | protein_coding | tolerated_low_confidence(0.11) | benign(0.003) | TCGA-C5-A902-01 | Cervix | cervical & endocervical cancer | Female | <65 | I/II | Chemotherapy | cisplatin | SD |
| Page: 1 2 3 4 5 6 7 8 |
Top |
Related drugs of malignant transformation related genes |
| Identification of chemicals and drugs interact with genes involved in malignant transfromation |
| (DGIdb 4.0) |
| Entrez ID | Symbol | Category | Interaction Types | Drug Claim Name | Drug Name | PMIDs |
| Page: 1 |

Copyright 2023-Present -The University of Texas Health Science Center at Houston |