
|
|||||
|
 | |
| |
| |
| |
| |
| |
|
Gene: ASS1 |
Gene summary for ASS1 |
| Gene information | Species | Human | Gene symbol | ASS1 | Gene ID | 445 |
| Gene name | argininosuccinate synthase 1 | |
| Gene Alias | ASS | |
| Cytomap | 9q34.11 | |
| Gene Type | protein-coding | GO ID | GO:0000050 | UniProtAcc | P00966 |
Top |
Malignant transformation analysis |
| Identification of the aberrant gene expression in precancerous and cancerous lesions by comparing the gene expression of stem-like cells in diseased tissues with normal stem cells |
| Entrez ID | Symbol | Replicates | Species | Organ | Tissue | Adj P-value | Log2FC | Malignancy |
| 445 | ASS1 | HTA11_3410_2000001011 | Human | Colorectum | AD | 2.75e-06 | 4.09e-01 | 0.0155 |
| 445 | ASS1 | HTA11_2487_2000001011 | Human | Colorectum | SER | 3.83e-26 | 1.56e+00 | -0.1808 |
| 445 | ASS1 | HTA11_1938_2000001011 | Human | Colorectum | AD | 4.81e-12 | 1.02e+00 | -0.0811 |
| 445 | ASS1 | HTA11_78_2000001011 | Human | Colorectum | AD | 5.84e-09 | 7.92e-01 | -0.1088 |
| 445 | ASS1 | HTA11_347_2000001011 | Human | Colorectum | AD | 1.68e-23 | 8.04e-01 | -0.1954 |
| 445 | ASS1 | HTA11_411_2000001011 | Human | Colorectum | SER | 2.22e-10 | 2.03e+00 | -0.2602 |
| 445 | ASS1 | HTA11_2112_2000001011 | Human | Colorectum | SER | 1.41e-16 | 1.85e+00 | -0.2196 |
| 445 | ASS1 | HTA11_3361_2000001011 | Human | Colorectum | AD | 8.59e-11 | 7.77e-01 | -0.1207 |
| 445 | ASS1 | HTA11_83_2000001011 | Human | Colorectum | SER | 3.58e-05 | 7.37e-01 | -0.1526 |
| 445 | ASS1 | HTA11_696_2000001011 | Human | Colorectum | AD | 1.15e-45 | 1.30e+00 | -0.1464 |
| 445 | ASS1 | HTA11_866_2000001011 | Human | Colorectum | AD | 4.61e-14 | 7.44e-01 | -0.1001 |
| 445 | ASS1 | HTA11_1391_2000001011 | Human | Colorectum | AD | 2.11e-42 | 1.76e+00 | -0.059 |
| 445 | ASS1 | HTA11_2992_2000001011 | Human | Colorectum | SER | 5.68e-11 | 1.04e+00 | -0.1706 |
| 445 | ASS1 | HTA11_5212_2000001011 | Human | Colorectum | AD | 1.94e-10 | 1.00e+00 | -0.2061 |
| 445 | ASS1 | HTA11_546_2000001011 | Human | Colorectum | AD | 1.07e-04 | 6.59e-01 | -0.0842 |
| 445 | ASS1 | HTA11_866_3004761011 | Human | Colorectum | AD | 5.92e-03 | 3.72e-01 | 0.096 |
| 445 | ASS1 | HTA11_10711_2000001011 | Human | Colorectum | AD | 6.55e-08 | 6.67e-01 | 0.0338 |
| 445 | ASS1 | HTA11_7696_3000711011 | Human | Colorectum | AD | 1.45e-15 | 7.57e-01 | 0.0674 |
| 445 | ASS1 | HTA11_6818_2000001011 | Human | Colorectum | AD | 2.07e-06 | 6.38e-01 | 0.0112 |
| 445 | ASS1 | HTA11_99999970781_79442 | Human | Colorectum | MSS | 1.25e-06 | 4.58e-01 | 0.294 |
| Page: 1 2 3 4 5 6 7 8 |
| Tissue | Expression Dynamics | Abbreviation |
| Colorectum (GSE201348) | 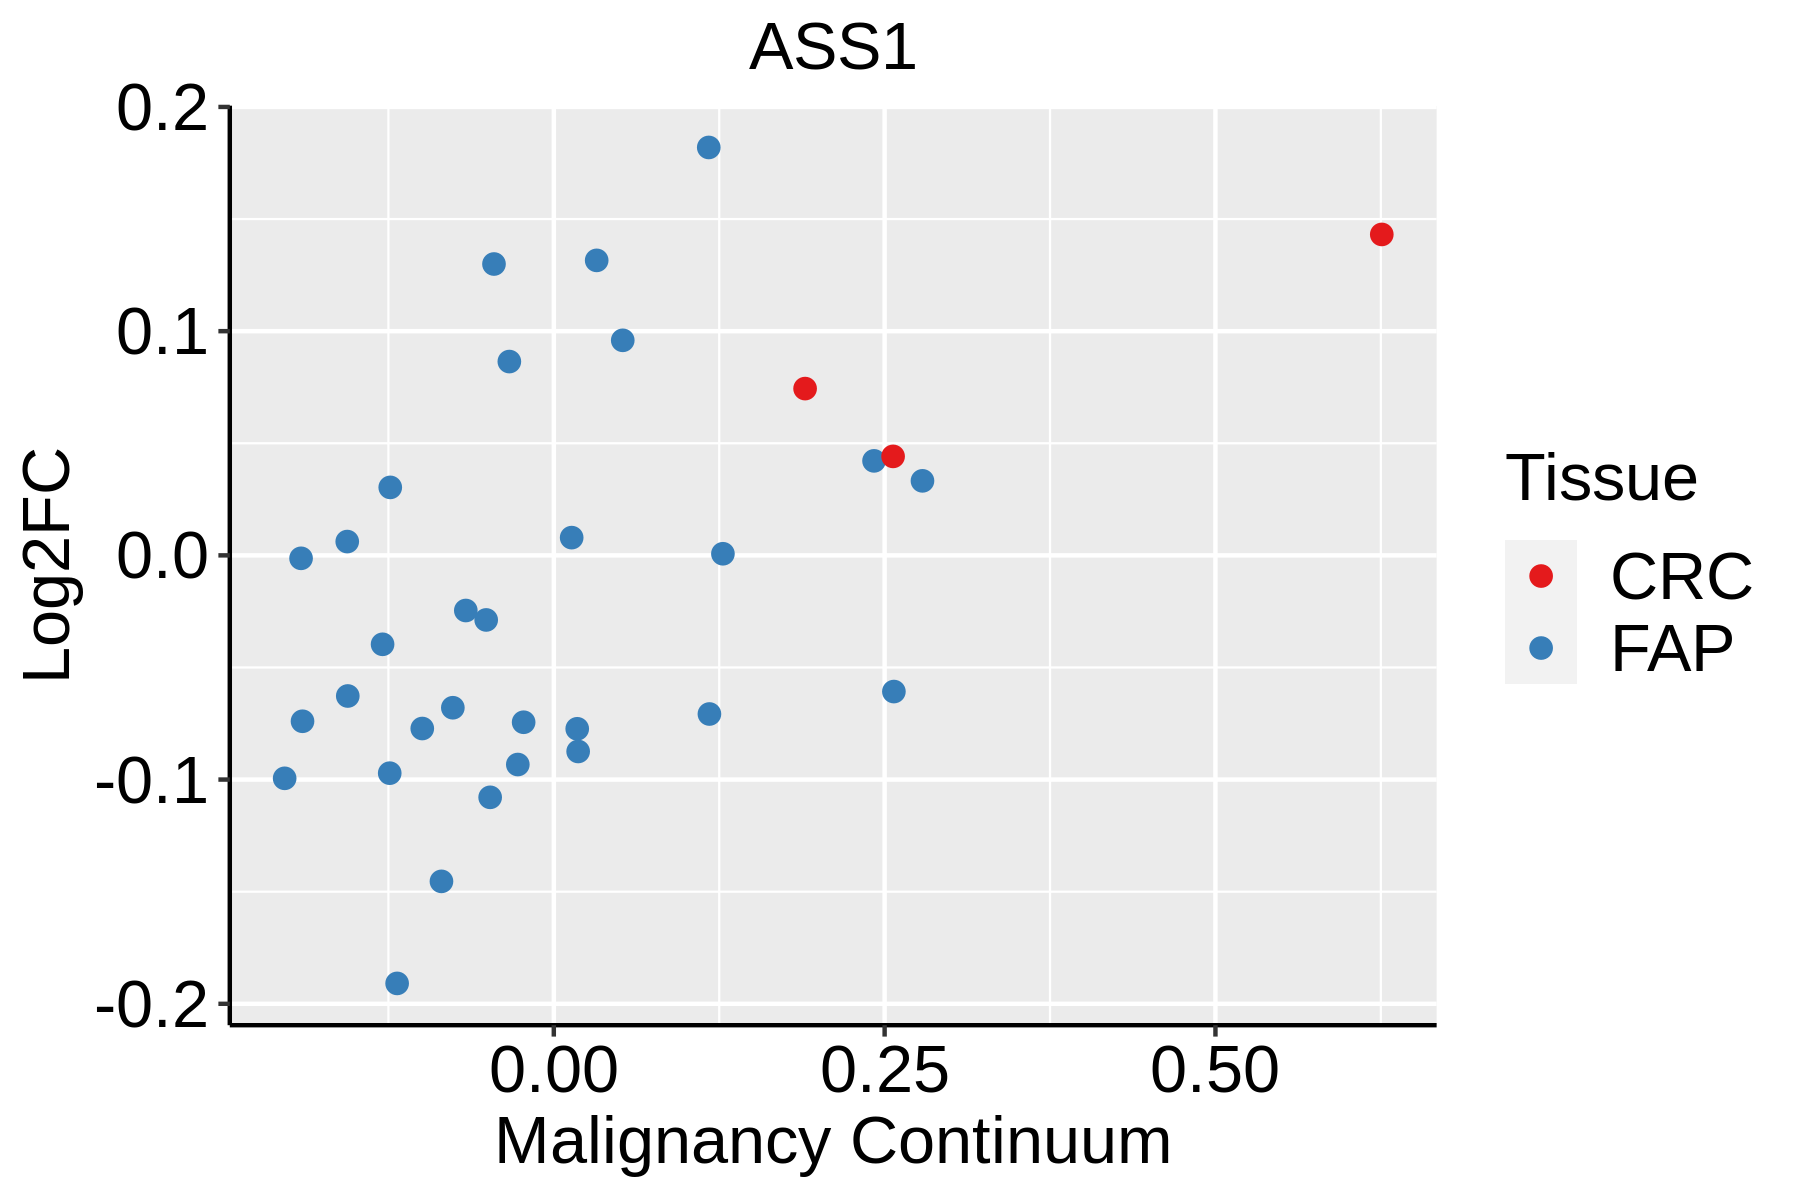 | FAP: Familial adenomatous polyposis |
| CRC: Colorectal cancer | ||
| Colorectum (HTA11) |  | AD: Adenomas |
| SER: Sessile serrated lesions | ||
| MSI-H: Microsatellite-high colorectal cancer | ||
| MSS: Microsatellite stable colorectal cancer | ||
| Esophagus | 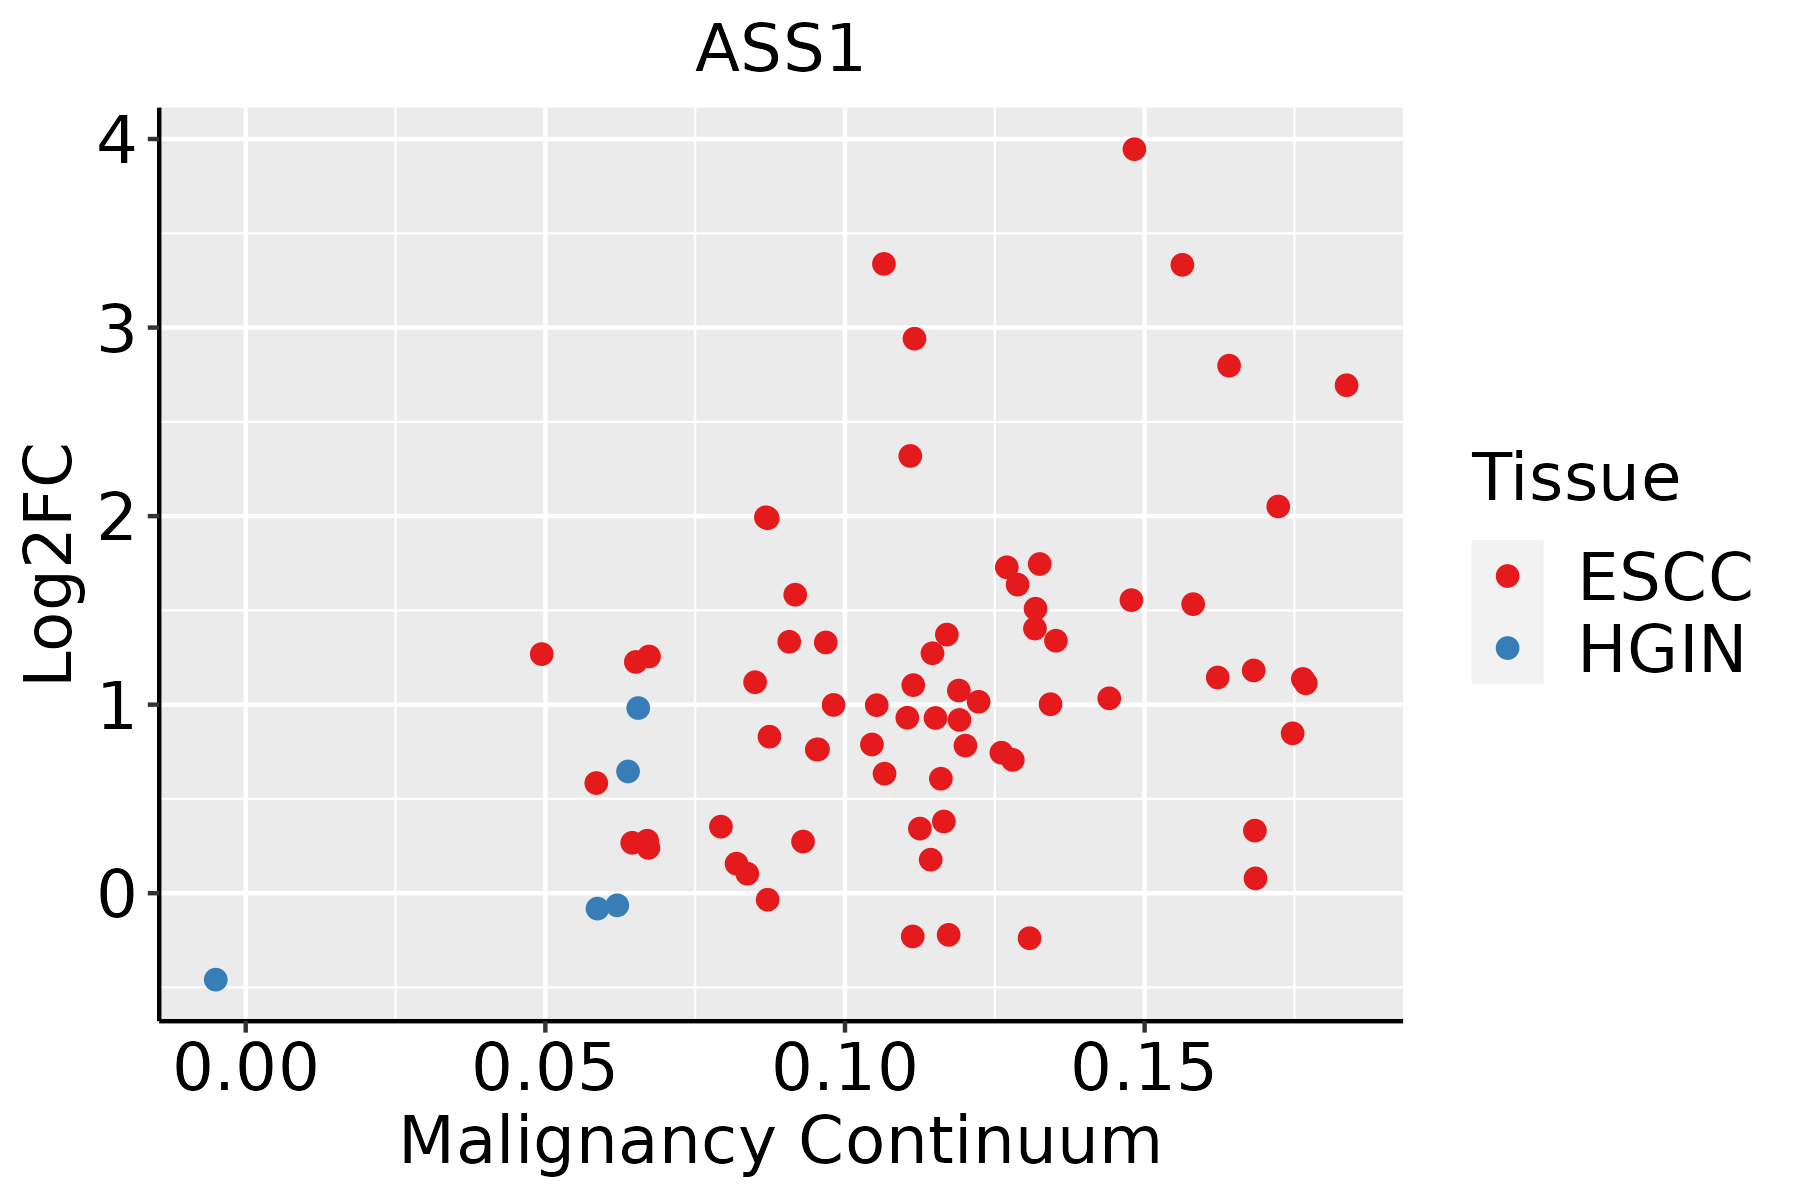 | ESCC: Esophageal squamous cell carcinoma |
| HGIN: High-grade intraepithelial neoplasias | ||
| LGIN: Low-grade intraepithelial neoplasias | ||
| GC |  | CAG: Chronic atrophic gastritis |
| CAG with IM: Chronic atrophic gastritis with intestinal metaplasia | ||
| CSG: Chronic superficial gastritis | ||
| GC: Gastric cancer | ||
| SIM: Severe intestinal metaplasia | ||
| WIM: Wild intestinal metaplasia | ||
| Liver | 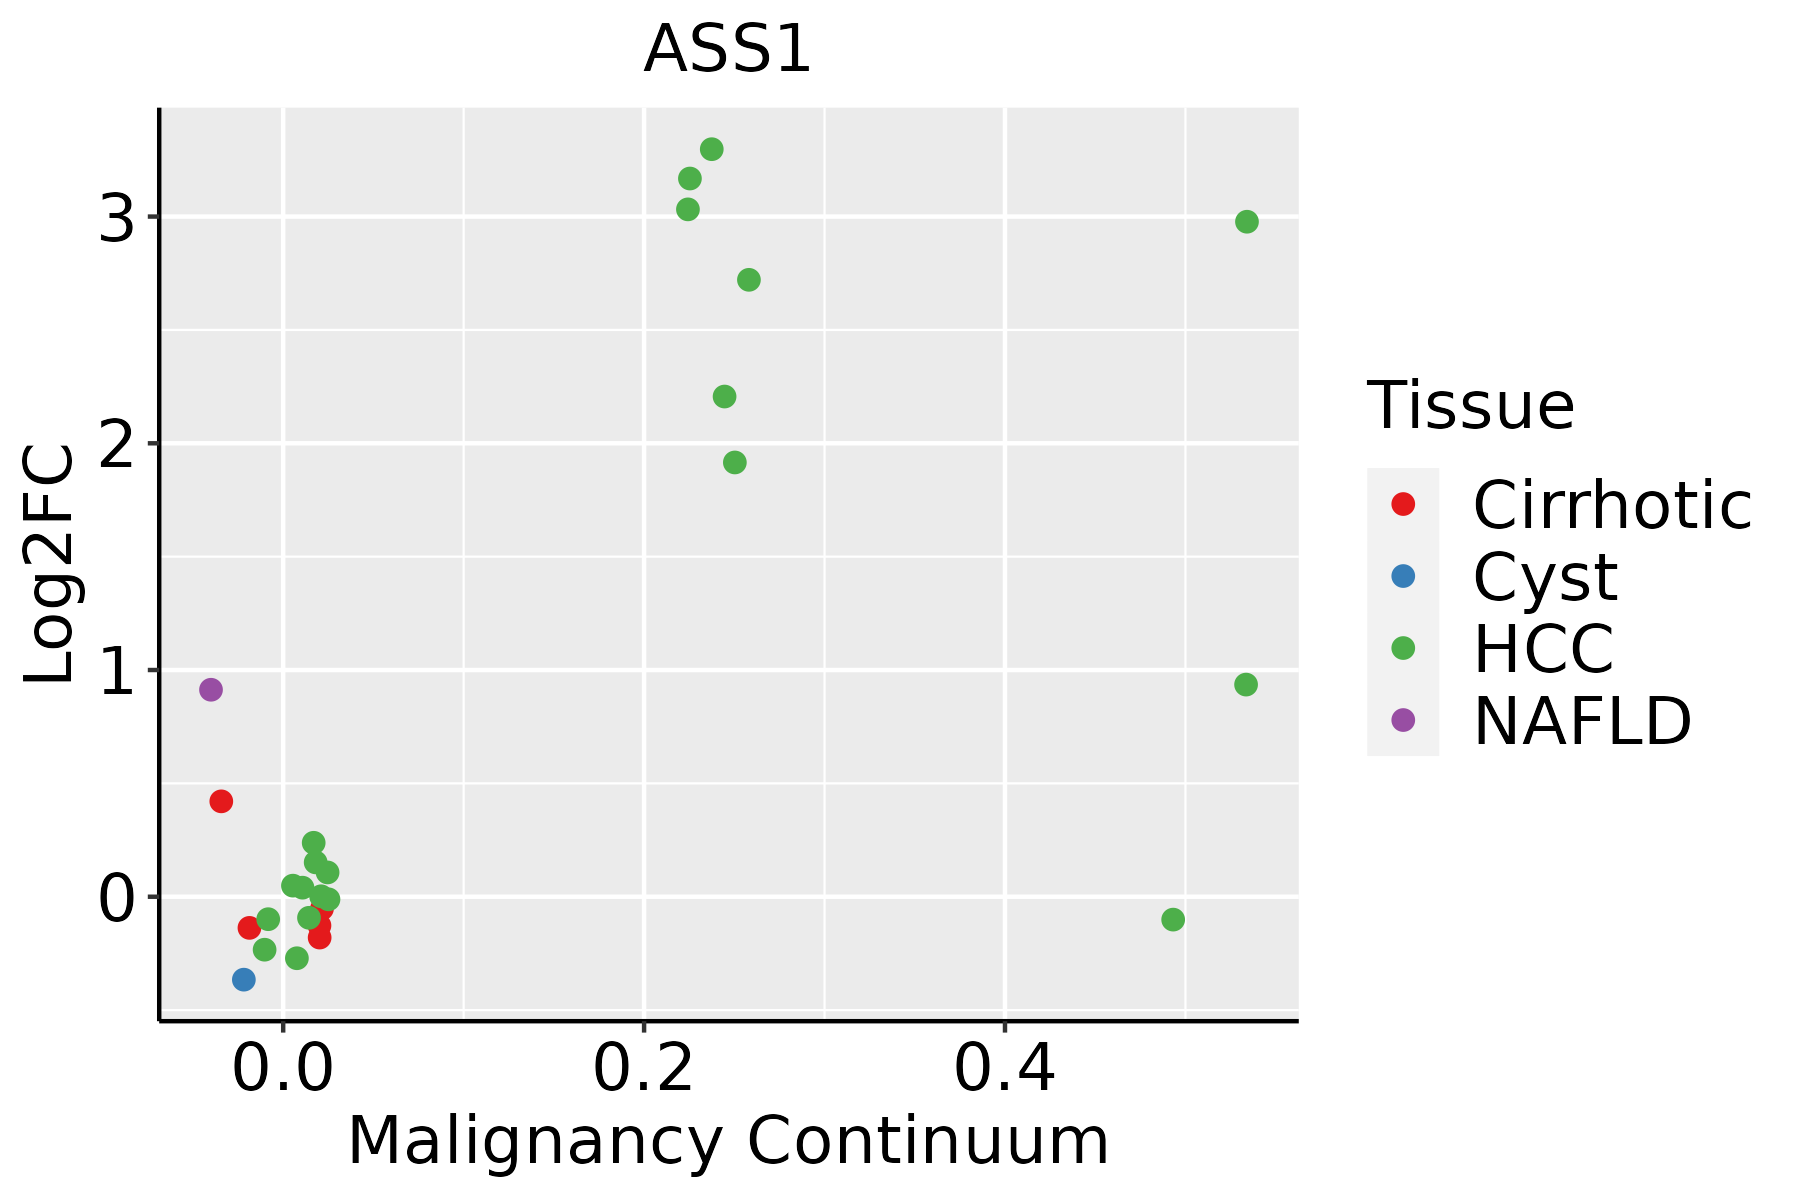 | HCC: Hepatocellular carcinoma |
| NAFLD: Non-alcoholic fatty liver disease | ||
| Oral Cavity | 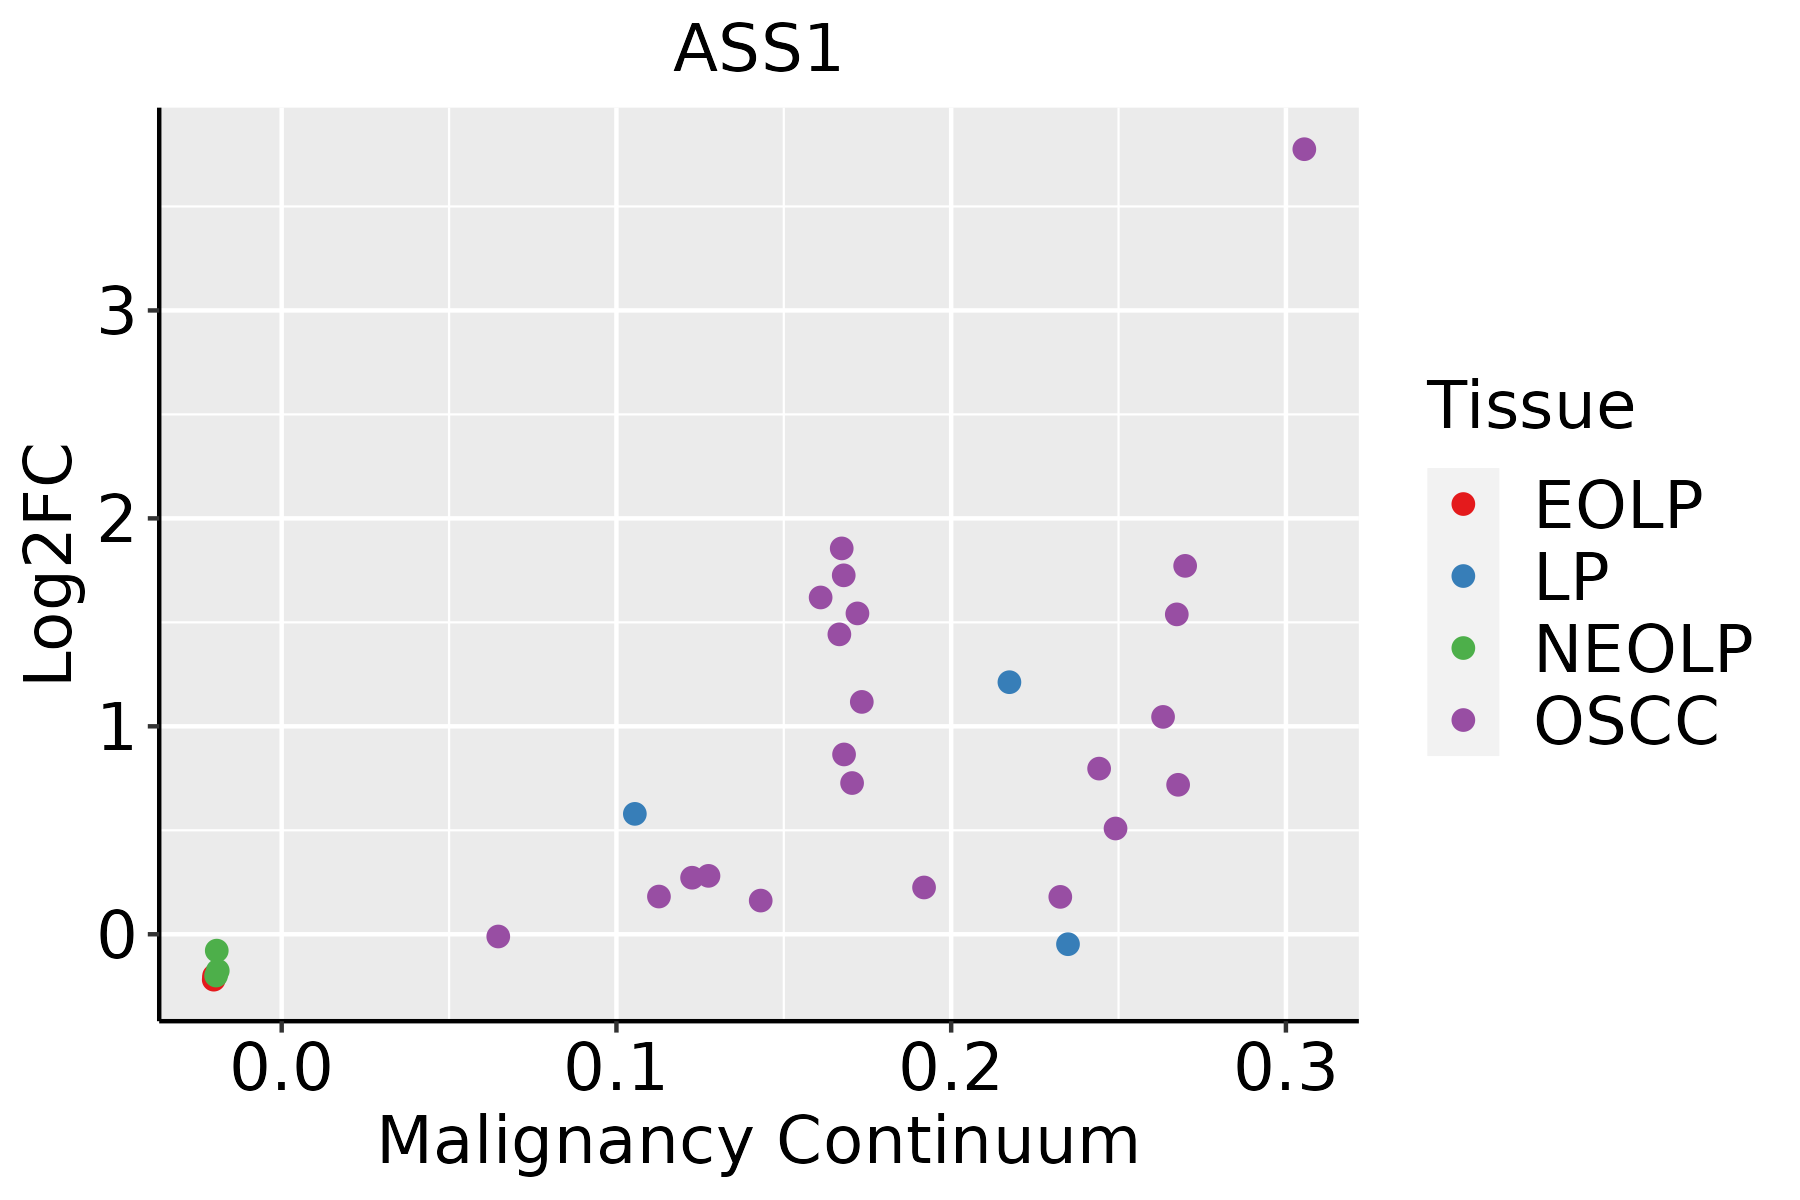 | EOLP: Erosive Oral lichen planus |
| LP: leukoplakia | ||
| NEOLP: Non-erosive oral lichen planus | ||
| OSCC: Oral squamous cell carcinoma | ||
| Skin | 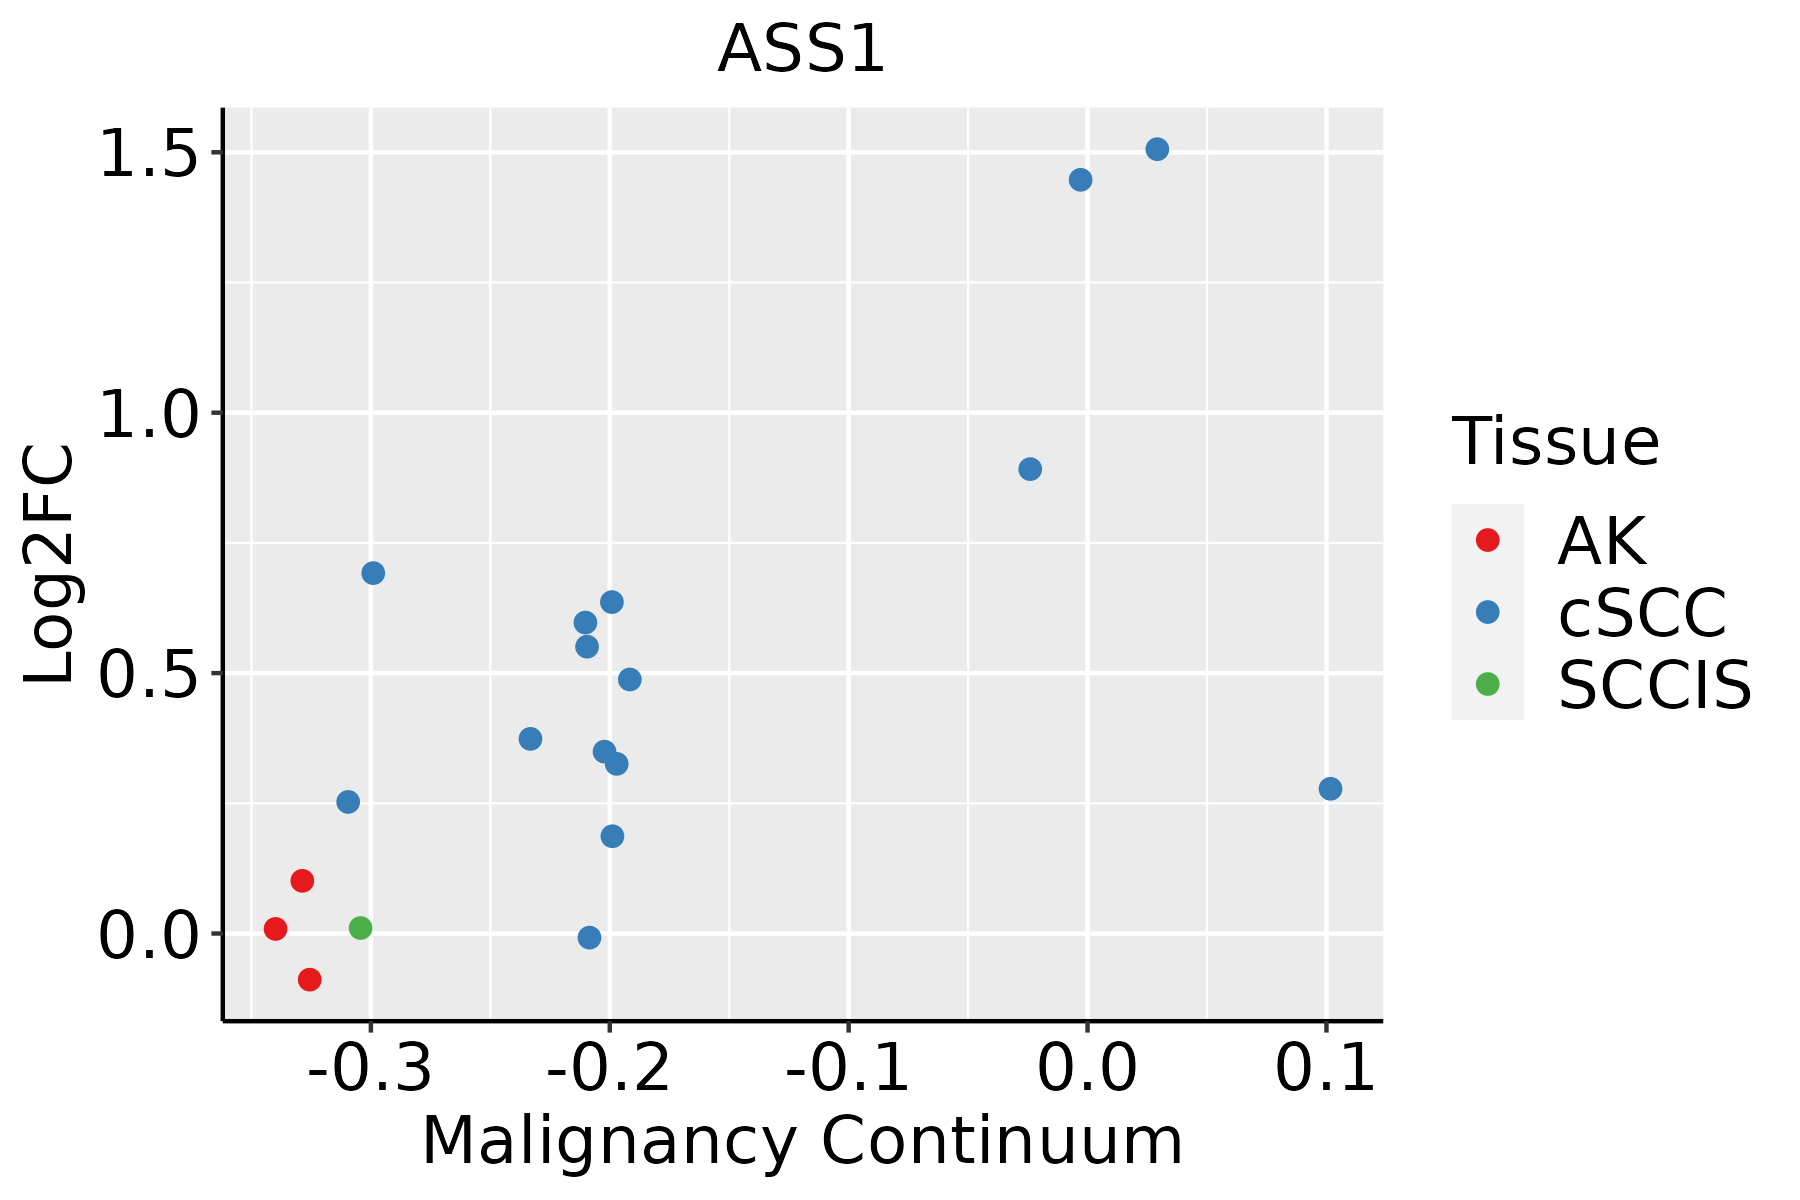 | AK: Actinic keratosis |
| cSCC: Cutaneous squamous cell carcinoma | ||
| SCCIS:squamous cell carcinoma in situ | ||
| Thyroid | 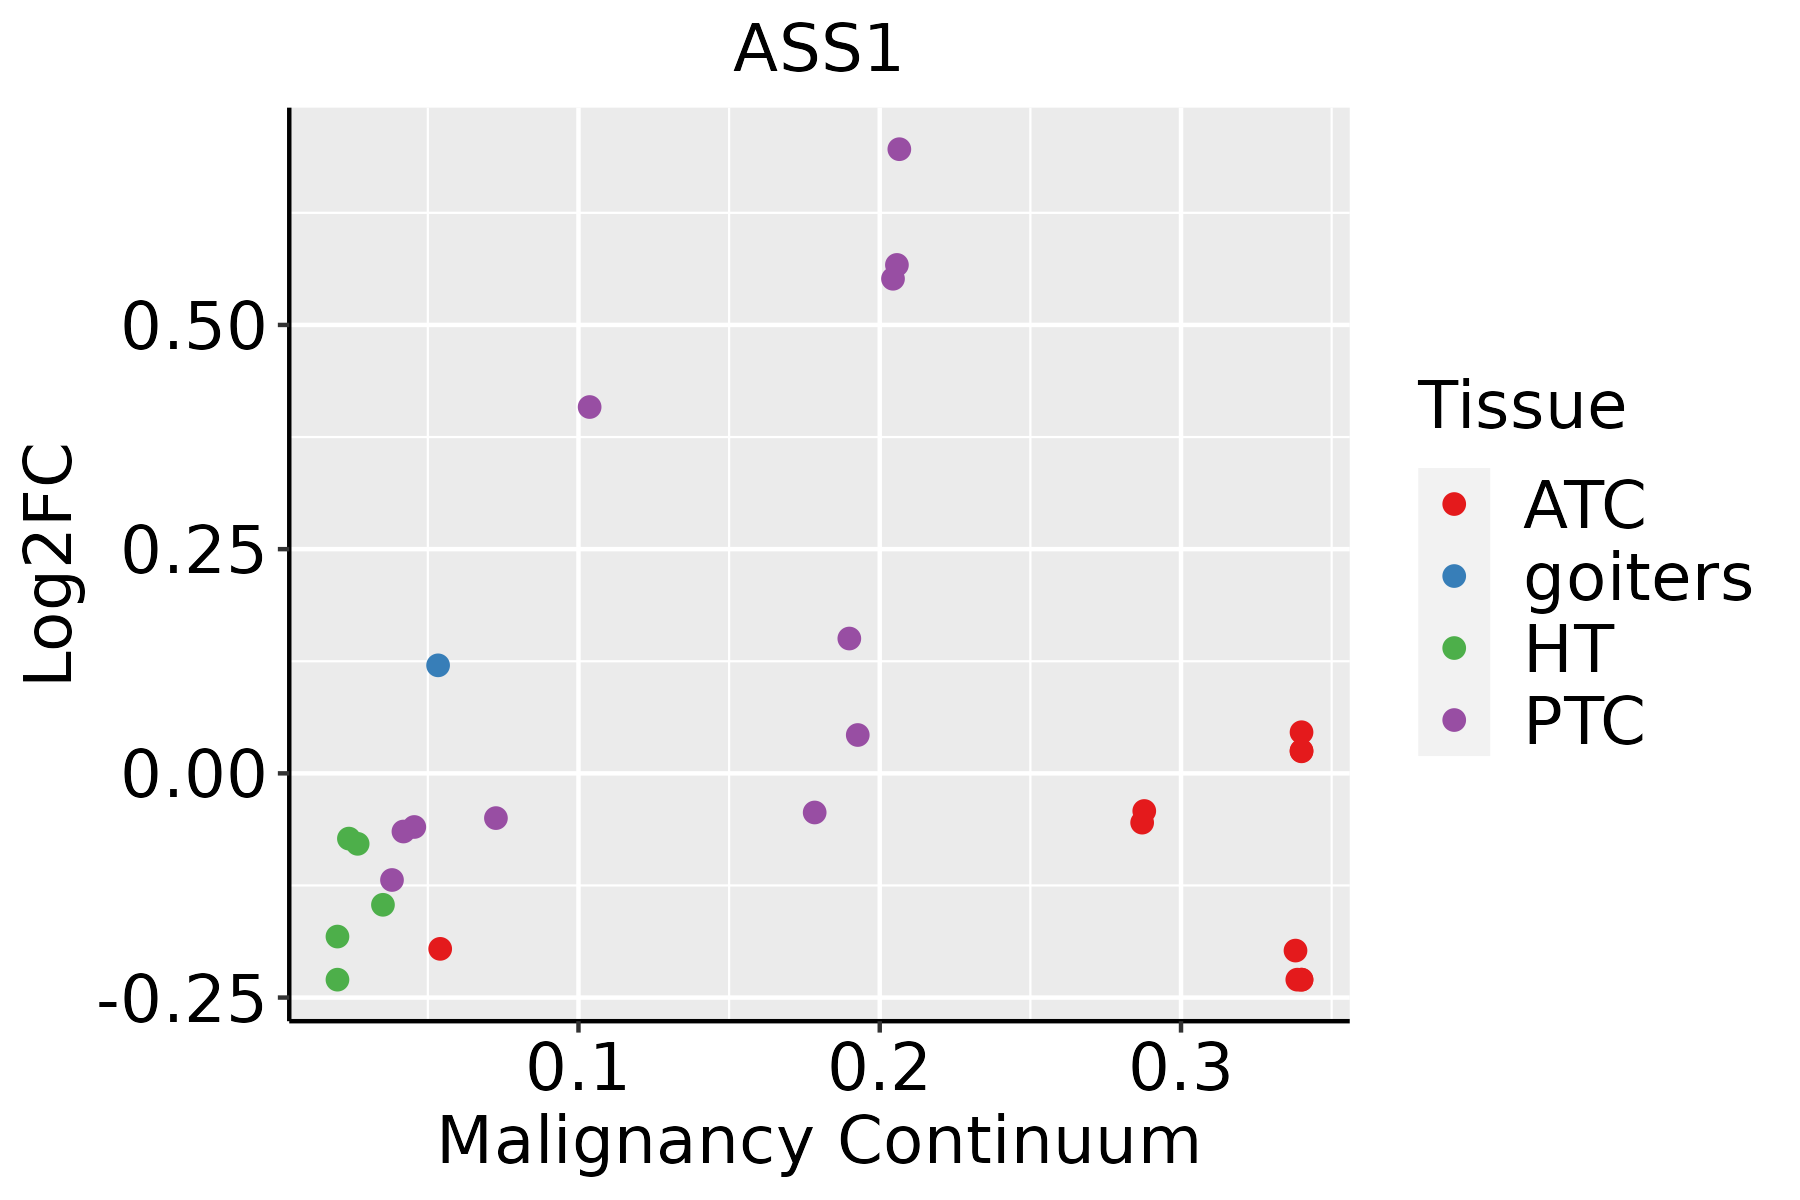 | ATC: Anaplastic thyroid cancer |
| HT: Hashimoto's thyroiditis | ||
| PTC: Papillary thyroid cancer |
| ∗log2FC in expression of this searched gene in stem-like cells from each diseased tissue sample relative to stem-like cells in normal samples in each tissue plotted against the malignancy continuum. Samples are colored based on if they are from different disease stage. |
Top |
Malignant transformation related pathway analysis |
| Find out the enriched GO biological processes and KEGG pathways involved in transition from healthy to precancer to cancer |
| Tissue | Disease Stage | Enriched GO biological Processes |
| Colorectum | AD |  |
| Colorectum | SER |  |
| Colorectum | MSS |  |
| Colorectum | MSI-H |  |
| Colorectum | FAP |  |
| ∗Top 15 enriched GO BP terms are showed in the bar plot of each disease state in each tissue. Each row represents a significant GO biological process which is colored according to the -log10(p.adjust). |
| Page: 1 2 3 4 5 6 7 8 9 |
| GO ID | Tissue | Disease Stage | Description | Gene Ratio | Bg Ratio | pvalue | p.adjust | Count |
| GO:0048732 | Colorectum | AD | gland development | 149/3918 | 436/18723 | 6.07e-11 | 6.33e-09 | 149 |
| GO:0071383 | Colorectum | AD | cellular response to steroid hormone stimulus | 73/3918 | 204/18723 | 6.31e-07 | 2.24e-05 | 73 |
| GO:1901653 | Colorectum | AD | cellular response to peptide | 114/3918 | 359/18723 | 8.32e-07 | 2.88e-05 | 114 |
| GO:0009636 | Colorectum | AD | response to toxic substance | 88/3918 | 262/18723 | 1.12e-06 | 3.72e-05 | 88 |
| GO:0071375 | Colorectum | AD | cellular response to peptide hormone stimulus | 95/3918 | 290/18723 | 1.50e-06 | 4.66e-05 | 95 |
| GO:0043434 | Colorectum | AD | response to peptide hormone | 126/3918 | 414/18723 | 2.70e-06 | 7.86e-05 | 126 |
| GO:0007623 | Colorectum | AD | circadian rhythm | 72/3918 | 210/18723 | 4.50e-06 | 1.21e-04 | 72 |
| GO:0061008 | Colorectum | AD | hepaticobiliary system development | 55/3918 | 150/18723 | 6.34e-06 | 1.59e-04 | 55 |
| GO:0001889 | Colorectum | AD | liver development | 54/3918 | 147/18723 | 7.20e-06 | 1.77e-04 | 54 |
| GO:0048511 | Colorectum | AD | rhythmic process | 94/3918 | 298/18723 | 1.00e-05 | 2.34e-04 | 94 |
| GO:0031667 | Colorectum | AD | response to nutrient levels | 138/3918 | 474/18723 | 1.22e-05 | 2.68e-04 | 138 |
| GO:0048545 | Colorectum | AD | response to steroid hormone | 104/3918 | 339/18723 | 1.33e-05 | 2.90e-04 | 104 |
| GO:0006809 | Colorectum | AD | nitric oxide biosynthetic process | 30/3918 | 76/18723 | 1.72e-04 | 2.33e-03 | 30 |
| GO:0046209 | Colorectum | AD | nitric oxide metabolic process | 31/3918 | 81/18723 | 2.61e-04 | 3.25e-03 | 31 |
| GO:0009410 | Colorectum | AD | response to xenobiotic stimulus | 128/3918 | 462/18723 | 2.69e-04 | 3.31e-03 | 128 |
| GO:0007568 | Colorectum | AD | aging | 98/3918 | 339/18723 | 2.77e-04 | 3.39e-03 | 98 |
| GO:0010038 | Colorectum | AD | response to metal ion | 106/3918 | 373/18723 | 3.22e-04 | 3.83e-03 | 106 |
| GO:2001057 | Colorectum | AD | reactive nitrogen species metabolic process | 31/3918 | 82/18723 | 3.37e-04 | 3.94e-03 | 31 |
| GO:0006575 | Colorectum | AD | cellular modified amino acid metabolic process | 59/3918 | 188/18723 | 4.80e-04 | 5.27e-03 | 59 |
| GO:0043648 | Colorectum | AD | dicarboxylic acid metabolic process | 34/3918 | 96/18723 | 7.22e-04 | 7.28e-03 | 34 |
| Page: 1 2 3 4 5 6 7 8 9 10 11 12 13 14 15 16 17 18 19 20 21 22 23 24 25 26 27 28 29 30 31 32 33 34 35 36 37 38 39 40 41 42 43 44 45 46 |
| Pathway ID | Tissue | Disease Stage | Description | Gene Ratio | Bg Ratio | pvalue | p.adjust | qvalue | Count |
| hsa05418 | Colorectum | AD | Fluid shear stress and atherosclerosis | 54/2092 | 139/8465 | 1.41e-04 | 1.16e-03 | 7.37e-04 | 54 |
| hsa01230 | Colorectum | AD | Biosynthesis of amino acids | 28/2092 | 75/8465 | 9.99e-03 | 3.89e-02 | 2.48e-02 | 28 |
| hsa054181 | Colorectum | AD | Fluid shear stress and atherosclerosis | 54/2092 | 139/8465 | 1.41e-04 | 1.16e-03 | 7.37e-04 | 54 |
| hsa012301 | Colorectum | AD | Biosynthesis of amino acids | 28/2092 | 75/8465 | 9.99e-03 | 3.89e-02 | 2.48e-02 | 28 |
| hsa054182 | Colorectum | SER | Fluid shear stress and atherosclerosis | 40/1580 | 139/8465 | 2.28e-03 | 1.75e-02 | 1.27e-02 | 40 |
| hsa012302 | Colorectum | SER | Biosynthesis of amino acids | 23/1580 | 75/8465 | 8.11e-03 | 4.14e-02 | 3.01e-02 | 23 |
| hsa054183 | Colorectum | SER | Fluid shear stress and atherosclerosis | 40/1580 | 139/8465 | 2.28e-03 | 1.75e-02 | 1.27e-02 | 40 |
| hsa012303 | Colorectum | SER | Biosynthesis of amino acids | 23/1580 | 75/8465 | 8.11e-03 | 4.14e-02 | 3.01e-02 | 23 |
| hsa054184 | Colorectum | MSS | Fluid shear stress and atherosclerosis | 51/1875 | 139/8465 | 6.06e-05 | 5.80e-04 | 3.55e-04 | 51 |
| hsa054185 | Colorectum | MSS | Fluid shear stress and atherosclerosis | 51/1875 | 139/8465 | 6.06e-05 | 5.80e-04 | 3.55e-04 | 51 |
| hsa05418211 | Esophagus | ESCC | Fluid shear stress and atherosclerosis | 109/4205 | 139/8465 | 2.00e-12 | 3.72e-11 | 1.90e-11 | 109 |
| hsa0123023 | Esophagus | ESCC | Biosynthesis of amino acids | 49/4205 | 75/8465 | 4.35e-03 | 1.12e-02 | 5.74e-03 | 49 |
| hsa05418310 | Esophagus | ESCC | Fluid shear stress and atherosclerosis | 109/4205 | 139/8465 | 2.00e-12 | 3.72e-11 | 1.90e-11 | 109 |
| hsa0123033 | Esophagus | ESCC | Biosynthesis of amino acids | 49/4205 | 75/8465 | 4.35e-03 | 1.12e-02 | 5.74e-03 | 49 |
| hsa0541814 | Liver | NAFLD | Fluid shear stress and atherosclerosis | 30/1043 | 139/8465 | 1.37e-03 | 1.71e-02 | 1.38e-02 | 30 |
| hsa0541815 | Liver | NAFLD | Fluid shear stress and atherosclerosis | 30/1043 | 139/8465 | 1.37e-03 | 1.71e-02 | 1.38e-02 | 30 |
| hsa0541822 | Liver | Cirrhotic | Fluid shear stress and atherosclerosis | 62/2530 | 139/8465 | 1.53e-04 | 1.06e-03 | 6.54e-04 | 62 |
| hsa012304 | Liver | Cirrhotic | Biosynthesis of amino acids | 35/2530 | 75/8465 | 1.54e-03 | 7.83e-03 | 4.83e-03 | 35 |
| hsa0541832 | Liver | Cirrhotic | Fluid shear stress and atherosclerosis | 62/2530 | 139/8465 | 1.53e-04 | 1.06e-03 | 6.54e-04 | 62 |
| hsa0123011 | Liver | Cirrhotic | Biosynthesis of amino acids | 35/2530 | 75/8465 | 1.54e-03 | 7.83e-03 | 4.83e-03 | 35 |
| Page: 1 2 3 |
Top |
Cell-cell communication analysis |
| Identification of potential cell-cell interactions between two cell types and their ligand-receptor pairs for different disease states |
| Ligand | Receptor | LRpair | Pathway | Tissue | Disease Stage |
| Page: 1 |
Top |
Single-cell gene regulatory network inference analysis |
| Find out the significant the regulons (TFs) and the target genes of each regulon across cell types for different disease states |
| TF | Cell Type | Tissue | Disease Stage | Target Gene | RSS | Regulon Activity |
| ∗The dot plots of a searched regulon are shown for all cell subpopulations in each disease state of each tissue based on the regulon specific score inferred using pySCENIC and by calculating the average expression. |
| Page: 1 |
Top |
Somatic mutation of malignant transformation related genes |
| Annotation of somatic variants for genes involved in malignant transformation |
| Hugo Symbol | Variant Class | Variant Classification | dbSNP RS | HGVSc | HGVSp | HGVSp Short | SWISSPROT | BIOTYPE | SIFT | PolyPhen | Tumor Sample Barcode | Tissue | Histology | Sex | Age | Stage | Therapy Types | Drugs | Outcome |
| ASS1 | SNV | Missense_Mutation | c.836G>C | p.Arg279Pro | p.R279P | P00966 | protein_coding | deleterious(0) | probably_damaging(0.996) | TCGA-A1-A0SO-01 | Breast | breast invasive carcinoma | Female | >=65 | I/II | Chemotherapy | SD | ||
| ASS1 | insertion | Nonsense_Mutation | novel | c.938_939insACGGTGAGGCCTGAGGAACTCCCGAGGGATTTGA | p.Gly314ArgfsTer2 | p.G314Rfs*2 | P00966 | protein_coding | TCGA-BH-A0HX-01 | Breast | breast invasive carcinoma | Female | <65 | I/II | Chemotherapy | adrimycin | SD | ||
| ASS1 | SNV | Missense_Mutation | rs771937610 | c.1088N>A | p.Arg363Gln | p.R363Q | P00966 | protein_coding | deleterious(0.04) | benign(0.164) | TCGA-FU-A23K-01 | Cervix | cervical & endocervical cancer | Female | <65 | III/IV | Unknown | Unknown | SD |
| ASS1 | SNV | Missense_Mutation | rs183276875 | c.919N>T | p.Arg307Cys | p.R307C | P00966 | protein_coding | tolerated(0.06) | possibly_damaging(0.85) | TCGA-AA-3663-01 | Colorectum | colon adenocarcinoma | Male | <65 | I/II | Unknown | Unknown | SD |
| ASS1 | SNV | Missense_Mutation | c.440N>C | p.Met147Thr | p.M147T | P00966 | protein_coding | tolerated(0.31) | benign(0.015) | TCGA-AA-A01R-01 | Colorectum | colon adenocarcinoma | Male | <65 | III/IV | Chemotherapy | 5-fluorouracil | PD | |
| ASS1 | SNV | Missense_Mutation | c.856N>A | p.Ala286Thr | p.A286T | P00966 | protein_coding | deleterious(0) | probably_damaging(0.949) | TCGA-F4-6856-01 | Colorectum | colon adenocarcinoma | Male | <65 | I/II | Ancillary | leucovorin | CR | |
| ASS1 | SNV | Missense_Mutation | novel | c.637N>G | p.Pro213Ala | p.P213A | P00966 | protein_coding | deleterious(0.02) | possibly_damaging(0.801) | TCGA-AG-3881-01 | Colorectum | rectum adenocarcinoma | Female | >=65 | I/II | Unknown | Unknown | SD |
| ASS1 | SNV | Missense_Mutation | c.717N>T | p.Lys239Asn | p.K239N | P00966 | protein_coding | tolerated(0.32) | benign(0.009) | TCGA-AG-A002-01 | Colorectum | rectum adenocarcinoma | Male | <65 | I/II | Unknown | Unknown | SD | |
| ASS1 | SNV | Missense_Mutation | novel | c.627N>T | p.Lys209Asn | p.K209N | P00966 | protein_coding | tolerated(0.08) | possibly_damaging(0.734) | TCGA-A5-A0G2-01 | Endometrium | uterine corpus endometrioid carcinoma | Female | <65 | III/IV | Unknown | Unknown | SD |
| ASS1 | SNV | Missense_Mutation | novel | c.896N>T | p.Ala299Val | p.A299V | P00966 | protein_coding | tolerated(0.19) | benign(0.003) | TCGA-A5-A0G2-01 | Endometrium | uterine corpus endometrioid carcinoma | Female | <65 | III/IV | Unknown | Unknown | SD |
| Page: 1 2 3 4 5 |
Top |
Related drugs of malignant transformation related genes |
| Identification of chemicals and drugs interact with genes involved in malignant transfromation |
| (DGIdb 4.0) |
| Entrez ID | Symbol | Category | Interaction Types | Drug Claim Name | Drug Name | PMIDs |
| 445 | ASS1 | ENZYME, DRUG RESISTANCE | CHLOROQUINE | CHLOROQUINE | 27735949 | |
| 445 | ASS1 | ENZYME, DRUG RESISTANCE | PLATINUM COMPOUND | 19533750 | ||
| 445 | ASS1 | ENZYME, DRUG RESISTANCE | Sodium Phenylbutyrate | |||
| 445 | ASS1 | ENZYME, DRUG RESISTANCE | sodium phenylbutyrate | |||
| 445 | ASS1 | ENZYME, DRUG RESISTANCE | sodium benzoate / sodium phenylacetate | |||
| 445 | ASS1 | ENZYME, DRUG RESISTANCE | PEGARGIMINASE | PEGARGIMINASE | 27735949 |
| Page: 1 |

Copyright 2023-Present -The University of Texas Health Science Center at Houston |