
|
|||||
|
 | |
| |
| |
| |
| |
| |
|
Gene: ASRGL1 |
Gene summary for ASRGL1 |
| Gene information | Species | Human | Gene symbol | ASRGL1 | Gene ID | 80150 |
| Gene name | asparaginase and isoaspartyl peptidase 1 | |
| Gene Alias | ALP | |
| Cytomap | 11q12.3 | |
| Gene Type | protein-coding | GO ID | GO:0006082 | UniProtAcc | A0A024R573 |
Top |
Malignant transformation analysis |
| Identification of the aberrant gene expression in precancerous and cancerous lesions by comparing the gene expression of stem-like cells in diseased tissues with normal stem cells |
| Entrez ID | Symbol | Replicates | Species | Organ | Tissue | Adj P-value | Log2FC | Malignancy |
| 80150 | ASRGL1 | HTA11_3410_2000001011 | Human | Colorectum | AD | 2.11e-13 | 4.52e-01 | 0.0155 |
| 80150 | ASRGL1 | HTA11_696_2000001011 | Human | Colorectum | AD | 4.43e-18 | 6.44e-01 | -0.1464 |
| 80150 | ASRGL1 | HTA11_866_2000001011 | Human | Colorectum | AD | 2.37e-05 | 4.15e-01 | -0.1001 |
| 80150 | ASRGL1 | HTA11_1391_2000001011 | Human | Colorectum | AD | 4.08e-14 | 6.50e-01 | -0.059 |
| 80150 | ASRGL1 | HTA11_866_3004761011 | Human | Colorectum | AD | 2.35e-04 | 3.47e-01 | 0.096 |
| 80150 | ASRGL1 | HTA11_6801_2000001011 | Human | Colorectum | SER | 2.11e-02 | 3.34e-01 | 0.0171 |
| 80150 | ASRGL1 | HTA11_99999965104_69814 | Human | Colorectum | MSS | 3.61e-04 | 3.57e-01 | 0.281 |
| 80150 | ASRGL1 | A015-C-005 | Human | Colorectum | FAP | 2.35e-10 | 6.20e-01 | -0.0336 |
| 80150 | ASRGL1 | A015-C-104 | Human | Colorectum | FAP | 4.94e-04 | 2.22e-01 | -0.1899 |
| 80150 | ASRGL1 | CRC-1-8810 | Human | Colorectum | CRC | 3.75e-03 | -1.52e-01 | 0.6257 |
| 80150 | ASRGL1 | AEH-subject1 | Human | Endometrium | AEH | 2.33e-10 | 3.71e-01 | -0.3059 |
| 80150 | ASRGL1 | AEH-subject3 | Human | Endometrium | AEH | 7.25e-09 | 5.22e-01 | -0.2576 |
| 80150 | ASRGL1 | AEH-subject5 | Human | Endometrium | AEH | 6.08e-09 | 5.38e-01 | -0.2953 |
| 80150 | ASRGL1 | EEC-subject1 | Human | Endometrium | EEC | 6.54e-05 | 4.77e-01 | -0.2682 |
| 80150 | ASRGL1 | EEC-subject2 | Human | Endometrium | EEC | 2.75e-07 | 4.62e-01 | -0.2607 |
| 80150 | ASRGL1 | EEC-subject3 | Human | Endometrium | EEC | 1.60e-06 | -2.13e-01 | -0.2525 |
| 80150 | ASRGL1 | EEC-subject4 | Human | Endometrium | EEC | 2.21e-19 | 6.09e-01 | -0.2571 |
| 80150 | ASRGL1 | EEC-subject5 | Human | Endometrium | EEC | 3.58e-03 | 3.71e-01 | -0.249 |
| 80150 | ASRGL1 | GSM5276934 | Human | Endometrium | EEC | 7.64e-22 | -6.72e-01 | -0.0913 |
| 80150 | ASRGL1 | GSM5276935 | Human | Endometrium | EEC | 2.27e-13 | -2.06e-01 | -0.123 |
| Page: 1 2 3 |
| Tissue | Expression Dynamics | Abbreviation |
| Colorectum (GSE201348) |  | FAP: Familial adenomatous polyposis |
| CRC: Colorectal cancer | ||
| Colorectum (HTA11) |  | AD: Adenomas |
| SER: Sessile serrated lesions | ||
| MSI-H: Microsatellite-high colorectal cancer | ||
| MSS: Microsatellite stable colorectal cancer | ||
| Endometrium | 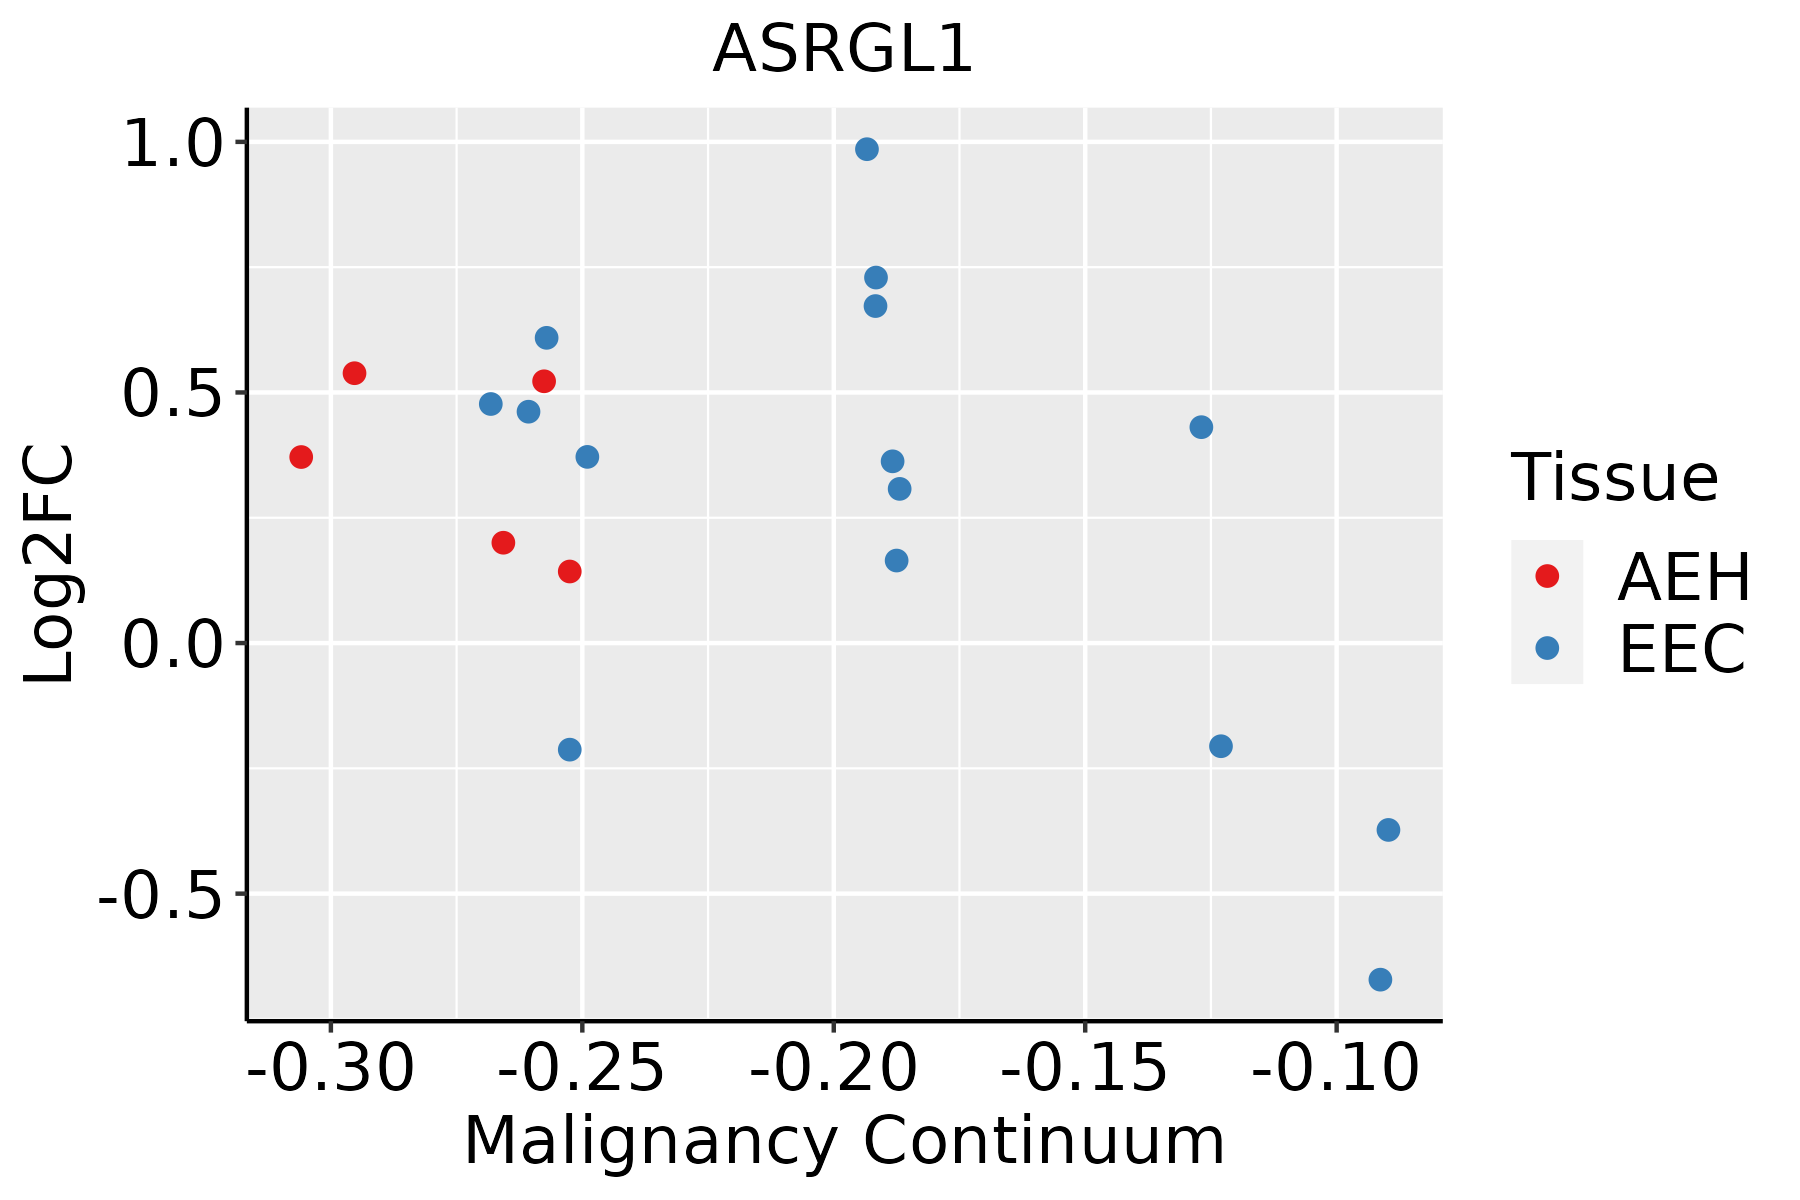 | AEH: Atypical endometrial hyperplasia |
| EEC: Endometrioid Cancer | ||
| Liver | 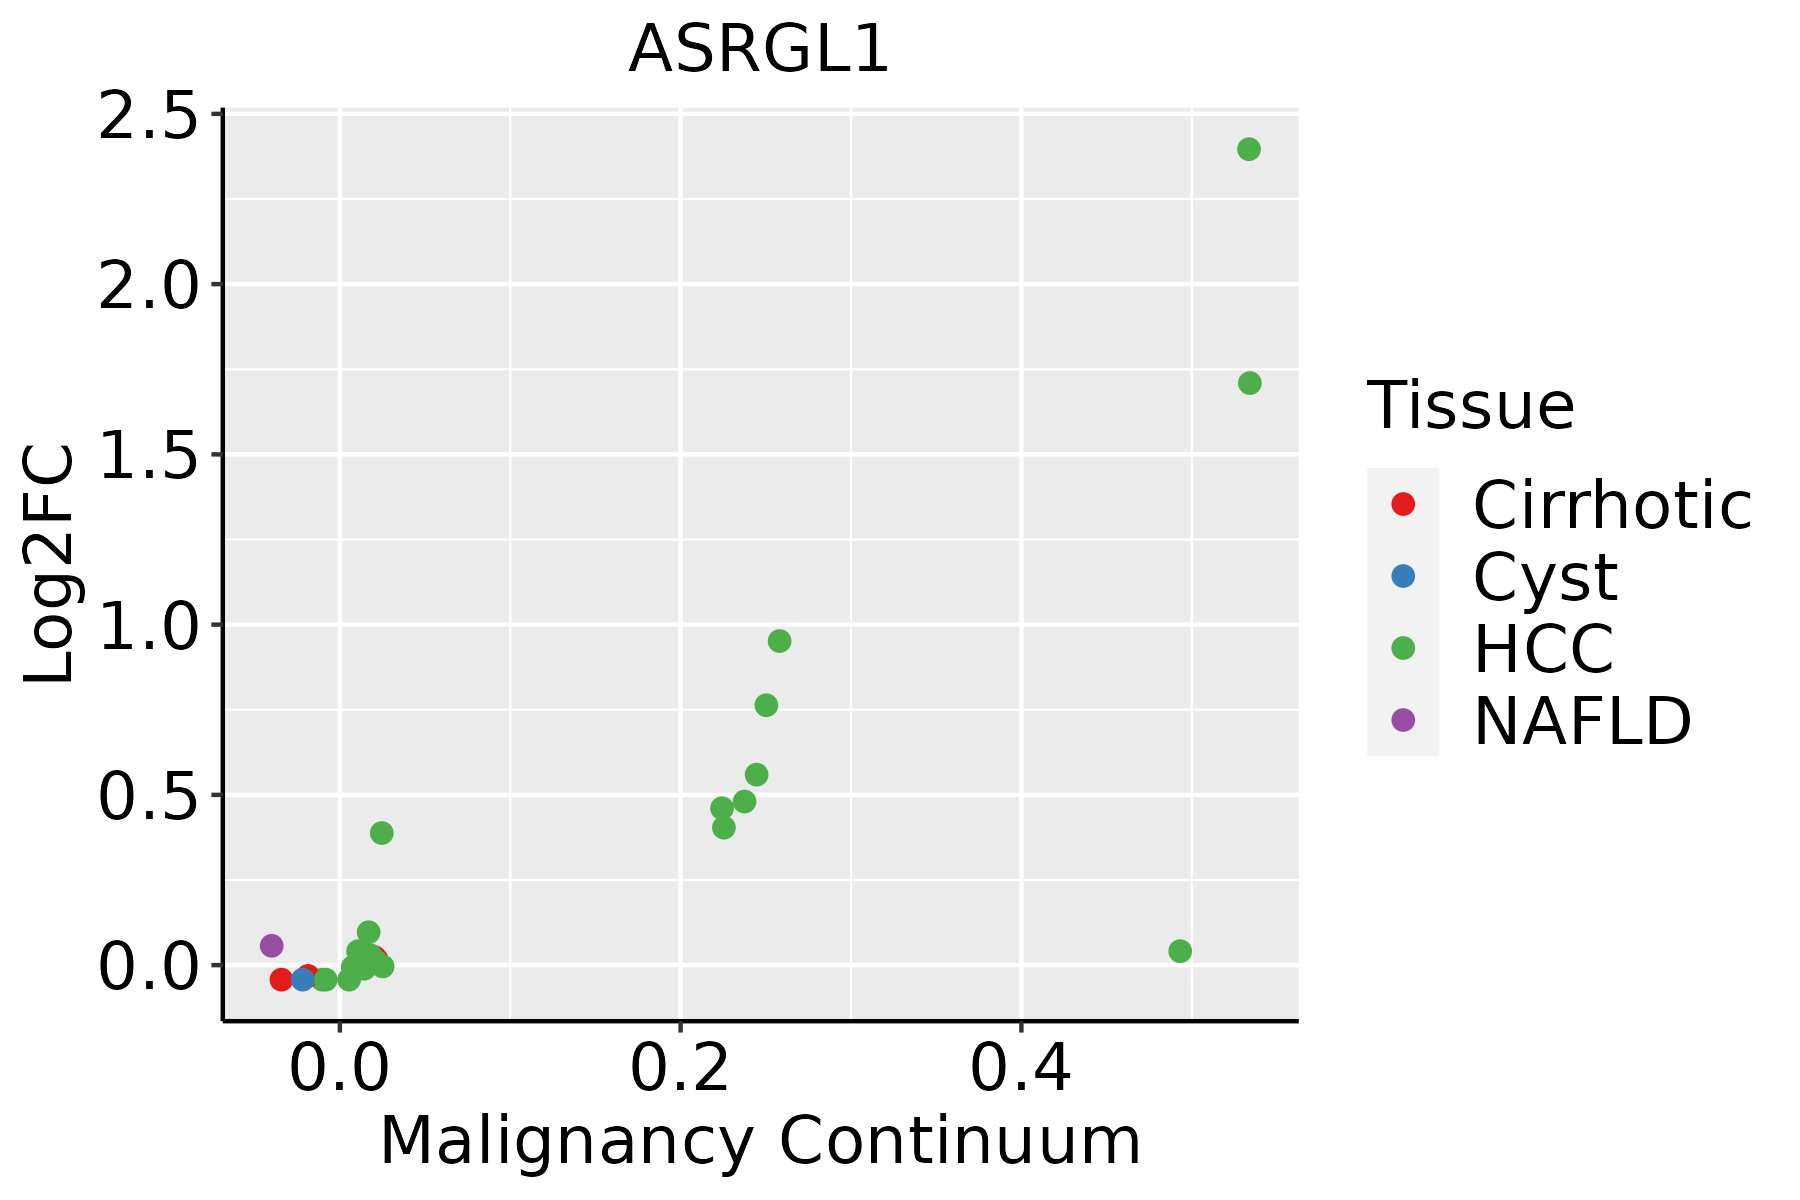 | HCC: Hepatocellular carcinoma |
| NAFLD: Non-alcoholic fatty liver disease | ||
| Lung |  | AAH: Atypical adenomatous hyperplasia |
| AIS: Adenocarcinoma in situ | ||
| IAC: Invasive lung adenocarcinoma | ||
| MIA: Minimally invasive adenocarcinoma |
| ∗log2FC in expression of this searched gene in stem-like cells from each diseased tissue sample relative to stem-like cells in normal samples in each tissue plotted against the malignancy continuum. Samples are colored based on if they are from different disease stage. |
Top |
Malignant transformation related pathway analysis |
| Find out the enriched GO biological processes and KEGG pathways involved in transition from healthy to precancer to cancer |
| Tissue | Disease Stage | Enriched GO biological Processes |
| Colorectum | AD |  |
| Colorectum | SER |  |
| Colorectum | MSS |  |
| Colorectum | MSI-H |  |
| Colorectum | FAP |  |
| ∗Top 15 enriched GO BP terms are showed in the bar plot of each disease state in each tissue. Each row represents a significant GO biological process which is colored according to the -log10(p.adjust). |
| Page: 1 2 3 4 5 6 7 8 9 |
| GO ID | Tissue | Disease Stage | Description | Gene Ratio | Bg Ratio | pvalue | p.adjust | Count |
| GO:0044282 | Colorectum | AD | small molecule catabolic process | 118/3918 | 376/18723 | 1.05e-06 | 3.55e-05 | 118 |
| GO:0016054 | Colorectum | AD | organic acid catabolic process | 73/3918 | 240/18723 | 3.20e-04 | 3.81e-03 | 73 |
| GO:0046395 | Colorectum | AD | carboxylic acid catabolic process | 70/3918 | 236/18723 | 9.06e-04 | 8.71e-03 | 70 |
| GO:0006520 | Colorectum | AD | cellular amino acid metabolic process | 81/3918 | 284/18723 | 1.37e-03 | 1.19e-02 | 81 |
| GO:00442821 | Colorectum | SER | small molecule catabolic process | 87/2897 | 376/18723 | 5.31e-05 | 1.27e-03 | 87 |
| GO:00160541 | Colorectum | SER | organic acid catabolic process | 53/2897 | 240/18723 | 4.04e-03 | 3.30e-02 | 53 |
| GO:00065201 | Colorectum | SER | cellular amino acid metabolic process | 61/2897 | 284/18723 | 4.20e-03 | 3.41e-02 | 61 |
| GO:00442822 | Colorectum | MSS | small molecule catabolic process | 94/3467 | 376/18723 | 9.85e-04 | 9.86e-03 | 94 |
| GO:00160542 | Colorectum | MSS | organic acid catabolic process | 61/3467 | 240/18723 | 4.72e-03 | 3.31e-02 | 61 |
| GO:00442823 | Colorectum | FAP | small molecule catabolic process | 77/2622 | 376/18723 | 3.25e-04 | 4.16e-03 | 77 |
| GO:00160543 | Colorectum | FAP | organic acid catabolic process | 50/2622 | 240/18723 | 2.30e-03 | 1.85e-02 | 50 |
| GO:00463951 | Colorectum | FAP | carboxylic acid catabolic process | 48/2622 | 236/18723 | 4.53e-03 | 3.08e-02 | 48 |
| GO:004428221 | Liver | HCC | small molecule catabolic process | 225/7958 | 376/18723 | 6.50e-12 | 2.80e-10 | 225 |
| GO:001605421 | Liver | HCC | organic acid catabolic process | 152/7958 | 240/18723 | 5.11e-11 | 1.92e-09 | 152 |
| GO:00463952 | Liver | HCC | carboxylic acid catabolic process | 149/7958 | 236/18723 | 1.11e-10 | 3.87e-09 | 149 |
| GO:19016052 | Liver | HCC | alpha-amino acid metabolic process | 124/7958 | 195/18723 | 2.07e-09 | 5.79e-08 | 124 |
| GO:00065202 | Liver | HCC | cellular amino acid metabolic process | 167/7958 | 284/18723 | 1.91e-08 | 4.56e-07 | 167 |
| GO:00090632 | Liver | HCC | cellular amino acid catabolic process | 70/7958 | 110/18723 | 6.12e-06 | 7.52e-05 | 70 |
| GO:00090662 | Liver | HCC | aspartate family amino acid metabolic process | 34/7958 | 49/18723 | 1.28e-04 | 1.06e-03 | 34 |
| GO:19016062 | Liver | HCC | alpha-amino acid catabolic process | 53/7958 | 87/18723 | 4.01e-04 | 2.71e-03 | 53 |
| Page: 1 2 |
| Pathway ID | Tissue | Disease Stage | Description | Gene Ratio | Bg Ratio | pvalue | p.adjust | qvalue | Count |
| Page: 1 |
Top |
Cell-cell communication analysis |
| Identification of potential cell-cell interactions between two cell types and their ligand-receptor pairs for different disease states |
| Ligand | Receptor | LRpair | Pathway | Tissue | Disease Stage |
| Page: 1 |
Top |
Single-cell gene regulatory network inference analysis |
| Find out the significant the regulons (TFs) and the target genes of each regulon across cell types for different disease states |
| TF | Cell Type | Tissue | Disease Stage | Target Gene | RSS | Regulon Activity |
| ∗The dot plots of a searched regulon are shown for all cell subpopulations in each disease state of each tissue based on the regulon specific score inferred using pySCENIC and by calculating the average expression. |
| Page: 1 |
Top |
Somatic mutation of malignant transformation related genes |
| Annotation of somatic variants for genes involved in malignant transformation |
| Hugo Symbol | Variant Class | Variant Classification | dbSNP RS | HGVSc | HGVSp | HGVSp Short | SWISSPROT | BIOTYPE | SIFT | PolyPhen | Tumor Sample Barcode | Tissue | Histology | Sex | Age | Stage | Therapy Types | Drugs | Outcome |
| ASRGL1 | SNV | Missense_Mutation | novel | c.841A>C | p.Thr281Pro | p.T281P | Q7L266 | protein_coding | tolerated(0.21) | benign(0) | TCGA-A2-A25A-01 | Breast | breast invasive carcinoma | Female | <65 | I/II | Unspecific | Cytoxan | SD |
| ASRGL1 | SNV | Missense_Mutation | c.736N>C | p.Glu246Gln | p.E246Q | Q7L266 | protein_coding | tolerated(0.23) | benign(0.145) | TCGA-A8-A07U-01 | Breast | breast invasive carcinoma | Female | >=65 | III/IV | Chemotherapy | 5-fluorouracil | SD | |
| ASRGL1 | SNV | Missense_Mutation | rs748211190 | c.901N>A | p.Asp301Asn | p.D301N | Q7L266 | protein_coding | deleterious(0.01) | benign(0.037) | TCGA-2W-A8YY-01 | Cervix | cervical & endocervical cancer | Female | <65 | I/II | Chemotherapy | cisplatin | CR |
| ASRGL1 | SNV | Missense_Mutation | c.826G>A | p.Ala276Thr | p.A276T | Q7L266 | protein_coding | tolerated(0.18) | benign(0.043) | TCGA-CK-4951-01 | Colorectum | colon adenocarcinoma | Female | >=65 | I/II | Unknown | Unknown | PD | |
| ASRGL1 | SNV | Missense_Mutation | rs777549556 | c.646N>A | p.Val216Ile | p.V216I | Q7L266 | protein_coding | tolerated(0.34) | benign(0.05) | TCGA-CM-6162-01 | Colorectum | colon adenocarcinoma | Female | <65 | III/IV | Chemotherapy | oxaliplatin | SD |
| ASRGL1 | SNV | Missense_Mutation | rs778634465 | c.338C>T | p.Pro113Leu | p.P113L | Q7L266 | protein_coding | deleterious(0.03) | possibly_damaging(0.616) | TCGA-A5-A0G1-01 | Endometrium | uterine corpus endometrioid carcinoma | Female | >=65 | I/II | Unknown | Unknown | SD |
| ASRGL1 | SNV | Missense_Mutation | novel | c.469N>A | p.Ala157Thr | p.A157T | Q7L266 | protein_coding | tolerated(0.16) | benign(0.038) | TCGA-A5-A0G2-01 | Endometrium | uterine corpus endometrioid carcinoma | Female | <65 | III/IV | Unknown | Unknown | SD |
| ASRGL1 | SNV | Missense_Mutation | rs748211190 | c.901G>A | p.Asp301Asn | p.D301N | Q7L266 | protein_coding | deleterious(0.01) | benign(0.037) | TCGA-AJ-A3EL-01 | Endometrium | uterine corpus endometrioid carcinoma | Female | <65 | I/II | Unknown | Unknown | SD |
| ASRGL1 | SNV | Missense_Mutation | rs200906420 | c.568G>A | p.Val190Ile | p.V190I | Q7L266 | protein_coding | tolerated(0.38) | benign(0.005) | TCGA-AJ-A5DW-01 | Endometrium | uterine corpus endometrioid carcinoma | Female | <65 | I/II | Unknown | Unknown | SD |
| ASRGL1 | SNV | Missense_Mutation | novel | c.773N>T | p.Arg258Met | p.R258M | Q7L266 | protein_coding | deleterious(0) | possibly_damaging(0.852) | TCGA-AP-A1DK-01 | Endometrium | uterine corpus endometrioid carcinoma | Female | <65 | I/II | Unknown | Unknown | SD |
| Page: 1 2 3 |
Top |
Related drugs of malignant transformation related genes |
| Identification of chemicals and drugs interact with genes involved in malignant transfromation |
| (DGIdb 4.0) |
| Entrez ID | Symbol | Category | Interaction Types | Drug Claim Name | Drug Name | PMIDs |
| Page: 1 |

Copyright 2023-Present -The University of Texas Health Science Center at Houston |