
|
|||||
|
 | |
| |
| |
| |
| |
| |
|
Gene: ASPSCR1 |
Gene summary for ASPSCR1 |
| Gene information | Species | Human | Gene symbol | ASPSCR1 | Gene ID | 79058 |
| Gene name | ASPSCR1 tether for SLC2A4, UBX domain containing | |
| Gene Alias | ASPCR1 | |
| Cytomap | 17q25.3 | |
| Gene Type | protein-coding | GO ID | GO:0006464 | UniProtAcc | Q9BZE9 |
Top |
Malignant transformation analysis |
| Identification of the aberrant gene expression in precancerous and cancerous lesions by comparing the gene expression of stem-like cells in diseased tissues with normal stem cells |
| Entrez ID | Symbol | Replicates | Species | Organ | Tissue | Adj P-value | Log2FC | Malignancy |
| 79058 | ASPSCR1 | HTA11_696_2000001011 | Human | Colorectum | AD | 6.92e-03 | 2.46e-01 | -0.1464 |
| 79058 | ASPSCR1 | HTA11_1391_2000001011 | Human | Colorectum | AD | 6.92e-03 | 2.54e-01 | -0.059 |
| 79058 | ASPSCR1 | HTA11_99999974143_84620 | Human | Colorectum | MSS | 1.76e-24 | 7.52e-01 | 0.3005 |
| 79058 | ASPSCR1 | A001-C-007 | Human | Colorectum | CRC | 1.99e-02 | 4.42e-01 | 0.1899 |
| 79058 | ASPSCR1 | CRC-1-8810 | Human | Colorectum | CRC | 3.45e-34 | 8.81e-01 | 0.6257 |
| 79058 | ASPSCR1 | LZE3D | Human | Esophagus | HGIN | 4.44e-02 | 4.50e-01 | 0.0668 |
| 79058 | ASPSCR1 | LZE4T | Human | Esophagus | ESCC | 1.93e-07 | 1.67e-01 | 0.0811 |
| 79058 | ASPSCR1 | LZE5T | Human | Esophagus | ESCC | 8.83e-03 | 1.87e-01 | 0.0514 |
| 79058 | ASPSCR1 | LZE7T | Human | Esophagus | ESCC | 3.65e-17 | 7.26e-01 | 0.0667 |
| 79058 | ASPSCR1 | LZE20T | Human | Esophagus | ESCC | 8.50e-03 | 1.29e-01 | 0.0662 |
| 79058 | ASPSCR1 | LZE21D1 | Human | Esophagus | HGIN | 5.02e-04 | 2.95e-01 | 0.0632 |
| 79058 | ASPSCR1 | LZE22D1 | Human | Esophagus | HGIN | 4.68e-07 | 2.56e-01 | 0.0595 |
| 79058 | ASPSCR1 | LZE22T | Human | Esophagus | ESCC | 5.12e-12 | 4.79e-01 | 0.068 |
| 79058 | ASPSCR1 | LZE24T | Human | Esophagus | ESCC | 5.55e-38 | 7.75e-01 | 0.0596 |
| 79058 | ASPSCR1 | LZE21T | Human | Esophagus | ESCC | 6.13e-07 | 3.93e-01 | 0.0655 |
| 79058 | ASPSCR1 | P1T-E | Human | Esophagus | ESCC | 6.02e-10 | 3.29e-01 | 0.0875 |
| 79058 | ASPSCR1 | P2T-E | Human | Esophagus | ESCC | 2.29e-36 | 5.64e-01 | 0.1177 |
| 79058 | ASPSCR1 | P4T-E | Human | Esophagus | ESCC | 1.75e-15 | 3.28e-01 | 0.1323 |
| 79058 | ASPSCR1 | P5T-E | Human | Esophagus | ESCC | 3.20e-16 | 2.84e-01 | 0.1327 |
| 79058 | ASPSCR1 | P8T-E | Human | Esophagus | ESCC | 1.15e-45 | 7.13e-01 | 0.0889 |
| Page: 1 2 3 4 5 6 7 |
| Tissue | Expression Dynamics | Abbreviation |
| Colorectum (GSE201348) |  | FAP: Familial adenomatous polyposis |
| CRC: Colorectal cancer | ||
| Colorectum (HTA11) |  | AD: Adenomas |
| SER: Sessile serrated lesions | ||
| MSI-H: Microsatellite-high colorectal cancer | ||
| MSS: Microsatellite stable colorectal cancer | ||
| Esophagus |  | ESCC: Esophageal squamous cell carcinoma |
| HGIN: High-grade intraepithelial neoplasias | ||
| LGIN: Low-grade intraepithelial neoplasias | ||
| Liver |  | HCC: Hepatocellular carcinoma |
| NAFLD: Non-alcoholic fatty liver disease | ||
| Oral Cavity | 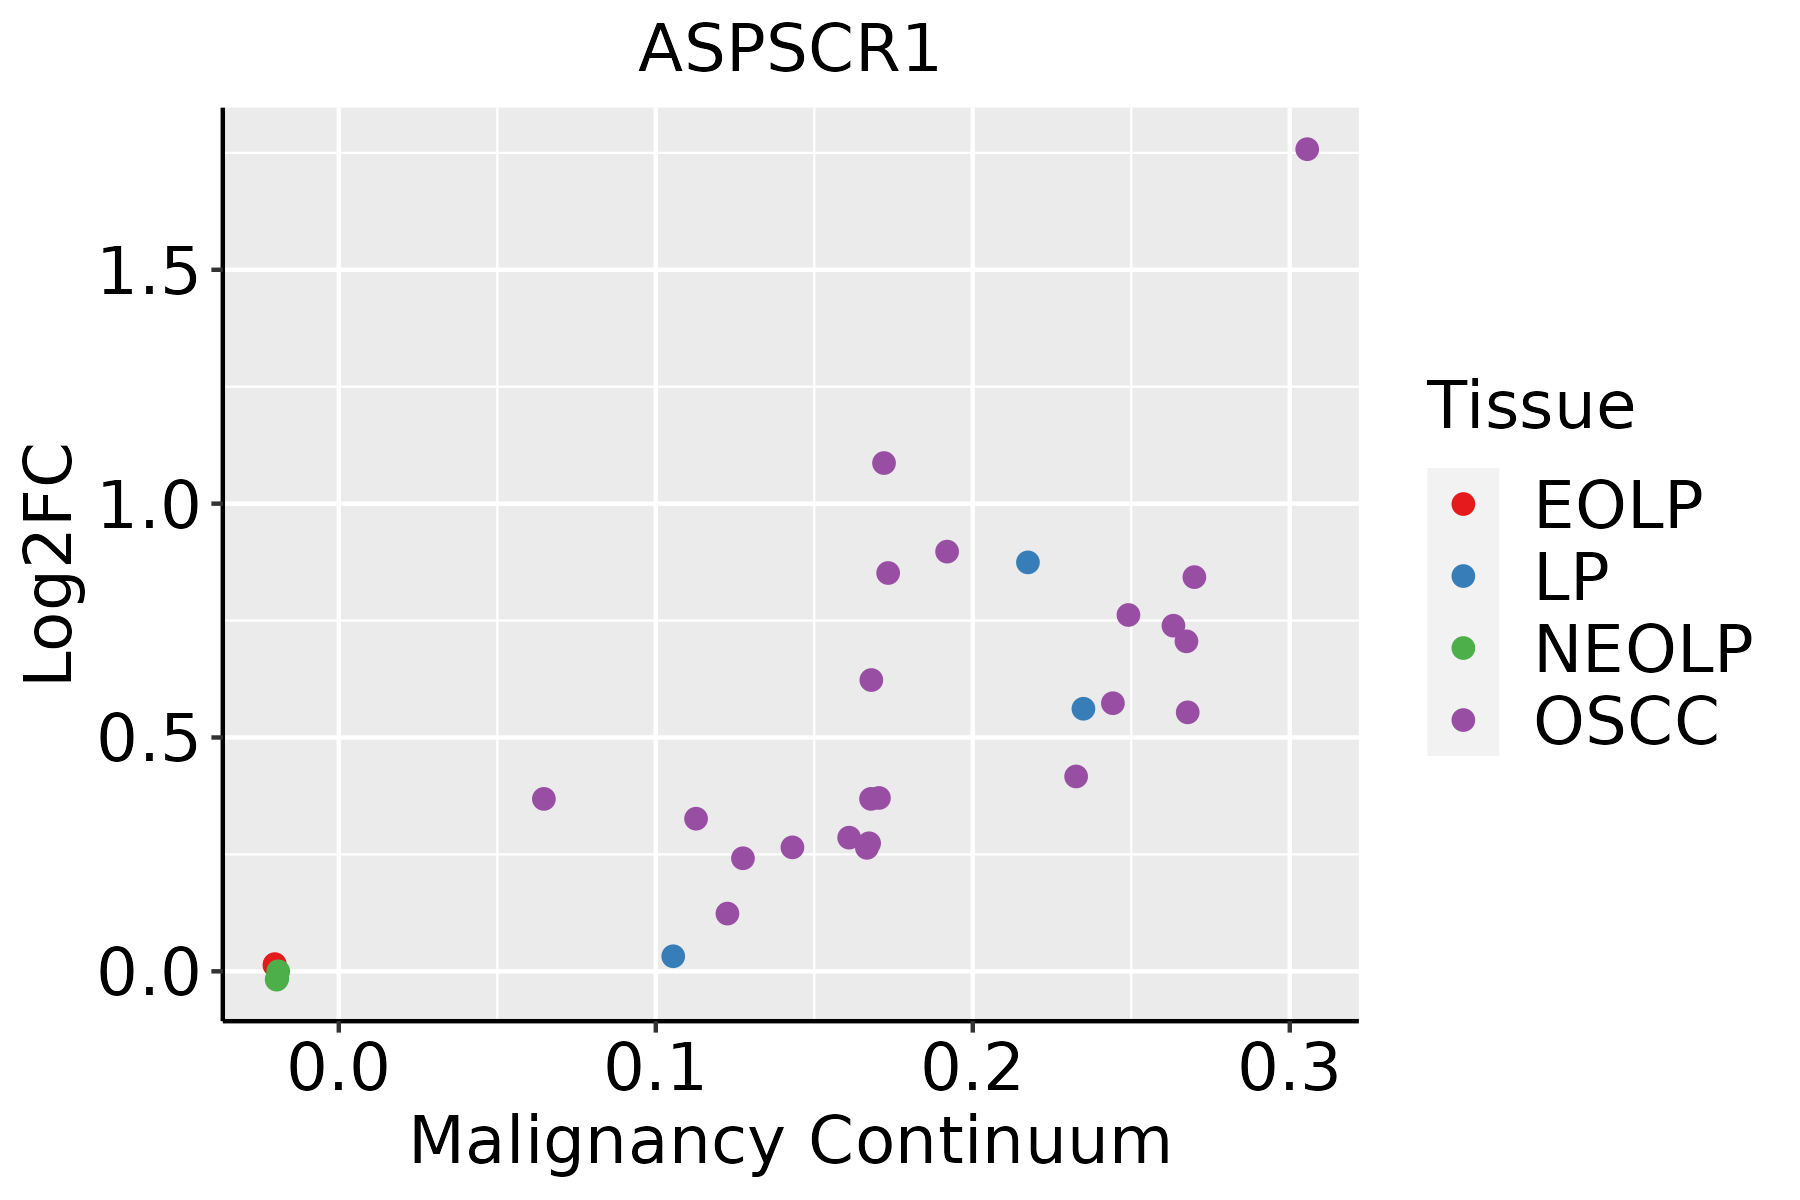 | EOLP: Erosive Oral lichen planus |
| LP: leukoplakia | ||
| NEOLP: Non-erosive oral lichen planus | ||
| OSCC: Oral squamous cell carcinoma | ||
| Skin |  | AK: Actinic keratosis |
| cSCC: Cutaneous squamous cell carcinoma | ||
| SCCIS:squamous cell carcinoma in situ | ||
| Thyroid | 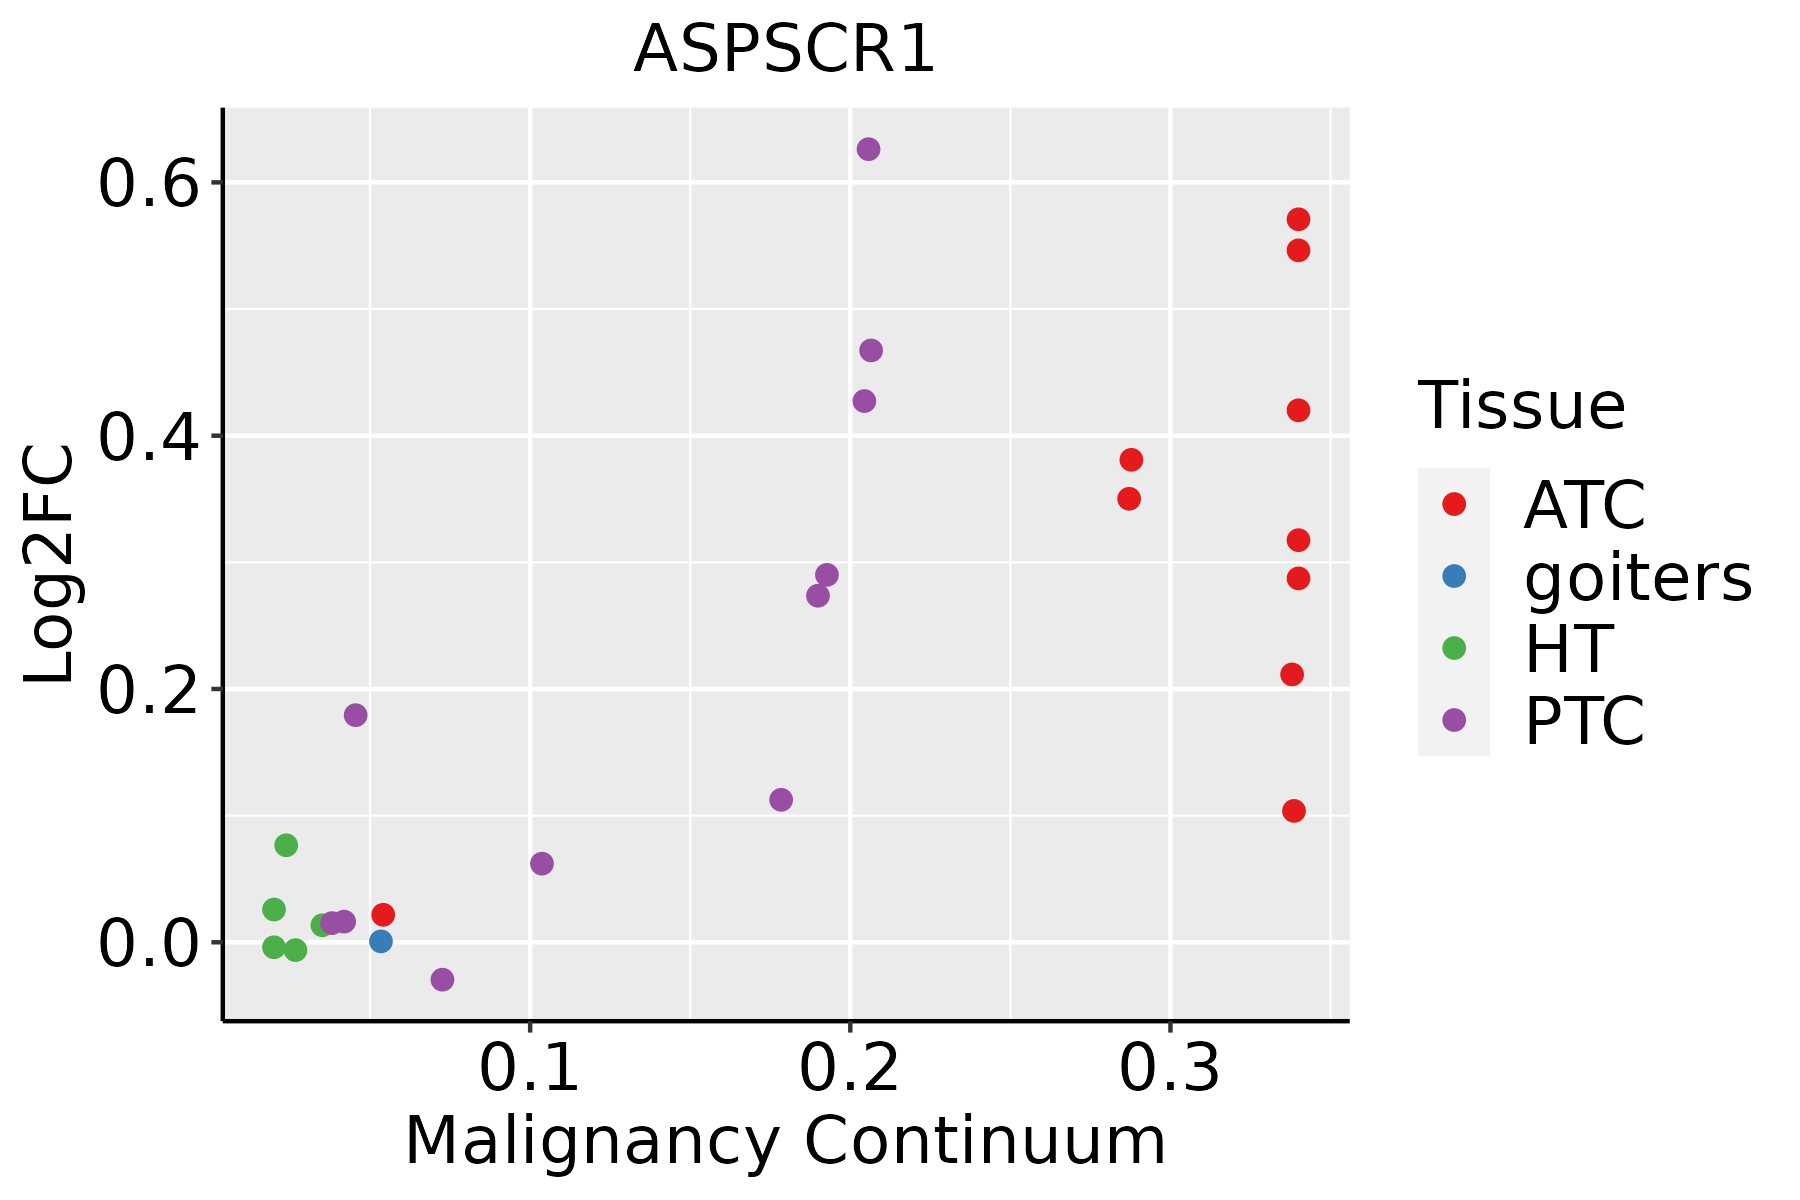 | ATC: Anaplastic thyroid cancer |
| HT: Hashimoto's thyroiditis | ||
| PTC: Papillary thyroid cancer |
| ∗log2FC in expression of this searched gene in stem-like cells from each diseased tissue sample relative to stem-like cells in normal samples in each tissue plotted against the malignancy continuum. Samples are colored based on if they are from different disease stage. |
Top |
Malignant transformation related pathway analysis |
| Find out the enriched GO biological processes and KEGG pathways involved in transition from healthy to precancer to cancer |
| Tissue | Disease Stage | Enriched GO biological Processes |
| Colorectum | AD |  |
| Colorectum | SER |  |
| Colorectum | MSS |  |
| Colorectum | MSI-H |  |
| Colorectum | FAP |  |
| ∗Top 15 enriched GO BP terms are showed in the bar plot of each disease state in each tissue. Each row represents a significant GO biological process which is colored according to the -log10(p.adjust). |
| Page: 1 2 3 4 5 6 7 8 9 |
| GO ID | Tissue | Disease Stage | Description | Gene Ratio | Bg Ratio | pvalue | p.adjust | Count |
| GO:0033500 | Colorectum | AD | carbohydrate homeostasis | 84/3918 | 259/18723 | 9.10e-06 | 2.15e-04 | 84 |
| GO:0042593 | Colorectum | AD | glucose homeostasis | 83/3918 | 258/18723 | 1.44e-05 | 3.11e-04 | 83 |
| GO:00335002 | Colorectum | MSS | carbohydrate homeostasis | 76/3467 | 259/18723 | 1.37e-05 | 3.14e-04 | 76 |
| GO:00425932 | Colorectum | MSS | glucose homeostasis | 75/3467 | 258/18723 | 2.22e-05 | 4.69e-04 | 75 |
| GO:00335004 | Colorectum | CRC | carbohydrate homeostasis | 49/2078 | 259/18723 | 1.29e-04 | 2.46e-03 | 49 |
| GO:00425934 | Colorectum | CRC | glucose homeostasis | 48/2078 | 258/18723 | 2.27e-04 | 3.78e-03 | 48 |
| GO:004259312 | Liver | Cirrhotic | glucose homeostasis | 86/4634 | 258/18723 | 1.12e-03 | 7.73e-03 | 86 |
| GO:003350012 | Liver | Cirrhotic | carbohydrate homeostasis | 86/4634 | 259/18723 | 1.28e-03 | 8.61e-03 | 86 |
| GO:004259322 | Liver | HCC | glucose homeostasis | 137/7958 | 258/18723 | 3.59e-04 | 2.49e-03 | 137 |
| GO:003350022 | Liver | HCC | carbohydrate homeostasis | 137/7958 | 259/18723 | 4.45e-04 | 2.98e-03 | 137 |
| GO:0008643 | Liver | HCC | carbohydrate transport | 80/7958 | 152/18723 | 7.34e-03 | 2.92e-02 | 80 |
| GO:004259316 | Oral cavity | OSCC | glucose homeostasis | 125/7305 | 258/18723 | 1.21e-03 | 6.08e-03 | 125 |
| GO:003350016 | Oral cavity | OSCC | carbohydrate homeostasis | 125/7305 | 259/18723 | 1.44e-03 | 6.97e-03 | 125 |
| GO:0033500110 | Thyroid | PTC | carbohydrate homeostasis | 103/5968 | 259/18723 | 4.19e-03 | 1.99e-02 | 103 |
| GO:0042593110 | Thyroid | PTC | glucose homeostasis | 102/5968 | 258/18723 | 5.34e-03 | 2.46e-02 | 102 |
| GO:003350024 | Thyroid | ATC | carbohydrate homeostasis | 109/6293 | 259/18723 | 2.56e-03 | 1.18e-02 | 109 |
| GO:004259325 | Thyroid | ATC | glucose homeostasis | 108/6293 | 258/18723 | 3.27e-03 | 1.47e-02 | 108 |
| Page: 1 |
| Pathway ID | Tissue | Disease Stage | Description | Gene Ratio | Bg Ratio | pvalue | p.adjust | qvalue | Count |
| hsa052028 | Esophagus | ESCC | Transcriptional misregulation in cancer | 116/4205 | 193/8465 | 2.08e-03 | 5.95e-03 | 3.05e-03 | 116 |
| hsa0520213 | Esophagus | ESCC | Transcriptional misregulation in cancer | 116/4205 | 193/8465 | 2.08e-03 | 5.95e-03 | 3.05e-03 | 116 |
| Page: 1 |
Top |
Cell-cell communication analysis |
| Identification of potential cell-cell interactions between two cell types and their ligand-receptor pairs for different disease states |
| Ligand | Receptor | LRpair | Pathway | Tissue | Disease Stage |
| Page: 1 |
Top |
Single-cell gene regulatory network inference analysis |
| Find out the significant the regulons (TFs) and the target genes of each regulon across cell types for different disease states |
| TF | Cell Type | Tissue | Disease Stage | Target Gene | RSS | Regulon Activity |
| ∗The dot plots of a searched regulon are shown for all cell subpopulations in each disease state of each tissue based on the regulon specific score inferred using pySCENIC and by calculating the average expression. |
| Page: 1 |
Top |
Somatic mutation of malignant transformation related genes |
| Annotation of somatic variants for genes involved in malignant transformation |
| Hugo Symbol | Variant Class | Variant Classification | dbSNP RS | HGVSc | HGVSp | HGVSp Short | SWISSPROT | BIOTYPE | SIFT | PolyPhen | Tumor Sample Barcode | Tissue | Histology | Sex | Age | Stage | Therapy Types | Drugs | Outcome |
| ASPSCR1 | SNV | Missense_Mutation | novel | c.185N>A | p.Ser62Tyr | p.S62Y | Q9BZE9 | protein_coding | deleterious(0) | possibly_damaging(0.827) | TCGA-AN-A046-01 | Breast | breast invasive carcinoma | Female | >=65 | I/II | Unknown | Unknown | SD |
| ASPSCR1 | SNV | Missense_Mutation | c.1094N>A | p.Arg365His | p.R365H | Q9BZE9 | protein_coding | tolerated(0.05) | probably_damaging(0.929) | TCGA-AO-A128-01 | Breast | breast invasive carcinoma | Female | <65 | I/II | Chemotherapy | doxorubicin | SD | |
| ASPSCR1 | SNV | Missense_Mutation | novel | c.1586G>A | p.Gly529Asp | p.G529D | Q9BZE9 | protein_coding | tolerated_low_confidence(0.06) | benign(0.192) | TCGA-E2-A2P6-01 | Breast | breast invasive carcinoma | Female | >=65 | I/II | Hormone Therapy | anastrozole | SD |
| ASPSCR1 | deletion | Frame_Shift_Del | novel | c.1221delN | p.Arg408AlafsTer13 | p.R408Afs*13 | Q9BZE9 | protein_coding | TCGA-D8-A27V-01 | Breast | breast invasive carcinoma | Female | <65 | I/II | Hormone Therapy | tamoxiphen | SD | ||
| ASPSCR1 | SNV | Missense_Mutation | rs149772045 | c.278N>A | p.Arg93His | p.R93H | Q9BZE9 | protein_coding | deleterious(0) | probably_damaging(0.997) | TCGA-2W-A8YY-01 | Cervix | cervical & endocervical cancer | Female | <65 | I/II | Chemotherapy | cisplatin | CR |
| ASPSCR1 | SNV | Missense_Mutation | novel | c.794N>A | p.Ser265Tyr | p.S265Y | Q9BZE9 | protein_coding | deleterious(0.03) | possibly_damaging(0.66) | TCGA-2W-A8YY-01 | Cervix | cervical & endocervical cancer | Female | <65 | I/II | Chemotherapy | cisplatin | CR |
| ASPSCR1 | SNV | Missense_Mutation | c.907N>T | p.Pro303Ser | p.P303S | Q9BZE9 | protein_coding | tolerated(0.42) | benign(0) | TCGA-DG-A2KK-01 | Cervix | cervical & endocervical cancer | Female | <65 | III/IV | Chemotherapy | cisplatin | SD | |
| ASPSCR1 | SNV | Missense_Mutation | rs767476847 | c.1531C>T | p.Pro511Ser | p.P511S | Q9BZE9 | protein_coding | tolerated_low_confidence(0.35) | benign(0.017) | TCGA-JX-A3Q0-01 | Cervix | cervical & endocervical cancer | Female | <65 | III/IV | Unknown | Unknown | SD |
| ASPSCR1 | SNV | Missense_Mutation | c.1420N>C | p.Glu474Gln | p.E474Q | Q9BZE9 | protein_coding | tolerated_low_confidence(0.27) | benign(0.02) | TCGA-Q1-A73O-01 | Cervix | cervical & endocervical cancer | Female | <65 | I/II | Chemotherapy | cisplatin | CR | |
| ASPSCR1 | SNV | Missense_Mutation | novel | c.299A>G | p.Asp100Gly | p.D100G | Q9BZE9 | protein_coding | deleterious(0) | probably_damaging(0.998) | TCGA-AA-3949-01 | Colorectum | colon adenocarcinoma | Female | >=65 | III/IV | Unknown | Unknown | SD |
| Page: 1 2 3 4 5 6 |
Top |
Related drugs of malignant transformation related genes |
| Identification of chemicals and drugs interact with genes involved in malignant transfromation |
| (DGIdb 4.0) |
| Entrez ID | Symbol | Category | Interaction Types | Drug Claim Name | Drug Name | PMIDs |
| Page: 1 |

Copyright 2023-Present -The University of Texas Health Science Center at Houston |