
|
|||||
|
 | |
| |
| |
| |
| |
| |
|
Gene: ASPN |
Gene summary for ASPN |
| Gene information | Species | Human | Gene symbol | ASPN | Gene ID | 54829 |
| Gene name | asporin | |
| Gene Alias | OS3 | |
| Cytomap | 9q22.31 | |
| Gene Type | protein-coding | GO ID | GO:0001503 | UniProtAcc | Q9BXN1 |
Top |
Malignant transformation analysis |
| Identification of the aberrant gene expression in precancerous and cancerous lesions by comparing the gene expression of stem-like cells in diseased tissues with normal stem cells |
| Entrez ID | Symbol | Replicates | Species | Organ | Tissue | Adj P-value | Log2FC | Malignancy |
| 54829 | ASPN | P8T-E | Human | Esophagus | ESCC | 7.90e-03 | 2.53e-01 | 0.0889 |
| 54829 | ASPN | P9T-E | Human | Esophagus | ESCC | 3.05e-07 | 9.19e-01 | 0.1131 |
| 54829 | ASPN | P22T-E | Human | Esophagus | ESCC | 3.75e-03 | 3.89e-01 | 0.1236 |
| 54829 | ASPN | P42T-E | Human | Esophagus | ESCC | 9.05e-04 | 5.37e-01 | 0.1175 |
| 54829 | ASPN | P1_cSCC | Human | Skin | cSCC | 5.98e-19 | 1.31e+00 | 0.0292 |
| 54829 | ASPN | P4_cSCC | Human | Skin | cSCC | 1.28e-12 | 7.25e-01 | -0.00290000000000005 |
| 54829 | ASPN | cSCC_p1 | Human | Skin | cSCC | 9.29e-03 | 2.96e-01 | -0.1916 |
| 54829 | ASPN | ATC13 | Human | Thyroid | ATC | 3.09e-139 | 4.22e+00 | 0.34 |
| 54829 | ASPN | ATC5 | Human | Thyroid | ATC | 3.93e-138 | 4.29e+00 | 0.34 |
| Page: 1 |
| Tissue | Expression Dynamics | Abbreviation |
| Esophagus | 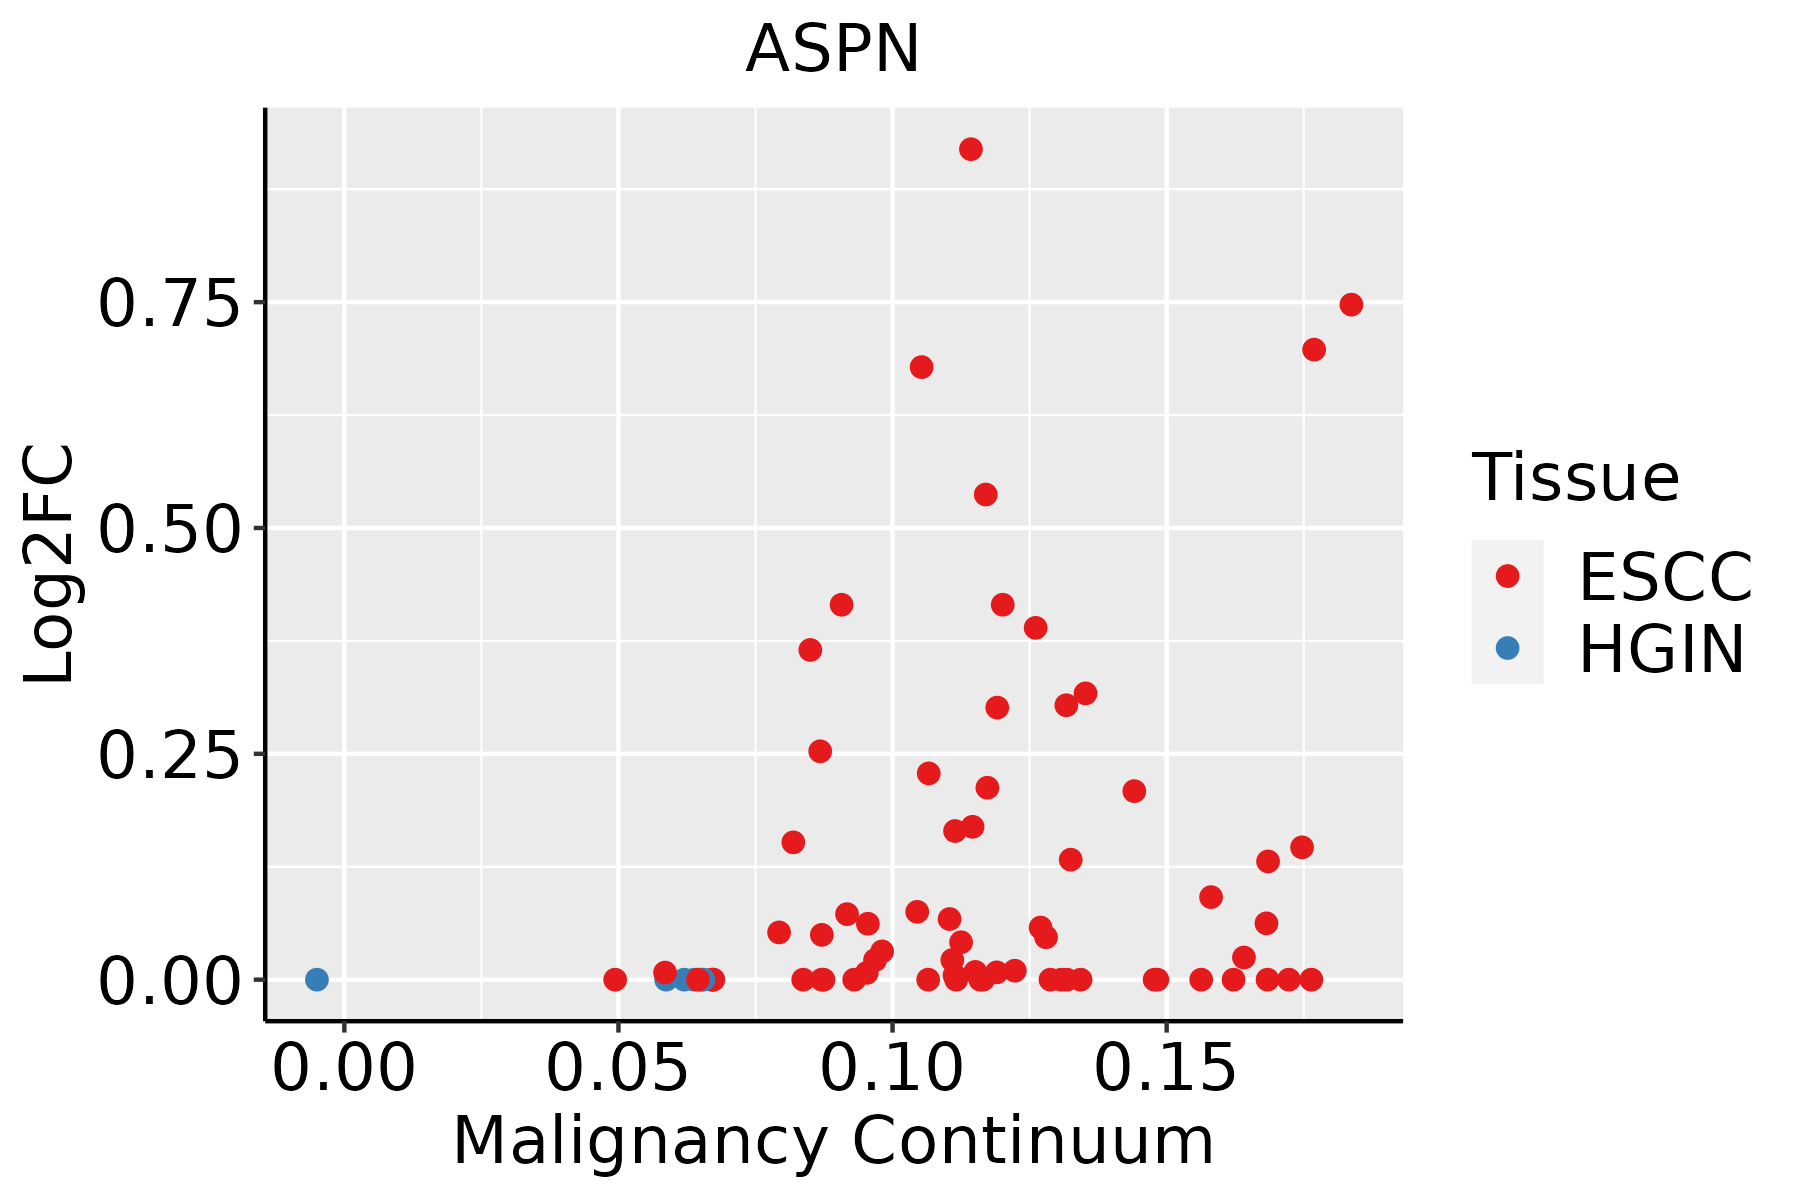 | ESCC: Esophageal squamous cell carcinoma |
| HGIN: High-grade intraepithelial neoplasias | ||
| LGIN: Low-grade intraepithelial neoplasias | ||
| Skin |  | AK: Actinic keratosis |
| cSCC: Cutaneous squamous cell carcinoma | ||
| SCCIS:squamous cell carcinoma in situ | ||
| Thyroid | 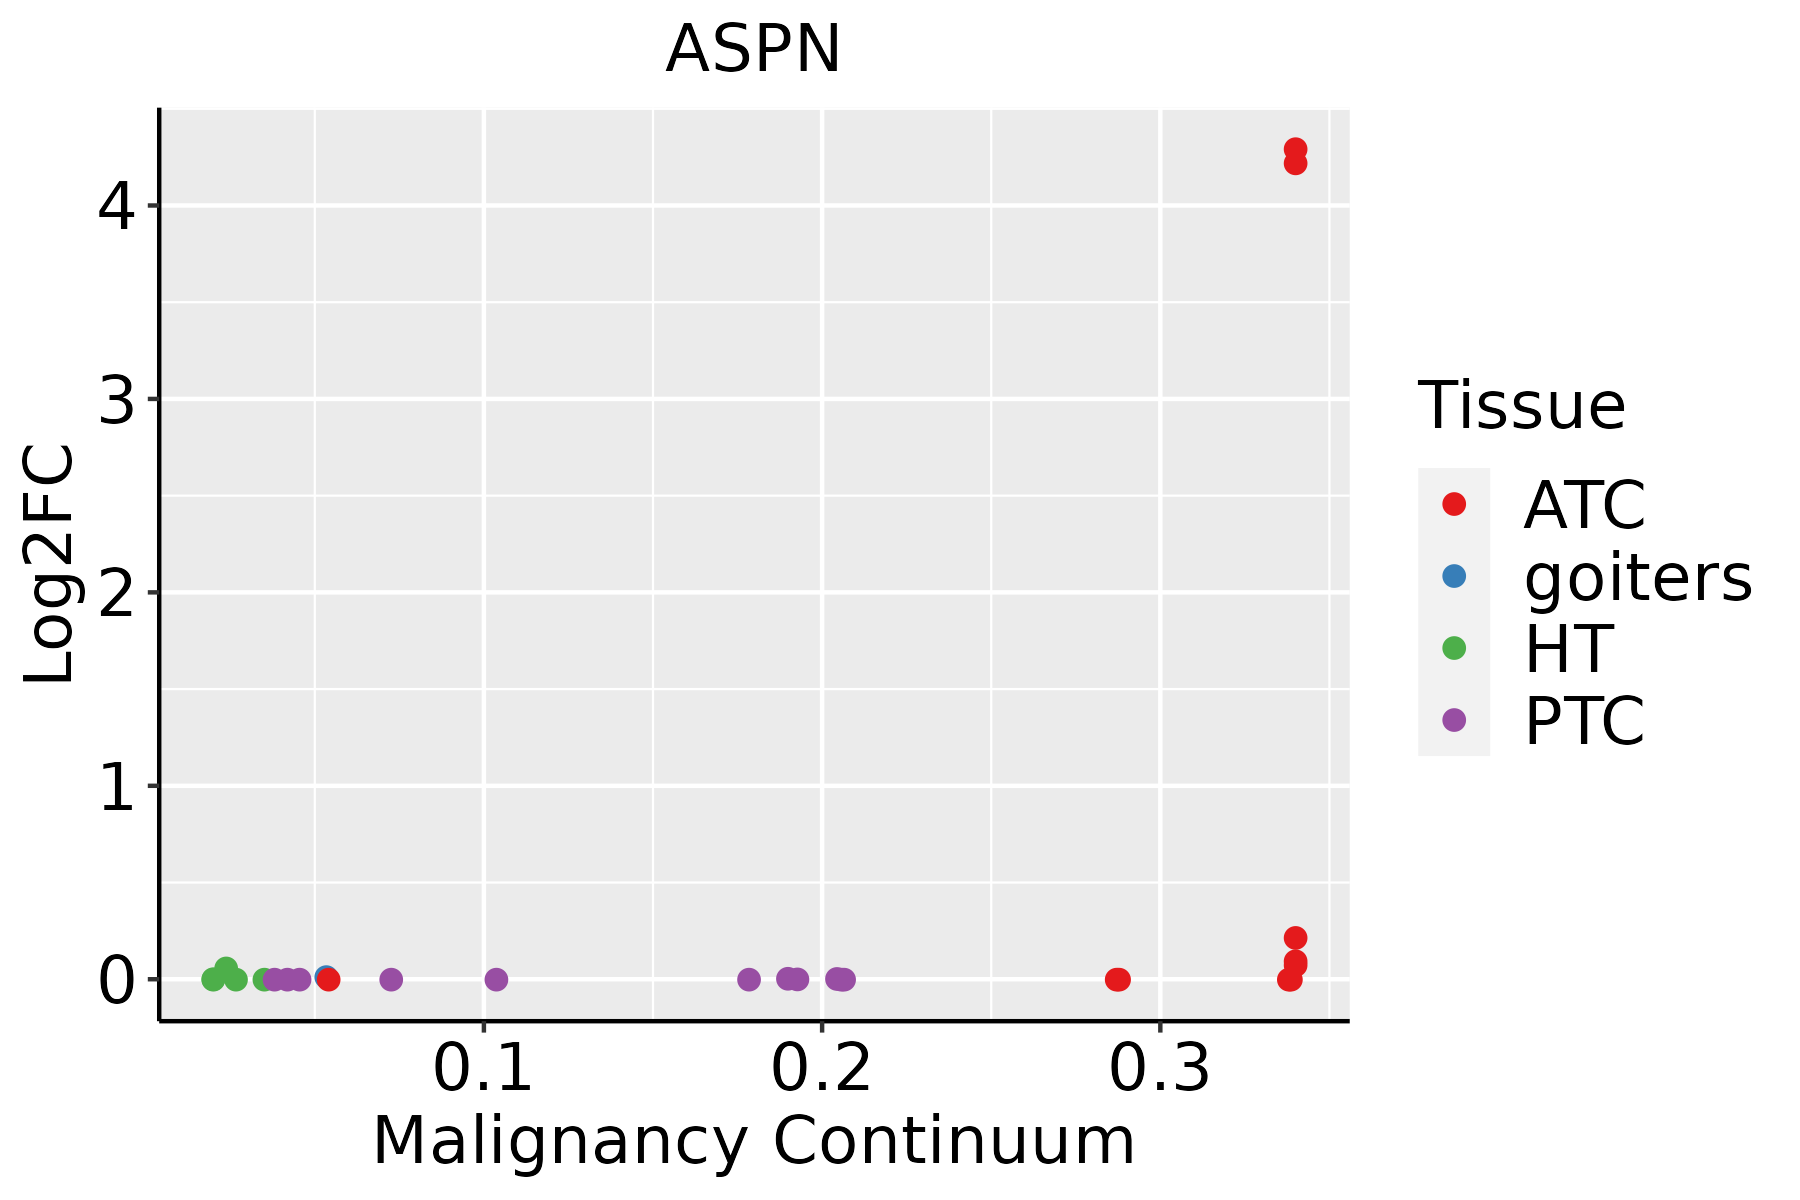 | ATC: Anaplastic thyroid cancer |
| HT: Hashimoto's thyroiditis | ||
| PTC: Papillary thyroid cancer |
| ∗log2FC in expression of this searched gene in stem-like cells from each diseased tissue sample relative to stem-like cells in normal samples in each tissue plotted against the malignancy continuum. Samples are colored based on if they are from different disease stage. |
Top |
Malignant transformation related pathway analysis |
| Find out the enriched GO biological processes and KEGG pathways involved in transition from healthy to precancer to cancer |
| Tissue | Disease Stage | Enriched GO biological Processes |
| Colorectum | AD |  |
| Colorectum | SER |  |
| Colorectum | MSS |  |
| Colorectum | MSI-H |  |
| Colorectum | FAP |  |
| ∗Top 15 enriched GO BP terms are showed in the bar plot of each disease state in each tissue. Each row represents a significant GO biological process which is colored according to the -log10(p.adjust). |
| Page: 1 2 3 4 5 6 7 8 9 |
| GO ID | Tissue | Disease Stage | Description | Gene Ratio | Bg Ratio | pvalue | p.adjust | Count |
| GO:00715599 | Esophagus | ESCC | response to transforming growth factor beta | 157/8552 | 256/18723 | 2.95e-07 | 4.23e-06 | 157 |
| GO:00715609 | Esophagus | ESCC | cellular response to transforming growth factor beta stimulus | 151/8552 | 250/18723 | 1.78e-06 | 2.10e-05 | 151 |
| GO:000150317 | Esophagus | ESCC | ossification | 232/8552 | 408/18723 | 3.00e-06 | 3.40e-05 | 232 |
| GO:00071799 | Esophagus | ESCC | transforming growth factor beta receptor signaling pathway | 121/8552 | 198/18723 | 8.26e-06 | 8.03e-05 | 121 |
| GO:000717810 | Esophagus | ESCC | transmembrane receptor protein serine/threonine kinase signaling pathway | 195/8552 | 355/18723 | 2.58e-04 | 1.58e-03 | 195 |
| GO:00170156 | Esophagus | ESCC | regulation of transforming growth factor beta receptor signaling pathway | 75/8552 | 128/18723 | 2.19e-03 | 9.71e-03 | 75 |
| GO:19038447 | Esophagus | ESCC | regulation of cellular response to transforming growth factor beta stimulus | 76/8552 | 131/18723 | 2.96e-03 | 1.24e-02 | 76 |
| GO:007155917 | Skin | cSCC | response to transforming growth factor beta | 95/4864 | 256/18723 | 5.21e-05 | 5.31e-04 | 95 |
| GO:007156025 | Skin | cSCC | cellular response to transforming growth factor beta stimulus | 92/4864 | 250/18723 | 9.65e-05 | 8.99e-04 | 92 |
| GO:000150323 | Skin | cSCC | ossification | 137/4864 | 408/18723 | 3.39e-04 | 2.68e-03 | 137 |
| GO:000717917 | Skin | cSCC | transforming growth factor beta receptor signaling pathway | 69/4864 | 198/18723 | 3.39e-03 | 1.84e-02 | 69 |
| GO:007155925 | Thyroid | ATC | response to transforming growth factor beta | 142/6293 | 256/18723 | 4.30e-13 | 1.94e-11 | 142 |
| GO:000150332 | Thyroid | ATC | ossification | 206/6293 | 408/18723 | 9.23e-13 | 3.95e-11 | 206 |
| GO:007156026 | Thyroid | ATC | cellular response to transforming growth factor beta stimulus | 137/6293 | 250/18723 | 3.69e-12 | 1.49e-10 | 137 |
| GO:000717924 | Thyroid | ATC | transforming growth factor beta receptor signaling pathway | 112/6293 | 198/18723 | 2.42e-11 | 8.44e-10 | 112 |
| GO:000717823 | Thyroid | ATC | transmembrane receptor protein serine/threonine kinase signaling pathway | 170/6293 | 355/18723 | 1.40e-08 | 2.87e-07 | 170 |
| GO:001701522 | Thyroid | ATC | regulation of transforming growth factor beta receptor signaling pathway | 74/6293 | 128/18723 | 1.58e-08 | 3.20e-07 | 74 |
| GO:190384422 | Thyroid | ATC | regulation of cellular response to transforming growth factor beta stimulus | 75/6293 | 131/18723 | 2.26e-08 | 4.39e-07 | 75 |
| GO:009028721 | Thyroid | ATC | regulation of cellular response to growth factor stimulus | 140/6293 | 304/18723 | 3.91e-06 | 4.33e-05 | 140 |
| GO:009009214 | Thyroid | ATC | regulation of transmembrane receptor protein serine/threonine kinase signaling pathway | 120/6293 | 256/18723 | 6.62e-06 | 6.85e-05 | 120 |
| Page: 1 2 |
| Pathway ID | Tissue | Disease Stage | Description | Gene Ratio | Bg Ratio | pvalue | p.adjust | qvalue | Count |
| Page: 1 |
Top |
Cell-cell communication analysis |
| Identification of potential cell-cell interactions between two cell types and their ligand-receptor pairs for different disease states |
| Ligand | Receptor | LRpair | Pathway | Tissue | Disease Stage |
| Page: 1 |
Top |
Single-cell gene regulatory network inference analysis |
| Find out the significant the regulons (TFs) and the target genes of each regulon across cell types for different disease states |
| TF | Cell Type | Tissue | Disease Stage | Target Gene | RSS | Regulon Activity |
| ∗The dot plots of a searched regulon are shown for all cell subpopulations in each disease state of each tissue based on the regulon specific score inferred using pySCENIC and by calculating the average expression. |
| Page: 1 |
Top |
Somatic mutation of malignant transformation related genes |
| Annotation of somatic variants for genes involved in malignant transformation |
| Hugo Symbol | Variant Class | Variant Classification | dbSNP RS | HGVSc | HGVSp | HGVSp Short | SWISSPROT | BIOTYPE | SIFT | PolyPhen | Tumor Sample Barcode | Tissue | Histology | Sex | Age | Stage | Therapy Types | Drugs | Outcome |
| ASPN | SNV | Missense_Mutation | c.620N>A | p.Leu207His | p.L207H | Q9BXN1 | protein_coding | deleterious(0) | probably_damaging(0.999) | TCGA-E9-A1NA-01 | Breast | breast invasive carcinoma | Female | <65 | I/II | Chemotherapy | cyclophosphamide | SD | |
| ASPN | SNV | Missense_Mutation | c.1025C>G | p.Ser342Cys | p.S342C | Q9BXN1 | protein_coding | deleterious(0) | possibly_damaging(0.682) | TCGA-C5-A1BQ-01 | Cervix | cervical & endocervical cancer | Female | >=65 | III/IV | Chemotherapy | cisplatin | CR | |
| ASPN | SNV | Missense_Mutation | c.977G>C | p.Arg326Thr | p.R326T | Q9BXN1 | protein_coding | tolerated(0.27) | benign(0) | TCGA-DR-A0ZM-01 | Cervix | cervical & endocervical cancer | Female | <65 | III/IV | Unspecific | Cisplatin | SD | |
| ASPN | SNV | Missense_Mutation | novel | c.191G>T | p.Ser64Ile | p.S64I | Q9BXN1 | protein_coding | tolerated(0.29) | benign(0) | TCGA-DS-A1OD-01 | Cervix | cervical & endocervical cancer | Female | <65 | I/II | Chemotherapy | cisplatin | SD |
| ASPN | SNV | Missense_Mutation | novel | c.190A>T | p.Ser64Cys | p.S64C | Q9BXN1 | protein_coding | tolerated(0.09) | benign(0.174) | TCGA-DS-A1OD-01 | Cervix | cervical & endocervical cancer | Female | <65 | I/II | Chemotherapy | cisplatin | SD |
| ASPN | SNV | Missense_Mutation | c.266N>T | p.Ser89Leu | p.S89L | Q9BXN1 | protein_coding | deleterious(0.01) | probably_damaging(0.999) | TCGA-IR-A3LH-01 | Cervix | cervical & endocervical cancer | Female | <65 | I/II | Chemotherapy | cisplatin | CR | |
| ASPN | SNV | Missense_Mutation | novel | c.61N>A | p.Pro21Thr | p.P21T | Q9BXN1 | protein_coding | tolerated(0.18) | probably_damaging(0.922) | TCGA-AA-3811-01 | Colorectum | colon adenocarcinoma | Female | >=65 | III/IV | Unknown | Unknown | PD |
| ASPN | SNV | Missense_Mutation | c.977G>T | p.Arg326Ile | p.R326I | Q9BXN1 | protein_coding | tolerated(0.08) | benign(0) | TCGA-CA-6717-01 | Colorectum | colon adenocarcinoma | Male | <65 | I/II | Chemotherapy | oxaliplatin | CR | |
| ASPN | SNV | Missense_Mutation | c.713N>A | p.Gly238Asp | p.G238D | Q9BXN1 | protein_coding | tolerated(0.86) | benign(0.001) | TCGA-CM-5861-01 | Colorectum | colon adenocarcinoma | Female | <65 | I/II | Unknown | Unknown | PD | |
| ASPN | SNV | Missense_Mutation | novel | c.582N>T | p.Met194Ile | p.M194I | Q9BXN1 | protein_coding | deleterious(0.04) | benign(0.009) | TCGA-EI-6917-01 | Colorectum | rectum adenocarcinoma | Male | <65 | III/IV | Chemotherapy | 5fluorouracil+oxaciplatina+l-folinian | SD |
| Page: 1 2 3 4 |
Top |
Related drugs of malignant transformation related genes |
| Identification of chemicals and drugs interact with genes involved in malignant transfromation |
| (DGIdb 4.0) |
| Entrez ID | Symbol | Category | Interaction Types | Drug Claim Name | Drug Name | PMIDs |
| Page: 1 |

Copyright 2023-Present -The University of Texas Health Science Center at Houston |