
|
|||||
|
 | |
| |
| |
| |
| |
| |
|
Gene: ASPM |
Gene summary for ASPM |
| Gene information | Species | Human | Gene symbol | ASPM | Gene ID | 259266 |
| Gene name | assembly factor for spindle microtubules | |
| Gene Alias | ASP | |
| Cytomap | 1q31.3 | |
| Gene Type | protein-coding | GO ID | GO:0000003 | UniProtAcc | B3KWI2 |
Top |
Malignant transformation analysis |
| Identification of the aberrant gene expression in precancerous and cancerous lesions by comparing the gene expression of stem-like cells in diseased tissues with normal stem cells |
| Entrez ID | Symbol | Replicates | Species | Organ | Tissue | Adj P-value | Log2FC | Malignancy |
| 259266 | ASPM | N_HPV_2 | Human | Cervix | N_HPV | 1.00e-03 | 1.09e-01 | -0.0131 |
| 259266 | ASPM | CCI_1 | Human | Cervix | CC | 9.24e-03 | 3.30e-01 | 0.528 |
| 259266 | ASPM | CCI_2 | Human | Cervix | CC | 3.19e-08 | 1.10e+00 | 0.5249 |
| 259266 | ASPM | CCI_3 | Human | Cervix | CC | 1.08e-12 | 1.03e+00 | 0.516 |
| 259266 | ASPM | Tumor | Human | Cervix | CC | 3.12e-05 | 1.69e-01 | 0.1241 |
| 259266 | ASPM | sample3 | Human | Cervix | CC | 1.83e-04 | 1.75e-01 | 0.1387 |
| 259266 | ASPM | T3 | Human | Cervix | CC | 1.68e-07 | 1.85e-01 | 0.1389 |
| 259266 | ASPM | LZE2T | Human | Esophagus | ESCC | 5.41e-13 | 1.30e+00 | 0.082 |
| 259266 | ASPM | LZE7T | Human | Esophagus | ESCC | 6.33e-03 | 2.45e-01 | 0.0667 |
| 259266 | ASPM | P1T-E | Human | Esophagus | ESCC | 2.97e-02 | 3.95e-01 | 0.0875 |
| 259266 | ASPM | P2T-E | Human | Esophagus | ESCC | 5.79e-16 | 7.89e-01 | 0.1177 |
| 259266 | ASPM | P4T-E | Human | Esophagus | ESCC | 7.21e-12 | 5.91e-01 | 0.1323 |
| 259266 | ASPM | P5T-E | Human | Esophagus | ESCC | 6.62e-20 | 5.48e-01 | 0.1327 |
| 259266 | ASPM | P9T-E | Human | Esophagus | ESCC | 3.05e-07 | 3.22e-01 | 0.1131 |
| 259266 | ASPM | P10T-E | Human | Esophagus | ESCC | 4.12e-11 | 6.00e-01 | 0.116 |
| 259266 | ASPM | P15T-E | Human | Esophagus | ESCC | 2.04e-07 | 3.72e-01 | 0.1149 |
| 259266 | ASPM | P16T-E | Human | Esophagus | ESCC | 2.02e-06 | 1.85e-01 | 0.1153 |
| 259266 | ASPM | P17T-E | Human | Esophagus | ESCC | 2.68e-03 | 2.96e-01 | 0.1278 |
| 259266 | ASPM | P20T-E | Human | Esophagus | ESCC | 2.18e-03 | 3.37e-01 | 0.1124 |
| 259266 | ASPM | P21T-E | Human | Esophagus | ESCC | 1.88e-11 | 7.11e-01 | 0.1617 |
| Page: 1 2 3 4 |
| Tissue | Expression Dynamics | Abbreviation |
| Cervix | 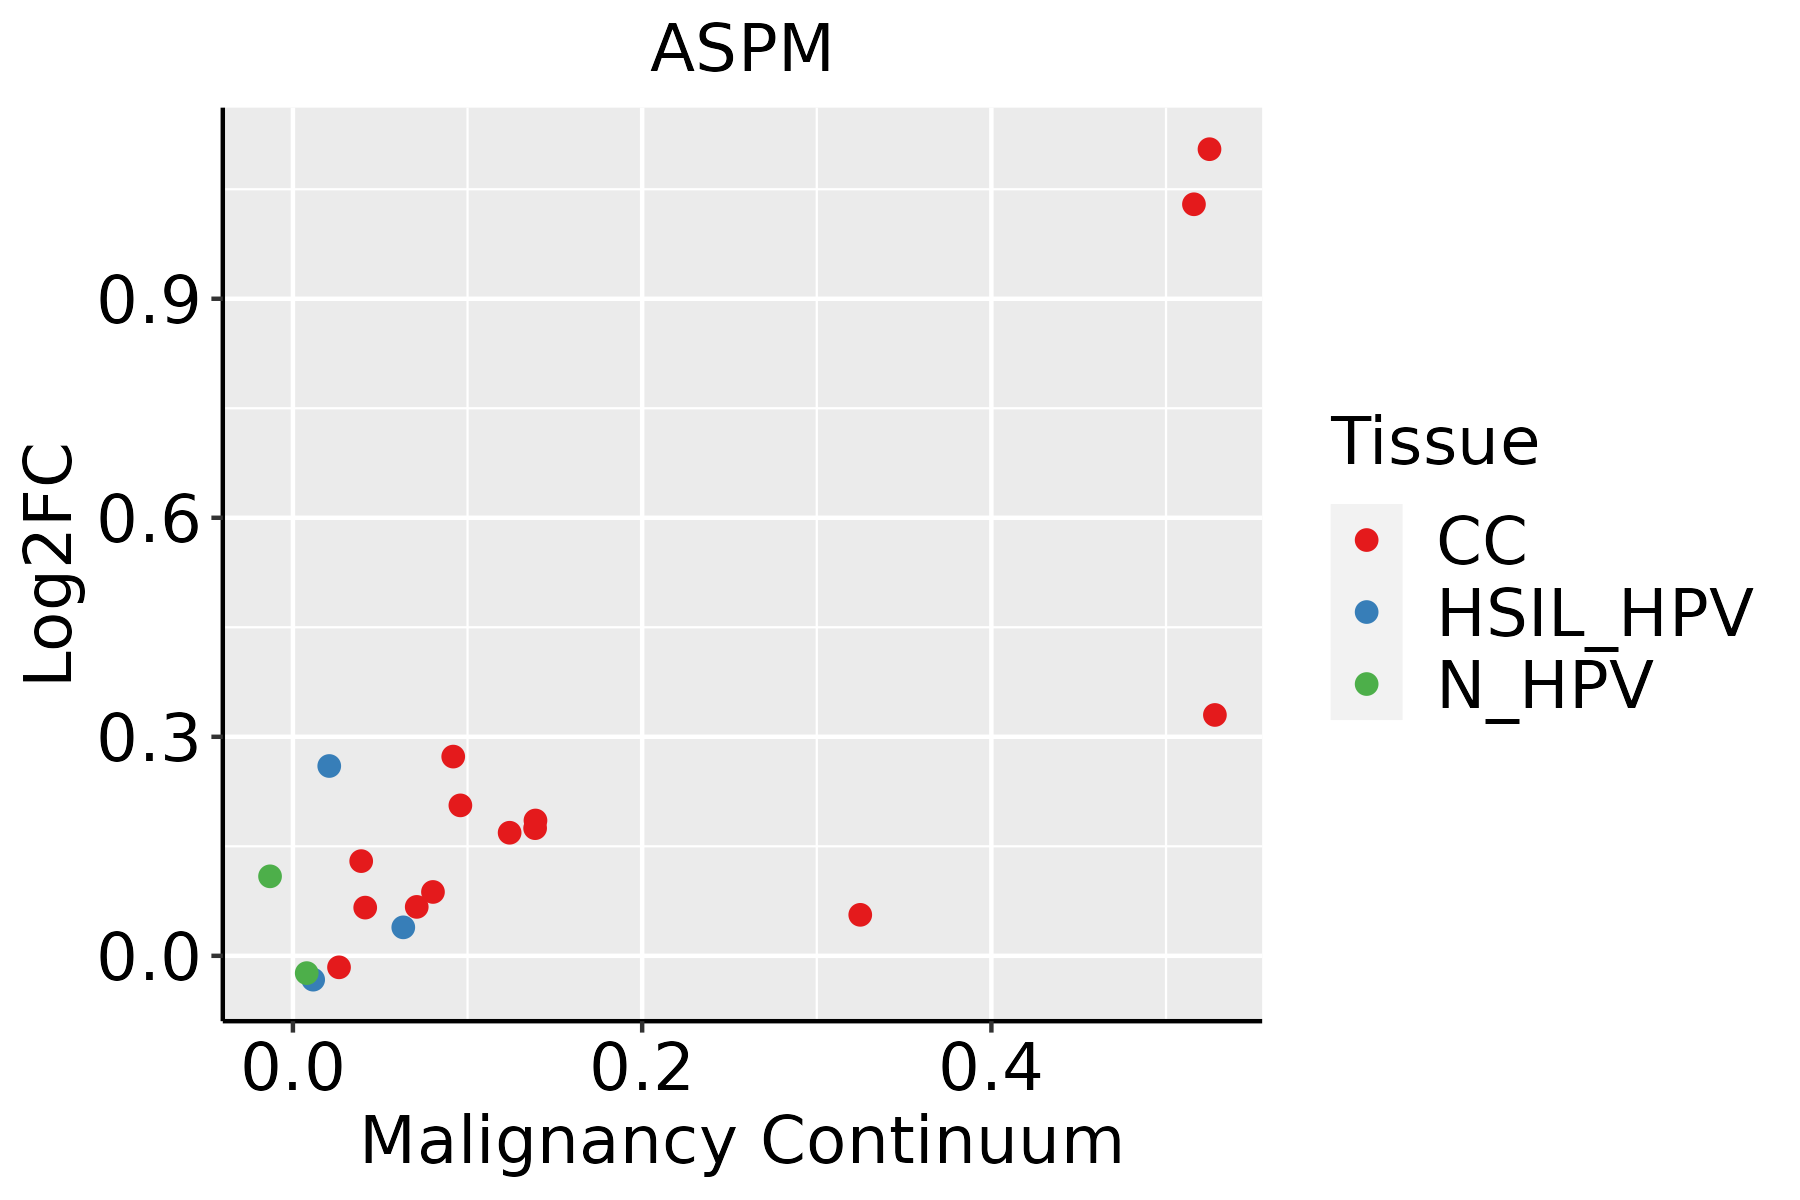 | CC: Cervix cancer |
| HSIL_HPV: HPV-infected high-grade squamous intraepithelial lesions | ||
| N_HPV: HPV-infected normal cervix | ||
| Esophagus | 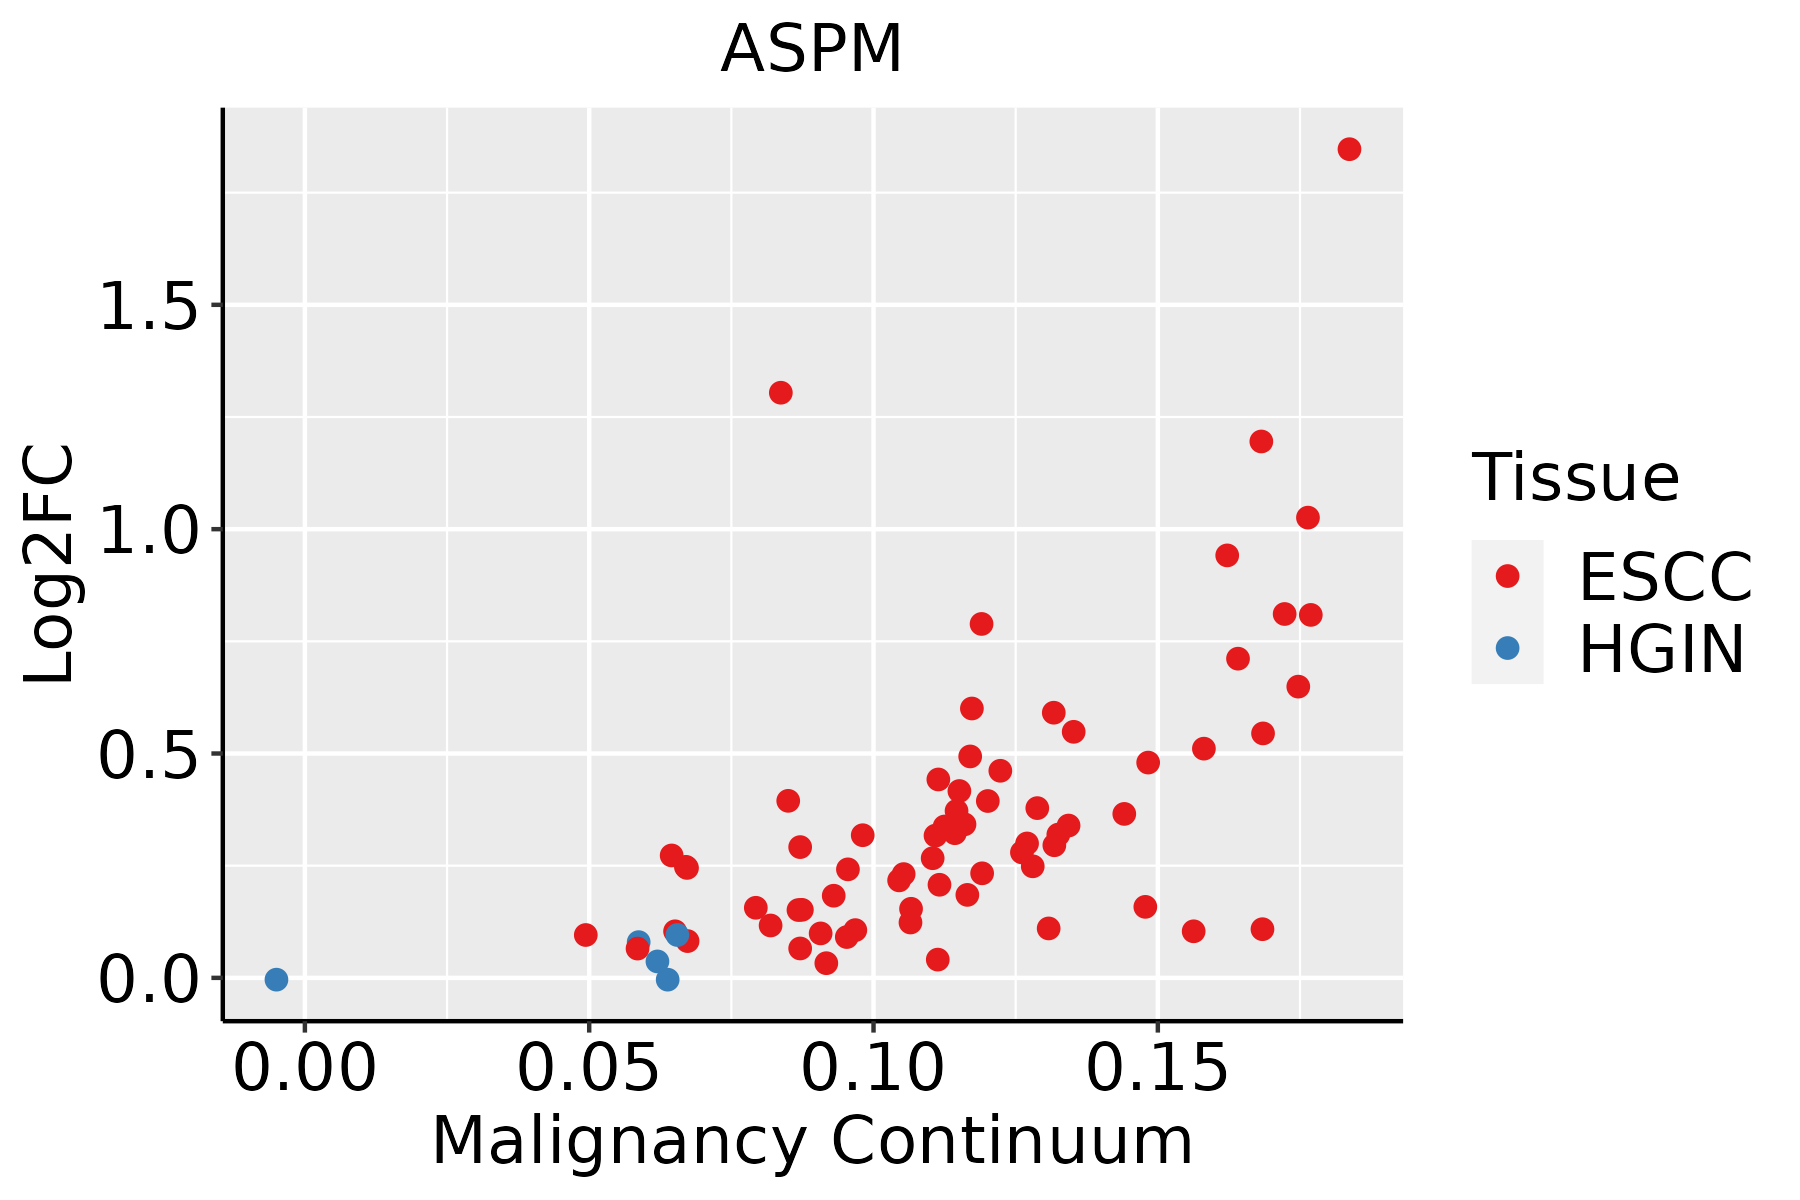 | ESCC: Esophageal squamous cell carcinoma |
| HGIN: High-grade intraepithelial neoplasias | ||
| LGIN: Low-grade intraepithelial neoplasias | ||
| Liver |  | HCC: Hepatocellular carcinoma |
| NAFLD: Non-alcoholic fatty liver disease | ||
| Oral Cavity |  | EOLP: Erosive Oral lichen planus |
| LP: leukoplakia | ||
| NEOLP: Non-erosive oral lichen planus | ||
| OSCC: Oral squamous cell carcinoma | ||
| Skin | 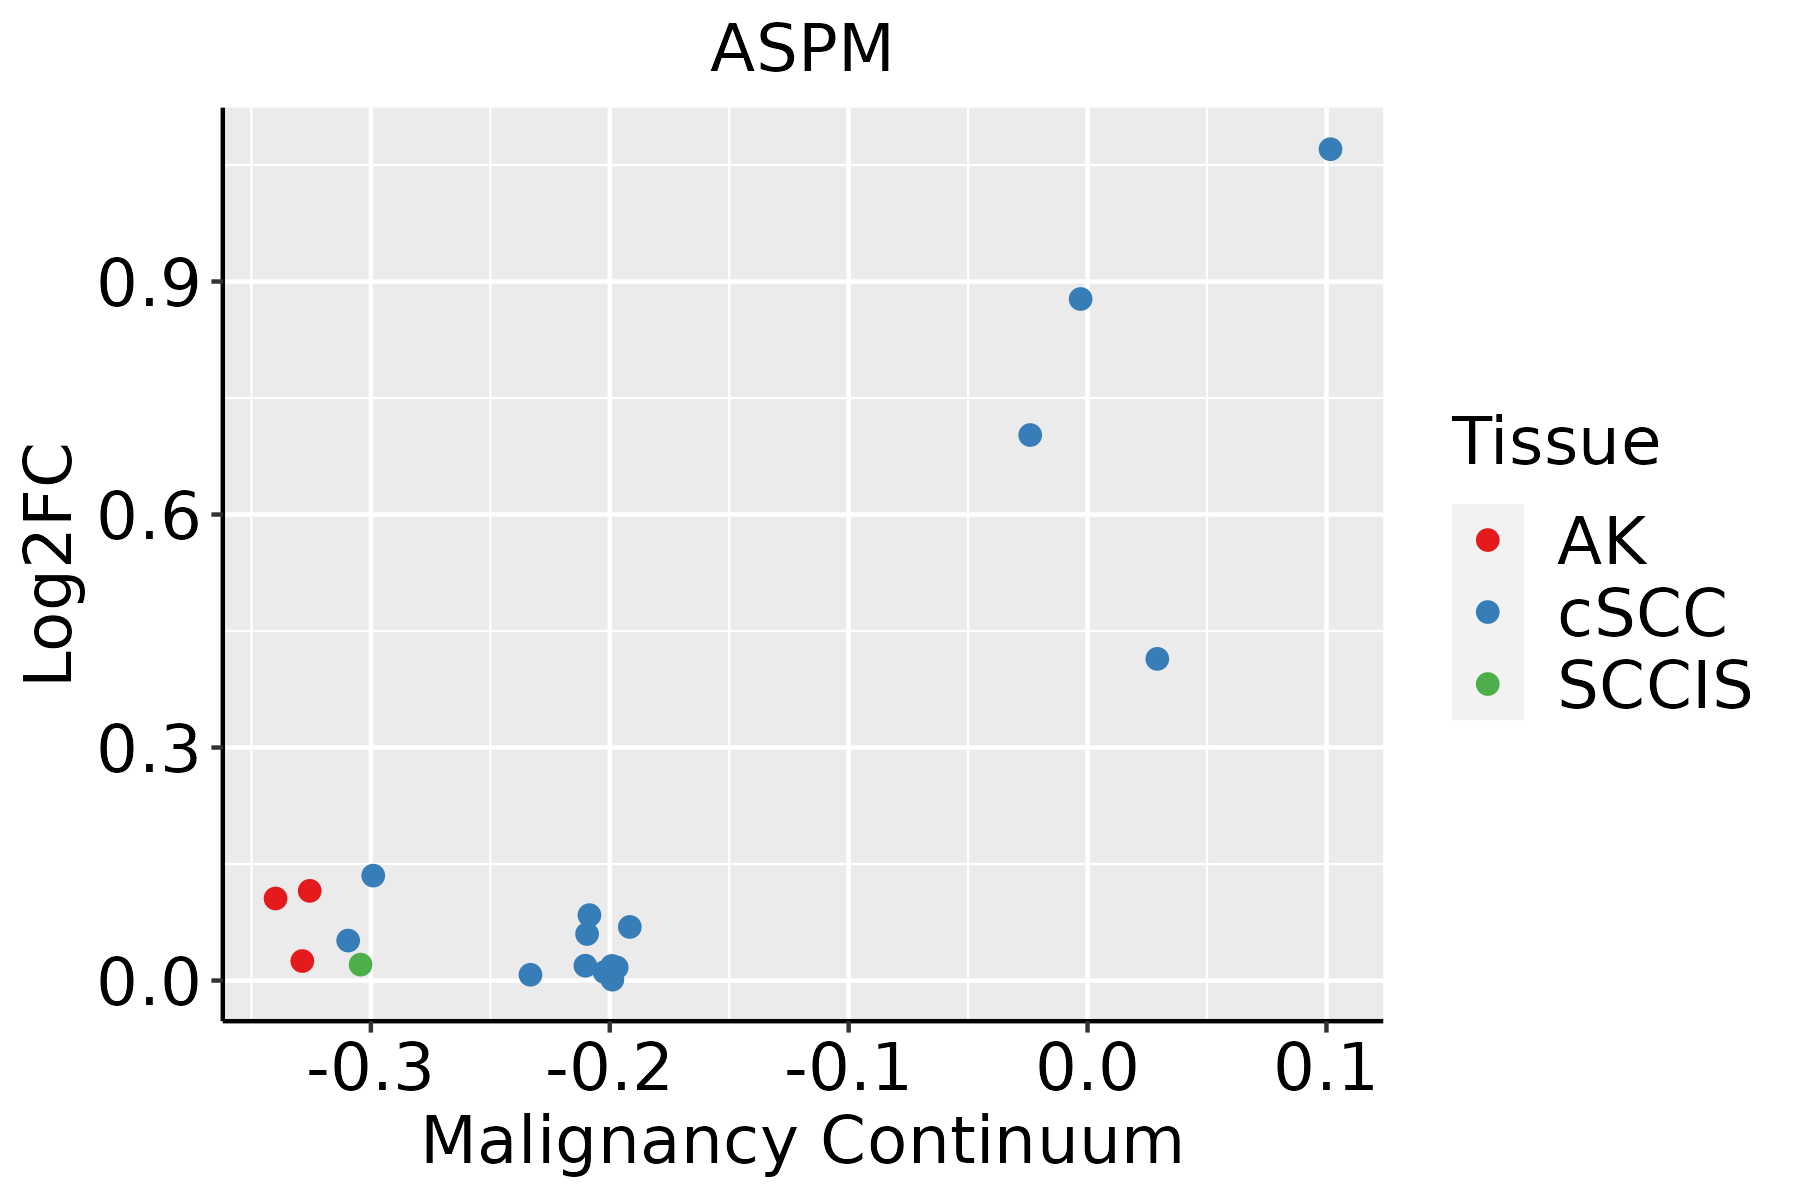 | AK: Actinic keratosis |
| cSCC: Cutaneous squamous cell carcinoma | ||
| SCCIS:squamous cell carcinoma in situ | ||
| Thyroid | 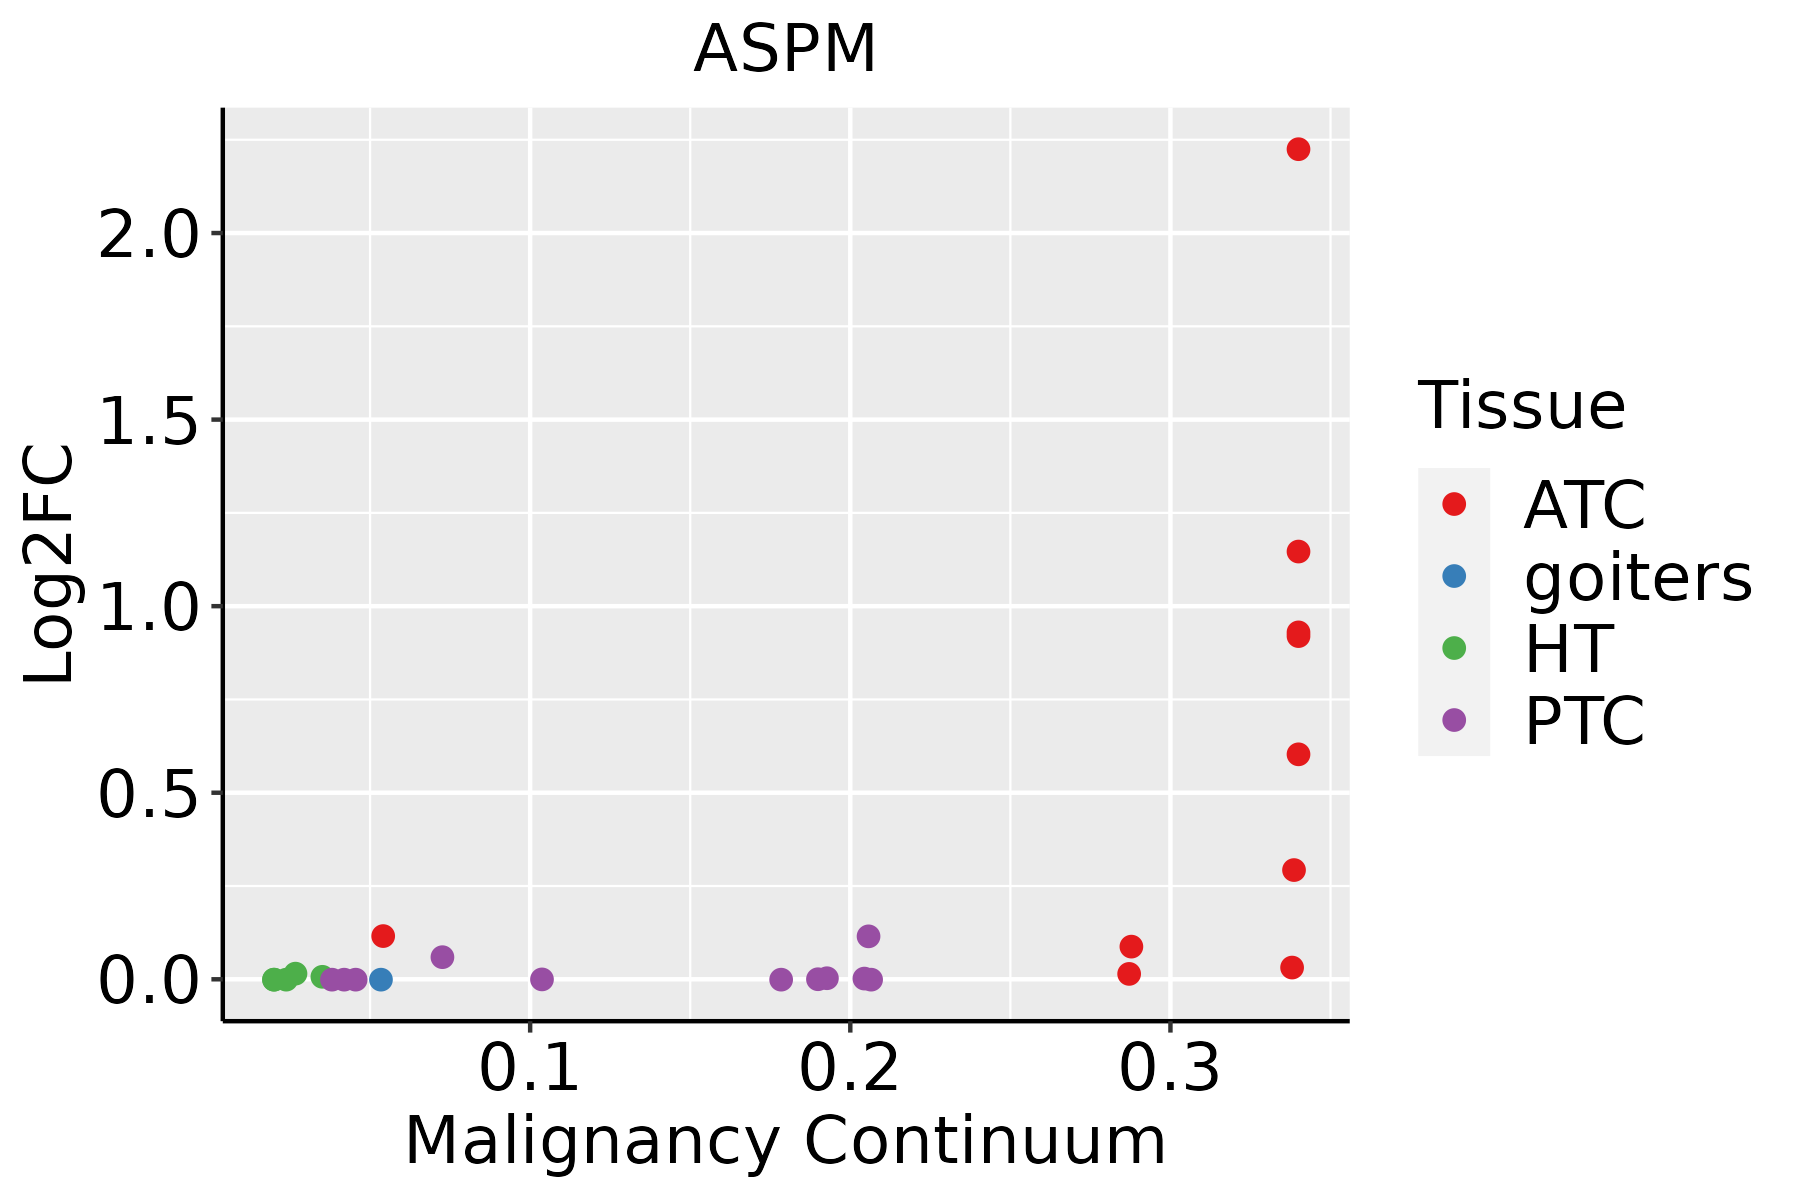 | ATC: Anaplastic thyroid cancer |
| HT: Hashimoto's thyroiditis | ||
| PTC: Papillary thyroid cancer |
| ∗log2FC in expression of this searched gene in stem-like cells from each diseased tissue sample relative to stem-like cells in normal samples in each tissue plotted against the malignancy continuum. Samples are colored based on if they are from different disease stage. |
Top |
Malignant transformation related pathway analysis |
| Find out the enriched GO biological processes and KEGG pathways involved in transition from healthy to precancer to cancer |
| Tissue | Disease Stage | Enriched GO biological Processes |
| Colorectum | AD |  |
| Colorectum | SER |  |
| Colorectum | MSS |  |
| Colorectum | MSI-H |  |
| Colorectum | FAP |  |
| ∗Top 15 enriched GO BP terms are showed in the bar plot of each disease state in each tissue. Each row represents a significant GO biological process which is colored according to the -log10(p.adjust). |
| Page: 1 2 3 4 5 6 7 8 9 |
| GO ID | Tissue | Disease Stage | Description | Gene Ratio | Bg Ratio | pvalue | p.adjust | Count |
| GO:00160557 | Cervix | CC | Wnt signaling pathway | 98/2311 | 444/18723 | 4.82e-09 | 4.65e-07 | 98 |
| GO:00512359 | Cervix | CC | maintenance of location | 78/2311 | 327/18723 | 5.18e-09 | 4.92e-07 | 78 |
| GO:01987387 | Cervix | CC | cell-cell signaling by wnt | 98/2311 | 446/18723 | 6.16e-09 | 5.58e-07 | 98 |
| GO:00301117 | Cervix | CC | regulation of Wnt signaling pathway | 76/2311 | 328/18723 | 3.05e-08 | 2.08e-06 | 76 |
| GO:005165110 | Cervix | CC | maintenance of location in cell | 55/2311 | 214/18723 | 6.63e-08 | 3.85e-06 | 55 |
| GO:00614588 | Cervix | CC | reproductive system development | 87/2311 | 427/18723 | 1.37e-06 | 4.55e-05 | 87 |
| GO:00608287 | Cervix | CC | regulation of canonical Wnt signaling pathway | 58/2311 | 253/18723 | 1.83e-06 | 5.89e-05 | 58 |
| GO:00486088 | Cervix | CC | reproductive structure development | 86/2311 | 424/18723 | 1.90e-06 | 5.97e-05 | 86 |
| GO:00600707 | Cervix | CC | canonical Wnt signaling pathway | 66/2311 | 303/18723 | 2.47e-06 | 7.35e-05 | 66 |
| GO:00107206 | Cervix | CC | positive regulation of cell development | 64/2311 | 298/18723 | 5.69e-06 | 1.41e-04 | 64 |
| GO:00513021 | Cervix | CC | regulation of cell division | 39/2311 | 177/18723 | 2.05e-04 | 2.33e-03 | 39 |
| GO:00987275 | Cervix | CC | maintenance of cell number | 30/2311 | 134/18723 | 7.98e-04 | 7.00e-03 | 30 |
| GO:00301776 | Cervix | CC | positive regulation of Wnt signaling pathway | 31/2311 | 140/18723 | 8.01e-04 | 7.02e-03 | 31 |
| GO:00519603 | Cervix | CC | regulation of nervous system development | 77/2311 | 443/18723 | 1.13e-03 | 9.30e-03 | 77 |
| GO:00198274 | Cervix | CC | stem cell population maintenance | 29/2311 | 131/18723 | 1.17e-03 | 9.47e-03 | 29 |
| GO:00507676 | Cervix | CC | regulation of neurogenesis | 65/2311 | 364/18723 | 1.33e-03 | 1.05e-02 | 65 |
| GO:00618425 | Cervix | CC | microtubule organizing center localization | 11/2311 | 33/18723 | 1.42e-03 | 1.11e-02 | 11 |
| GO:00507694 | Cervix | CC | positive regulation of neurogenesis | 43/2311 | 225/18723 | 2.25e-03 | 1.61e-02 | 43 |
| GO:00219873 | Cervix | CC | cerebral cortex development | 25/2311 | 114/18723 | 2.81e-03 | 1.88e-02 | 25 |
| GO:00516425 | Cervix | CC | centrosome localization | 10/2311 | 32/18723 | 3.96e-03 | 2.48e-02 | 10 |
| Page: 1 2 3 4 5 6 7 8 9 |
| Pathway ID | Tissue | Disease Stage | Description | Gene Ratio | Bg Ratio | pvalue | p.adjust | qvalue | Count |
| Page: 1 |
Top |
Cell-cell communication analysis |
| Identification of potential cell-cell interactions between two cell types and their ligand-receptor pairs for different disease states |
| Ligand | Receptor | LRpair | Pathway | Tissue | Disease Stage |
| Page: 1 |
Top |
Single-cell gene regulatory network inference analysis |
| Find out the significant the regulons (TFs) and the target genes of each regulon across cell types for different disease states |
| TF | Cell Type | Tissue | Disease Stage | Target Gene | RSS | Regulon Activity |
| ∗The dot plots of a searched regulon are shown for all cell subpopulations in each disease state of each tissue based on the regulon specific score inferred using pySCENIC and by calculating the average expression. |
| Page: 1 |
Top |
Somatic mutation of malignant transformation related genes |
| Annotation of somatic variants for genes involved in malignant transformation |
| Hugo Symbol | Variant Class | Variant Classification | dbSNP RS | HGVSc | HGVSp | HGVSp Short | SWISSPROT | BIOTYPE | SIFT | PolyPhen | Tumor Sample Barcode | Tissue | Histology | Sex | Age | Stage | Therapy Types | Drugs | Outcome |
| ASPM | SNV | Missense_Mutation | novel | c.874N>A | p.Glu292Lys | p.E292K | Q8IZT6 | protein_coding | tolerated(0.27) | benign(0.001) | TCGA-5L-AAT1-01 | Breast | breast invasive carcinoma | Female | <65 | III/IV | Hormone Therapy | letrozol | SD |
| ASPM | SNV | Missense_Mutation | novel | c.5458N>A | p.Leu1820Ile | p.L1820I | Q8IZT6 | protein_coding | tolerated(0.42) | benign(0.066) | TCGA-A1-A0SO-01 | Breast | breast invasive carcinoma | Female | >=65 | I/II | Chemotherapy | SD | |
| ASPM | SNV | Missense_Mutation | rs200848981 | c.6551G>A | p.Arg2184Gln | p.R2184Q | Q8IZT6 | protein_coding | tolerated(1) | benign(0) | TCGA-A2-A0SY-01 | Breast | breast invasive carcinoma | Female | <65 | III/IV | Hormone Therapy | arimidex | SD |
| ASPM | SNV | Missense_Mutation | c.2498G>A | p.Gly833Glu | p.G833E | Q8IZT6 | protein_coding | deleterious(0) | probably_damaging(0.97) | TCGA-A2-A25A-01 | Breast | breast invasive carcinoma | Female | <65 | I/II | Unspecific | Cytoxan | SD | |
| ASPM | SNV | Missense_Mutation | novel | c.1940N>G | p.Thr647Ser | p.T647S | Q8IZT6 | protein_coding | tolerated(0.15) | benign(0.006) | TCGA-A2-A3XU-01 | Breast | breast invasive carcinoma | Female | <65 | I/II | Hormone Therapy | arimidex | PD |
| ASPM | SNV | Missense_Mutation | c.8884N>G | p.Gln2962Glu | p.Q2962E | Q8IZT6 | protein_coding | deleterious(0.01) | probably_damaging(0.996) | TCGA-A8-A09I-01 | Breast | breast invasive carcinoma | Female | >=65 | I/II | Hormone Therapy | anastrozole | SD | |
| ASPM | SNV | Missense_Mutation | c.8811N>G | p.Ile2937Met | p.I2937M | Q8IZT6 | protein_coding | deleterious(0.01) | probably_damaging(0.959) | TCGA-A8-A0A7-01 | Breast | breast invasive carcinoma | Female | <65 | I/II | Unknown | Unknown | SD | |
| ASPM | SNV | Missense_Mutation | c.9061C>G | p.His3021Asp | p.H3021D | Q8IZT6 | protein_coding | tolerated(0.24) | benign(0.316) | TCGA-AC-A23H-01 | Breast | breast invasive carcinoma | Female | >=65 | I/II | Unknown | Unknown | PD | |
| ASPM | SNV | Missense_Mutation | c.8791G>C | p.Glu2931Gln | p.E2931Q | Q8IZT6 | protein_coding | tolerated(0.18) | benign(0) | TCGA-AC-A23H-01 | Breast | breast invasive carcinoma | Female | >=65 | I/II | Unknown | Unknown | PD | |
| ASPM | SNV | Missense_Mutation | c.2942C>A | p.Thr981Asn | p.T981N | Q8IZT6 | protein_coding | deleterious(0) | possibly_damaging(0.567) | TCGA-AC-A23H-01 | Breast | breast invasive carcinoma | Female | >=65 | I/II | Unknown | Unknown | PD |
| Page: 1 2 3 4 5 6 7 8 9 10 11 12 13 14 15 16 17 18 19 20 21 22 23 24 25 26 27 28 29 30 31 32 33 34 35 36 37 38 39 40 41 42 43 44 45 46 47 48 49 50 51 52 53 54 55 56 |
Top |
Related drugs of malignant transformation related genes |
| Identification of chemicals and drugs interact with genes involved in malignant transfromation |
| (DGIdb 4.0) |
| Entrez ID | Symbol | Category | Interaction Types | Drug Claim Name | Drug Name | PMIDs |
| Page: 1 |

Copyright 2023-Present -The University of Texas Health Science Center at Houston |