
|
|||||
|
 | |
| |
| |
| |
| |
| |
|
Gene: ASPH |
Gene summary for ASPH |
| Gene information | Species | Human | Gene symbol | ASPH | Gene ID | 444 |
| Gene name | aspartate beta-hydroxylase | |
| Gene Alias | AAH | |
| Cytomap | 8q12.3 | |
| Gene Type | protein-coding | GO ID | GO:0003008 | UniProtAcc | Q12797 |
Top |
Malignant transformation analysis |
| Identification of the aberrant gene expression in precancerous and cancerous lesions by comparing the gene expression of stem-like cells in diseased tissues with normal stem cells |
| Entrez ID | Symbol | Replicates | Species | Organ | Tissue | Adj P-value | Log2FC | Malignancy |
| 444 | ASPH | CA_HPV_3 | Human | Cervix | CC | 2.83e-04 | 2.00e-01 | 0.0414 |
| 444 | ASPH | CCI_2 | Human | Cervix | CC | 1.85e-03 | 8.65e-01 | 0.5249 |
| 444 | ASPH | CCI_3 | Human | Cervix | CC | 6.35e-06 | 7.32e-01 | 0.516 |
| 444 | ASPH | T3 | Human | Cervix | CC | 3.74e-02 | 1.14e-01 | 0.1389 |
| 444 | ASPH | HTA11_3410_2000001011 | Human | Colorectum | AD | 7.95e-27 | -7.32e-01 | 0.0155 |
| 444 | ASPH | HTA11_2487_2000001011 | Human | Colorectum | SER | 1.14e-05 | -5.40e-01 | -0.1808 |
| 444 | ASPH | HTA11_2951_2000001011 | Human | Colorectum | AD | 1.22e-02 | -7.14e-01 | 0.0216 |
| 444 | ASPH | HTA11_1938_2000001011 | Human | Colorectum | AD | 2.72e-07 | -5.84e-01 | -0.0811 |
| 444 | ASPH | HTA11_347_2000001011 | Human | Colorectum | AD | 2.56e-11 | -4.41e-01 | -0.1954 |
| 444 | ASPH | HTA11_3361_2000001011 | Human | Colorectum | AD | 3.51e-09 | -6.59e-01 | -0.1207 |
| 444 | ASPH | HTA11_83_2000001011 | Human | Colorectum | SER | 2.01e-06 | -6.33e-01 | -0.1526 |
| 444 | ASPH | HTA11_696_2000001011 | Human | Colorectum | AD | 9.78e-23 | -6.07e-01 | -0.1464 |
| 444 | ASPH | HTA11_866_2000001011 | Human | Colorectum | AD | 8.07e-22 | -6.34e-01 | -0.1001 |
| 444 | ASPH | HTA11_1391_2000001011 | Human | Colorectum | AD | 1.18e-11 | -5.68e-01 | -0.059 |
| 444 | ASPH | HTA11_2992_2000001011 | Human | Colorectum | SER | 4.76e-04 | -7.25e-01 | -0.1706 |
| 444 | ASPH | HTA11_5212_2000001011 | Human | Colorectum | AD | 3.21e-03 | -6.35e-01 | -0.2061 |
| 444 | ASPH | HTA11_546_2000001011 | Human | Colorectum | AD | 2.00e-04 | -5.67e-01 | -0.0842 |
| 444 | ASPH | HTA11_7862_2000001011 | Human | Colorectum | AD | 3.90e-04 | -6.02e-01 | -0.0179 |
| 444 | ASPH | HTA11_866_3004761011 | Human | Colorectum | AD | 1.81e-18 | -6.69e-01 | 0.096 |
| 444 | ASPH | HTA11_9408_2000001011 | Human | Colorectum | AD | 7.22e-04 | -7.81e-01 | 0.0451 |
| Page: 1 2 3 4 5 6 7 8 9 10 11 12 13 |
| Tissue | Expression Dynamics | Abbreviation |
| Cervix | 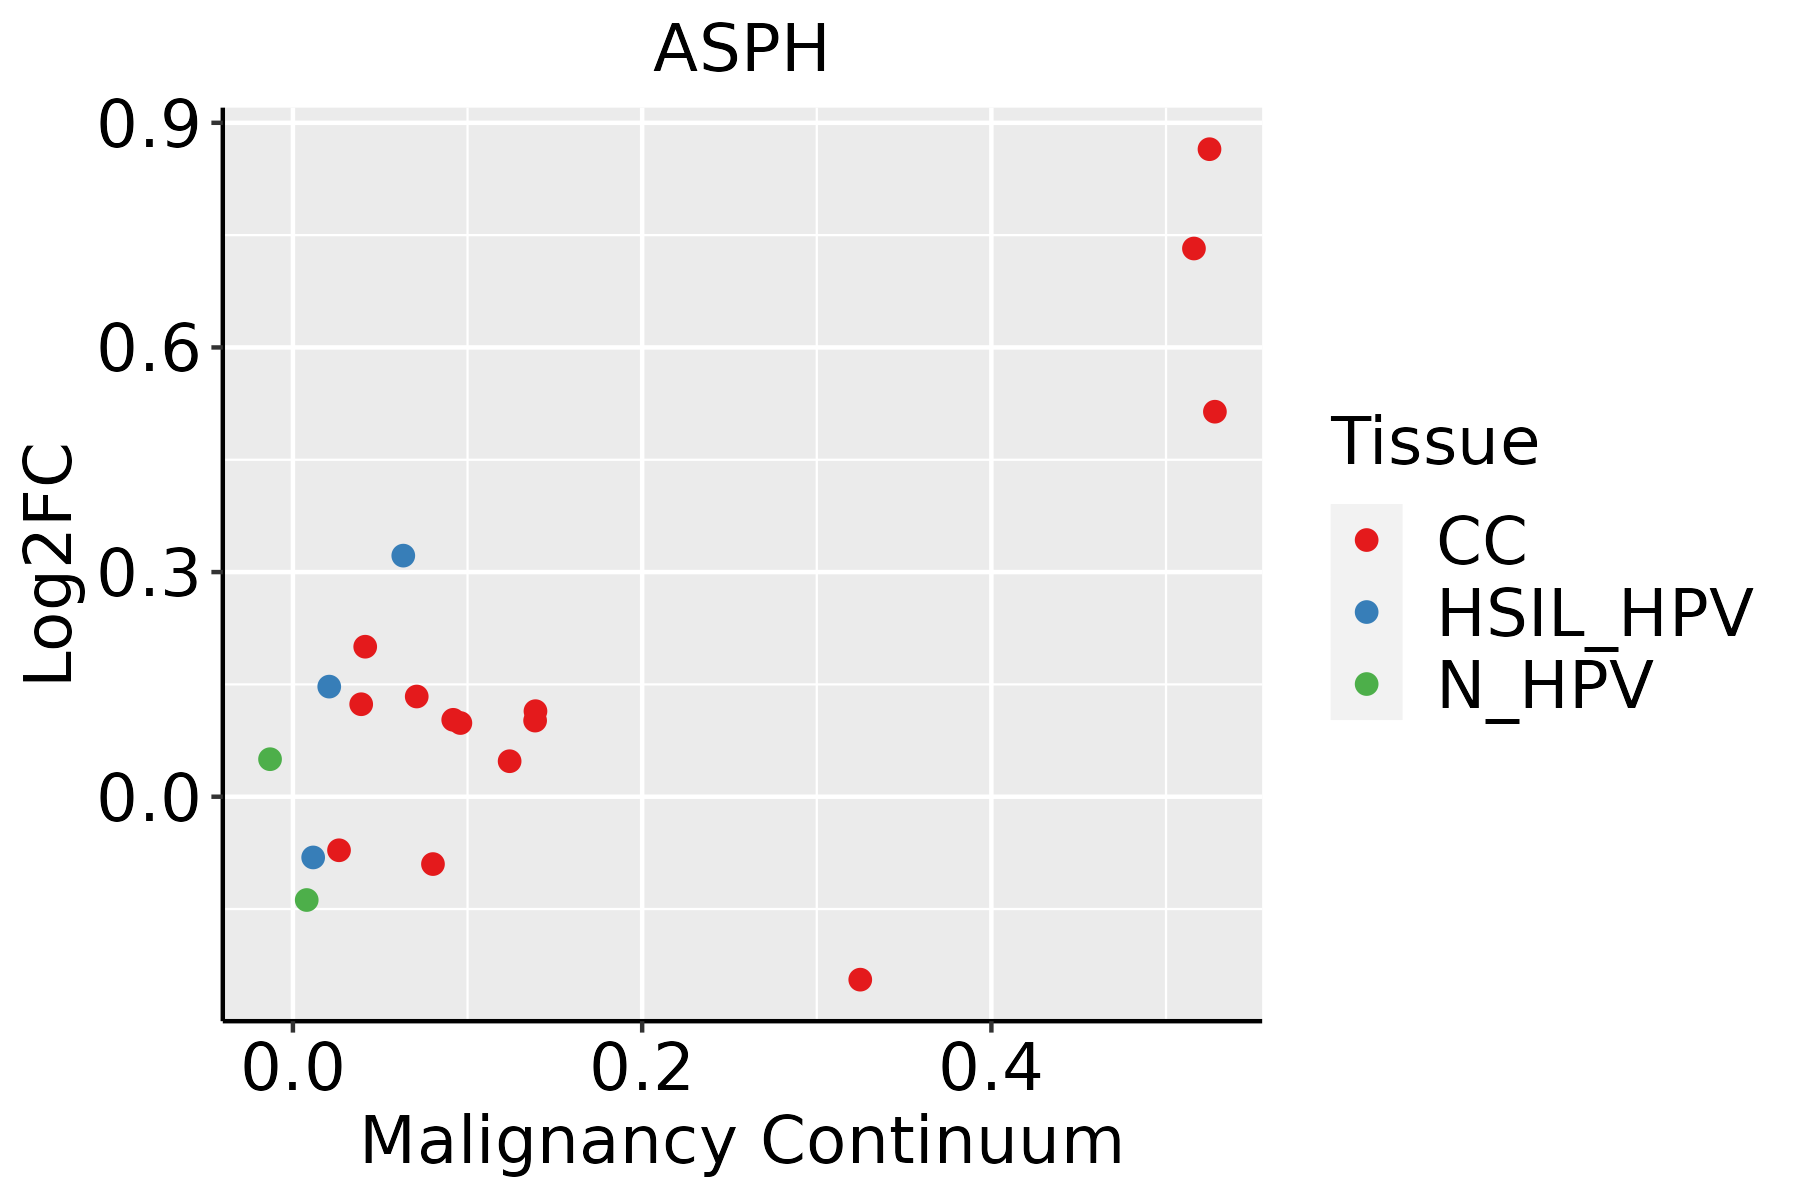 | CC: Cervix cancer |
| HSIL_HPV: HPV-infected high-grade squamous intraepithelial lesions | ||
| N_HPV: HPV-infected normal cervix | ||
| Colorectum (GSE201348) |  | FAP: Familial adenomatous polyposis |
| CRC: Colorectal cancer | ||
| Colorectum (HTA11) |  | AD: Adenomas |
| SER: Sessile serrated lesions | ||
| MSI-H: Microsatellite-high colorectal cancer | ||
| MSS: Microsatellite stable colorectal cancer | ||
| Esophagus |  | ESCC: Esophageal squamous cell carcinoma |
| HGIN: High-grade intraepithelial neoplasias | ||
| LGIN: Low-grade intraepithelial neoplasias | ||
| GC | 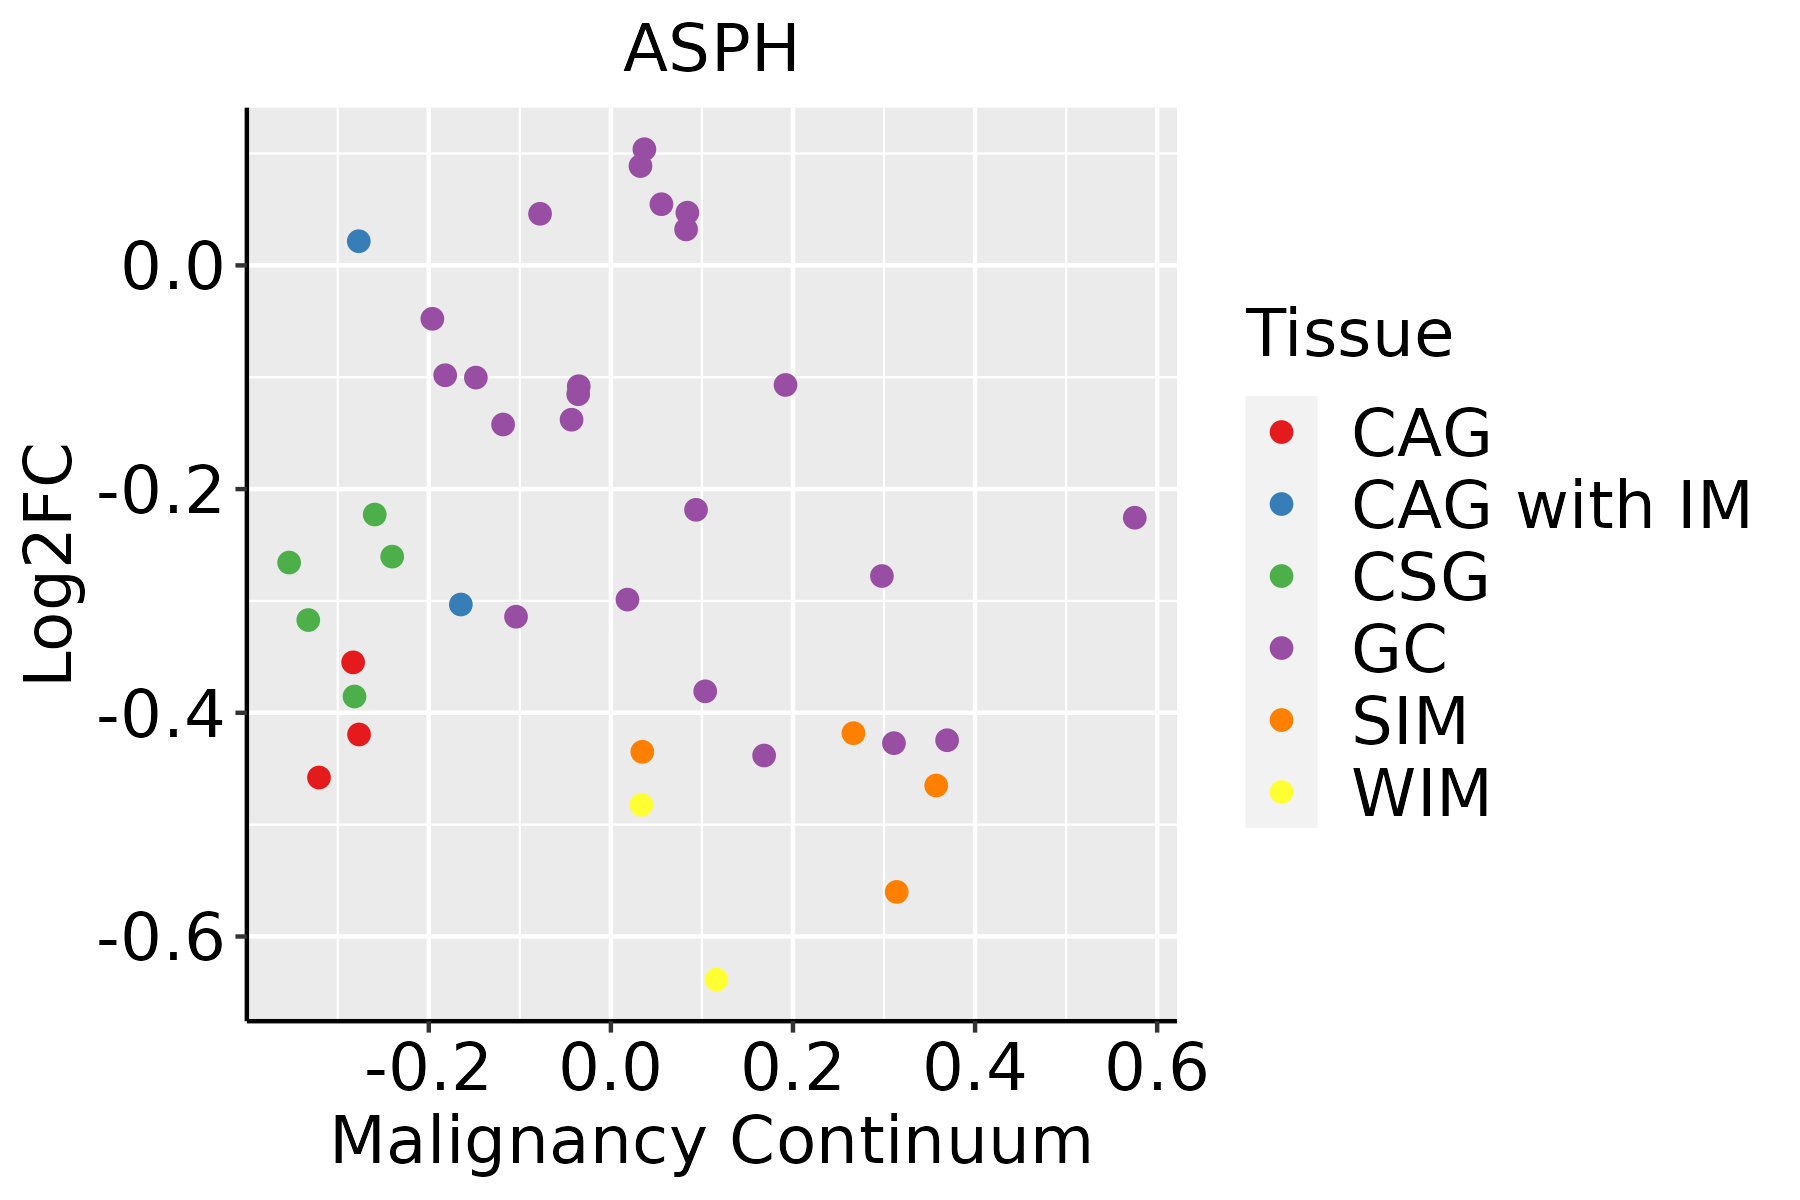 | CAG: Chronic atrophic gastritis |
| CAG with IM: Chronic atrophic gastritis with intestinal metaplasia | ||
| CSG: Chronic superficial gastritis | ||
| GC: Gastric cancer | ||
| SIM: Severe intestinal metaplasia | ||
| WIM: Wild intestinal metaplasia | ||
| Liver | 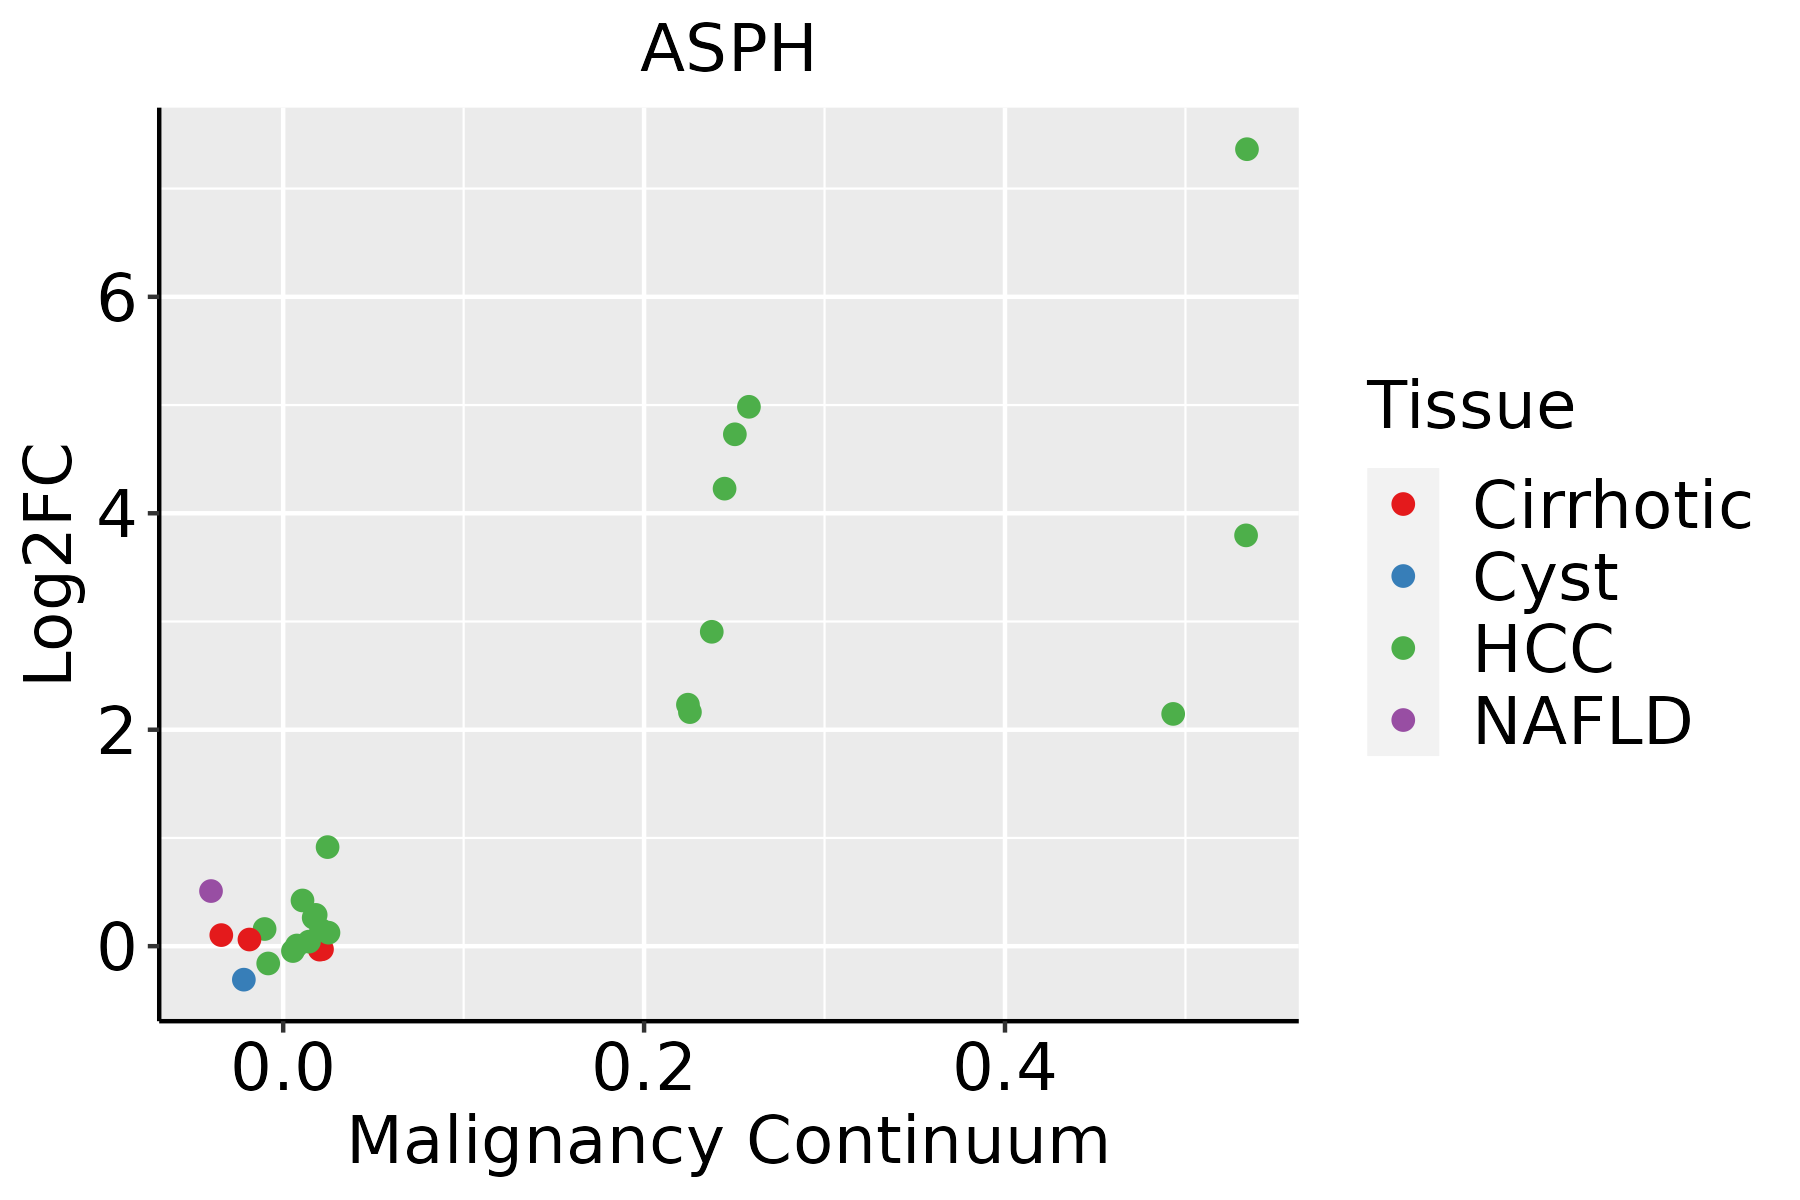 | HCC: Hepatocellular carcinoma |
| NAFLD: Non-alcoholic fatty liver disease | ||
| Lung | 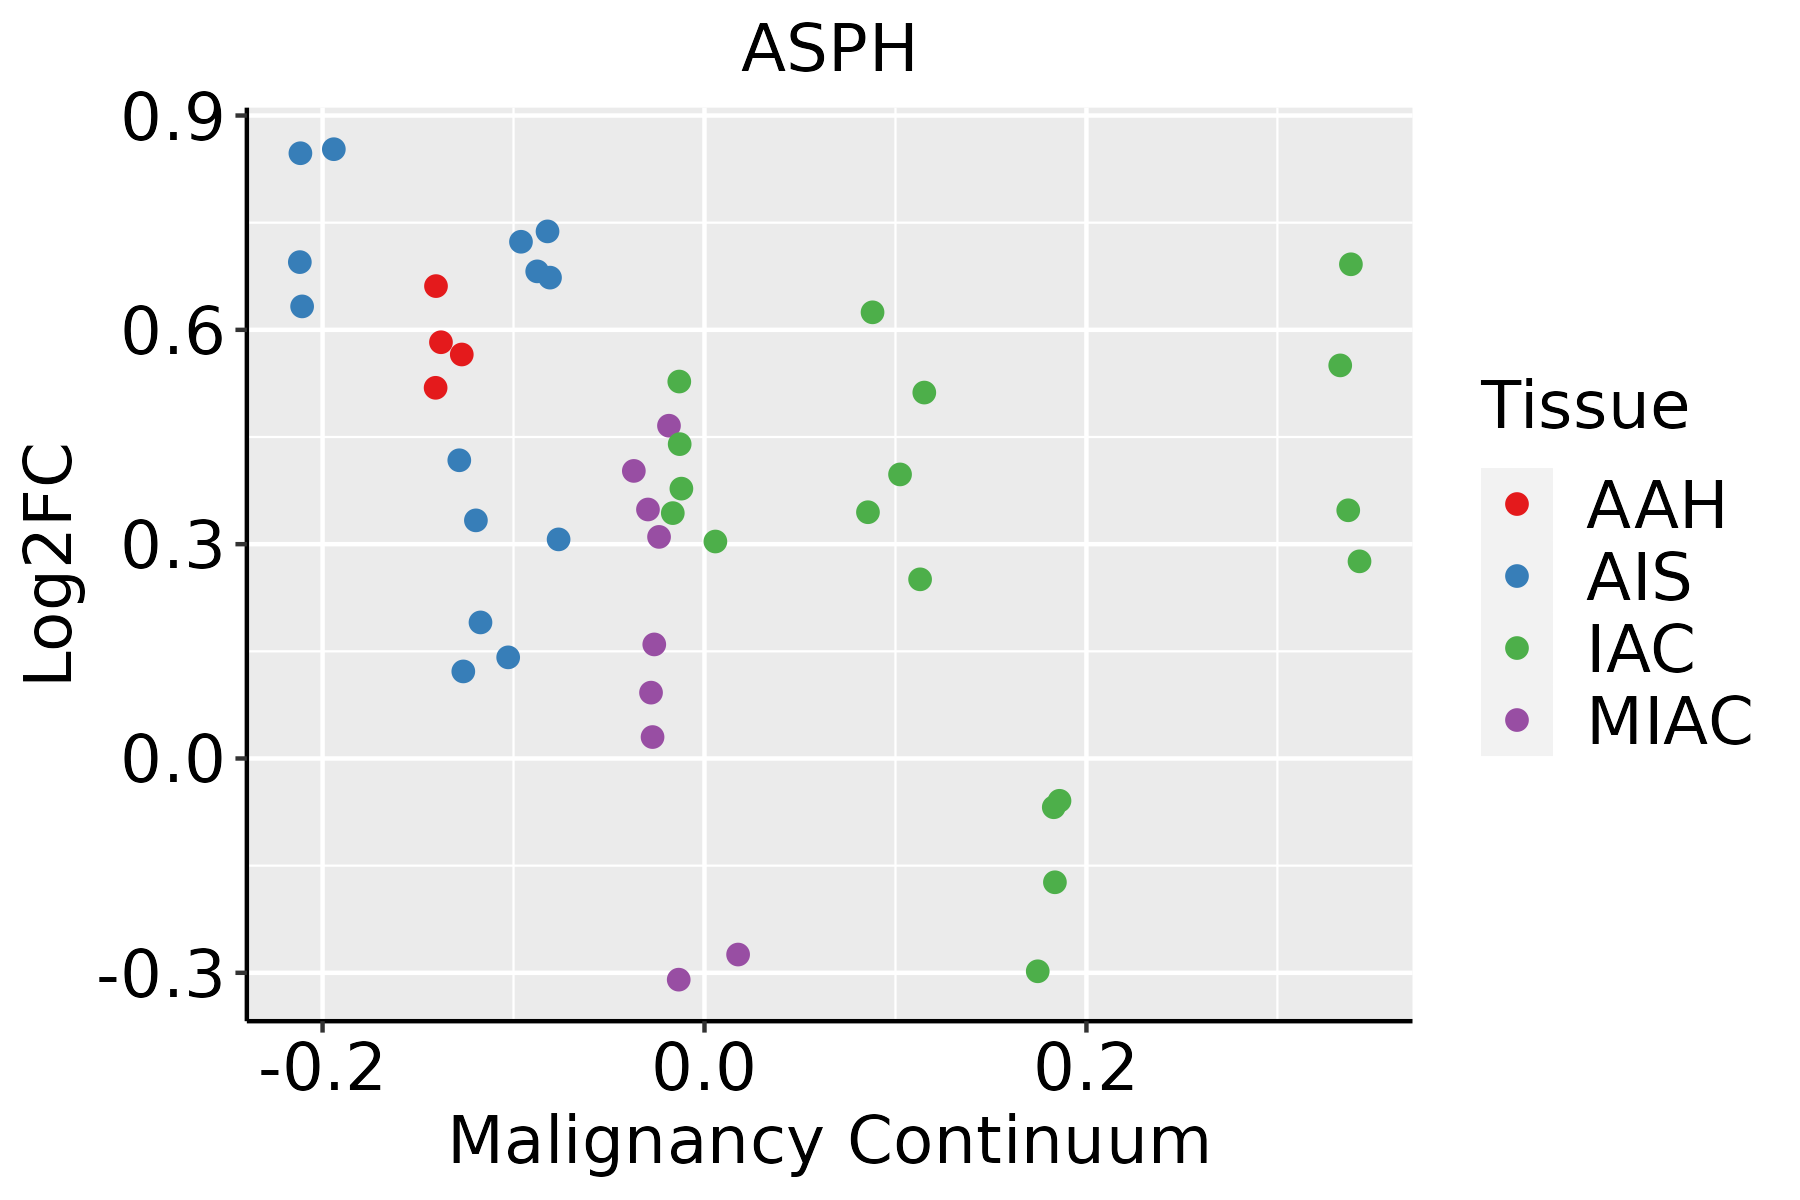 | AAH: Atypical adenomatous hyperplasia |
| AIS: Adenocarcinoma in situ | ||
| IAC: Invasive lung adenocarcinoma | ||
| MIA: Minimally invasive adenocarcinoma | ||
| Oral Cavity | 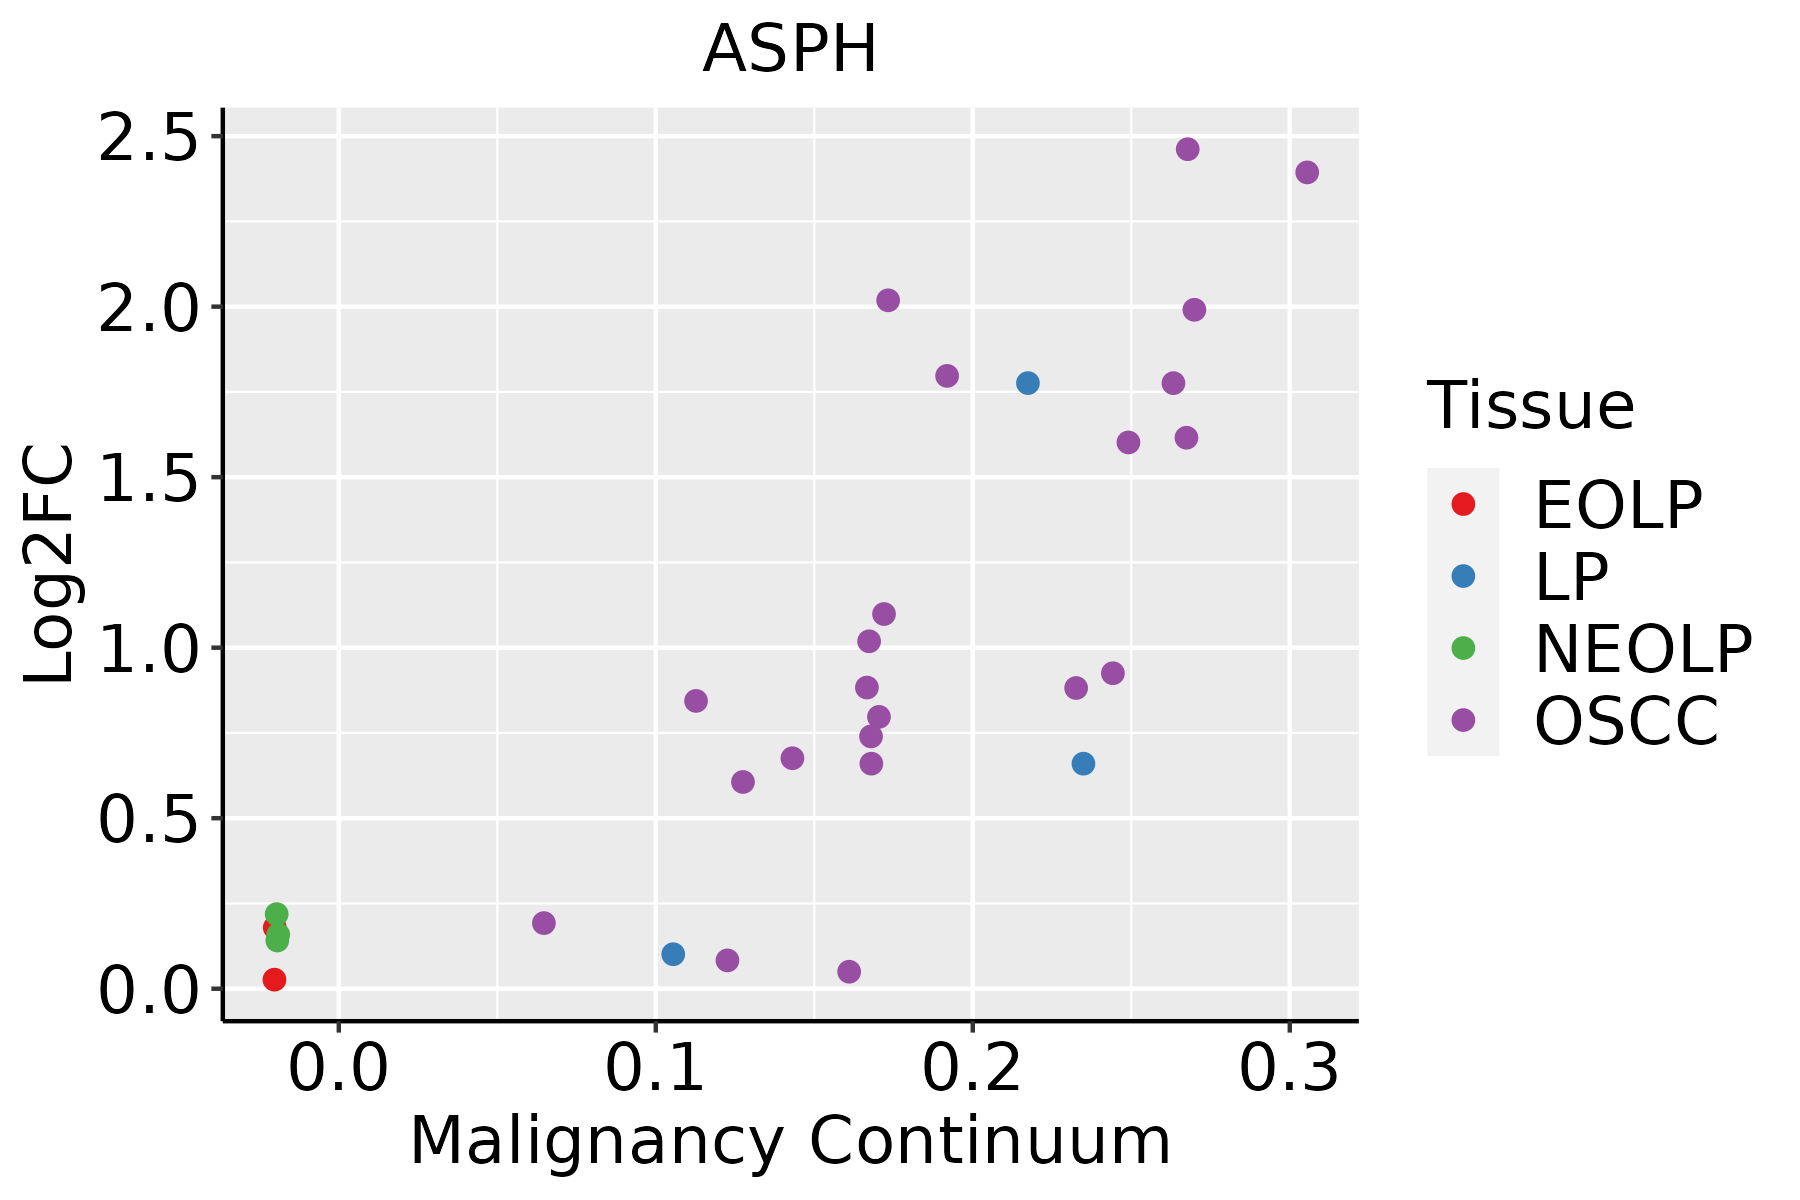 | EOLP: Erosive Oral lichen planus |
| LP: leukoplakia | ||
| NEOLP: Non-erosive oral lichen planus | ||
| OSCC: Oral squamous cell carcinoma | ||
| Prostate | 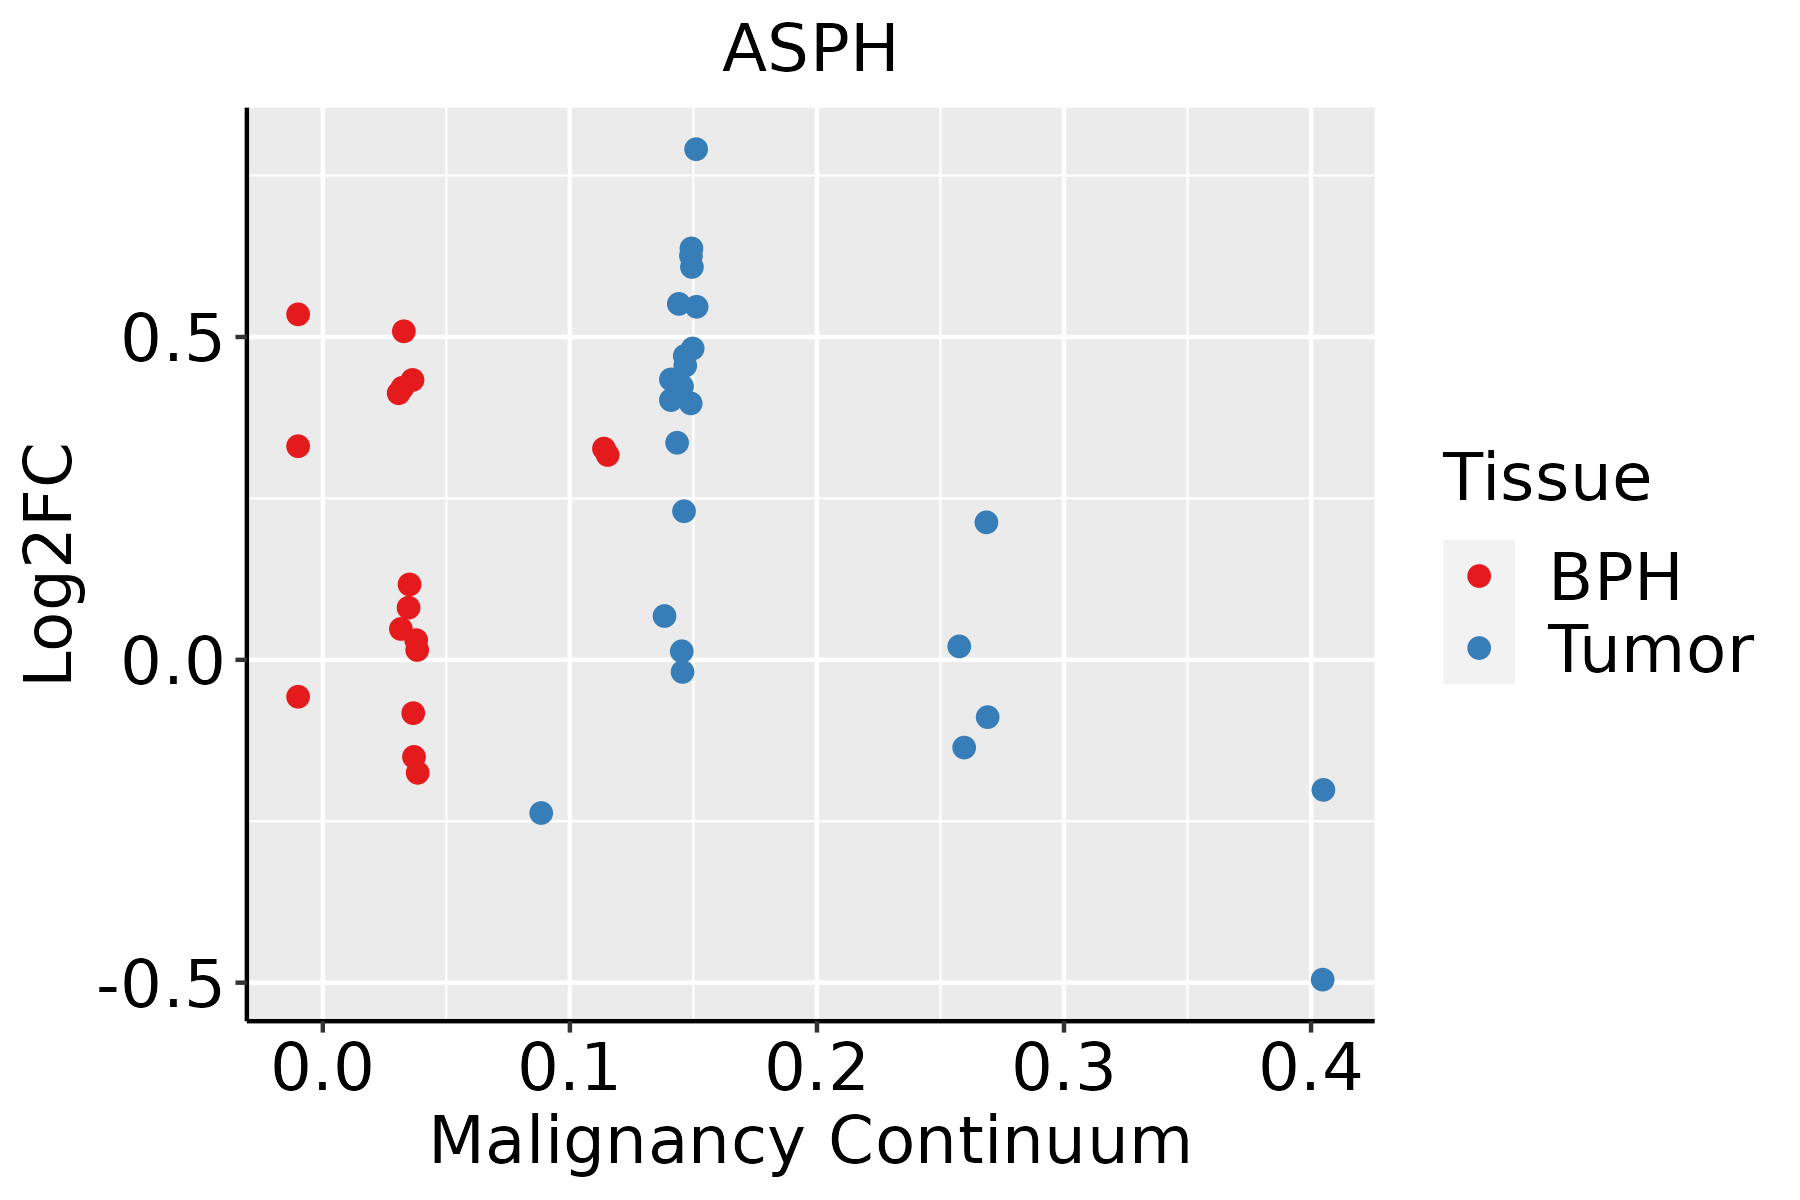 | BPH: Benign Prostatic Hyperplasia |
| Skin |  | AK: Actinic keratosis |
| cSCC: Cutaneous squamous cell carcinoma | ||
| SCCIS:squamous cell carcinoma in situ | ||
| Thyroid |  | ATC: Anaplastic thyroid cancer |
| HT: Hashimoto's thyroiditis | ||
| PTC: Papillary thyroid cancer |
| ∗log2FC in expression of this searched gene in stem-like cells from each diseased tissue sample relative to stem-like cells in normal samples in each tissue plotted against the malignancy continuum. Samples are colored based on if they are from different disease stage. |
Top |
Malignant transformation related pathway analysis |
| Find out the enriched GO biological processes and KEGG pathways involved in transition from healthy to precancer to cancer |
| Tissue | Disease Stage | Enriched GO biological Processes |
| Colorectum | AD |  |
| Colorectum | SER |  |
| Colorectum | MSS |  |
| Colorectum | MSI-H |  |
| Colorectum | FAP |  |
| ∗Top 15 enriched GO BP terms are showed in the bar plot of each disease state in each tissue. Each row represents a significant GO biological process which is colored according to the -log10(p.adjust). |
| Page: 1 2 3 4 5 6 7 8 9 |
| GO ID | Tissue | Disease Stage | Description | Gene Ratio | Bg Ratio | pvalue | p.adjust | Count |
| GO:005254710 | Cervix | CC | regulation of peptidase activity | 112/2311 | 461/18723 | 6.70e-13 | 3.08e-10 | 112 |
| GO:004586210 | Cervix | CC | positive regulation of proteolysis | 95/2311 | 372/18723 | 1.84e-12 | 6.86e-10 | 95 |
| GO:005254810 | Cervix | CC | regulation of endopeptidase activity | 103/2311 | 432/18723 | 1.89e-11 | 5.14e-09 | 103 |
| GO:00229009 | Cervix | CC | electron transport chain | 53/2311 | 175/18723 | 2.23e-10 | 3.43e-08 | 53 |
| GO:00060919 | Cervix | CC | generation of precursor metabolites and energy | 105/2311 | 490/18723 | 7.40e-09 | 6.61e-07 | 105 |
| GO:001095210 | Cervix | CC | positive regulation of peptidase activity | 54/2311 | 197/18723 | 8.06e-09 | 6.99e-07 | 54 |
| GO:200011610 | Cervix | CC | regulation of cysteine-type endopeptidase activity | 61/2311 | 235/18723 | 8.69e-09 | 7.22e-07 | 61 |
| GO:001095010 | Cervix | CC | positive regulation of endopeptidase activity | 48/2311 | 179/18723 | 1.12e-07 | 5.71e-06 | 48 |
| GO:20010569 | Cervix | CC | positive regulation of cysteine-type endopeptidase activity | 38/2311 | 148/18723 | 6.94e-06 | 1.65e-04 | 38 |
| GO:00516048 | Cervix | CC | protein maturation | 56/2311 | 294/18723 | 5.90e-04 | 5.59e-03 | 56 |
| GO:0006091 | Colorectum | AD | generation of precursor metabolites and energy | 209/3918 | 490/18723 | 3.17e-28 | 6.61e-25 | 209 |
| GO:0022900 | Colorectum | AD | electron transport chain | 89/3918 | 175/18723 | 1.42e-18 | 8.91e-16 | 89 |
| GO:0045862 | Colorectum | AD | positive regulation of proteolysis | 129/3918 | 372/18723 | 4.04e-10 | 3.46e-08 | 129 |
| GO:2000116 | Colorectum | AD | regulation of cysteine-type endopeptidase activity | 79/3918 | 235/18723 | 3.74e-06 | 1.03e-04 | 79 |
| GO:0052547 | Colorectum | AD | regulation of peptidase activity | 137/3918 | 461/18723 | 4.12e-06 | 1.12e-04 | 137 |
| GO:0010952 | Colorectum | AD | positive regulation of peptidase activity | 68/3918 | 197/18723 | 6.30e-06 | 1.59e-04 | 68 |
| GO:0052548 | Colorectum | AD | regulation of endopeptidase activity | 124/3918 | 432/18723 | 6.58e-05 | 1.07e-03 | 124 |
| GO:0010950 | Colorectum | AD | positive regulation of endopeptidase activity | 59/3918 | 179/18723 | 1.11e-04 | 1.65e-03 | 59 |
| GO:0051604 | Colorectum | AD | protein maturation | 85/3918 | 294/18723 | 6.73e-04 | 6.91e-03 | 85 |
| GO:2001056 | Colorectum | AD | positive regulation of cysteine-type endopeptidase activity | 47/3918 | 148/18723 | 1.30e-03 | 1.14e-02 | 47 |
| Page: 1 2 3 4 5 6 7 8 9 10 11 12 13 14 |
| Pathway ID | Tissue | Disease Stage | Description | Gene Ratio | Bg Ratio | pvalue | p.adjust | qvalue | Count |
| hsa0426018 | Cervix | CC | Cardiac muscle contraction | 23/1267 | 87/8465 | 3.71e-03 | 1.34e-02 | 7.91e-03 | 23 |
| hsa0426019 | Cervix | CC | Cardiac muscle contraction | 23/1267 | 87/8465 | 3.71e-03 | 1.34e-02 | 7.91e-03 | 23 |
| hsa042608 | Colorectum | FAP | Cardiac muscle contraction | 24/1404 | 87/8465 | 6.49e-03 | 2.43e-02 | 1.48e-02 | 24 |
| hsa042609 | Colorectum | FAP | Cardiac muscle contraction | 24/1404 | 87/8465 | 6.49e-03 | 2.43e-02 | 1.48e-02 | 24 |
| hsa0426024 | Prostate | BPH | Cardiac muscle contraction | 29/1718 | 87/8465 | 2.91e-03 | 1.12e-02 | 6.91e-03 | 29 |
| hsa04260111 | Prostate | BPH | Cardiac muscle contraction | 29/1718 | 87/8465 | 2.91e-03 | 1.12e-02 | 6.91e-03 | 29 |
| hsa0426061 | Stomach | CAG | Cardiac muscle contraction | 12/368 | 87/8465 | 3.54e-04 | 3.53e-03 | 2.83e-03 | 12 |
| hsa0426071 | Stomach | CAG | Cardiac muscle contraction | 12/368 | 87/8465 | 3.54e-04 | 3.53e-03 | 2.83e-03 | 12 |
| Page: 1 |
Top |
Cell-cell communication analysis |
| Identification of potential cell-cell interactions between two cell types and their ligand-receptor pairs for different disease states |
| Ligand | Receptor | LRpair | Pathway | Tissue | Disease Stage |
| Page: 1 |
Top |
Single-cell gene regulatory network inference analysis |
| Find out the significant the regulons (TFs) and the target genes of each regulon across cell types for different disease states |
| TF | Cell Type | Tissue | Disease Stage | Target Gene | RSS | Regulon Activity |
| ∗The dot plots of a searched regulon are shown for all cell subpopulations in each disease state of each tissue based on the regulon specific score inferred using pySCENIC and by calculating the average expression. |
| Page: 1 |
Top |
Somatic mutation of malignant transformation related genes |
| Annotation of somatic variants for genes involved in malignant transformation |
| Hugo Symbol | Variant Class | Variant Classification | dbSNP RS | HGVSc | HGVSp | HGVSp Short | SWISSPROT | BIOTYPE | SIFT | PolyPhen | Tumor Sample Barcode | Tissue | Histology | Sex | Age | Stage | Therapy Types | Drugs | Outcome |
| ASPH | SNV | Missense_Mutation | c.458N>G | p.Ser153Cys | p.S153C | Q12797 | protein_coding | deleterious_low_confidence(0.01) | possibly_damaging(0.907) | TCGA-A2-A0T0-01 | Breast | breast invasive carcinoma | Female | <65 | I/II | Chemotherapy | taxotere | SD | |
| ASPH | SNV | Missense_Mutation | novel | c.546N>T | p.Glu182Asp | p.E182D | Q12797 | protein_coding | tolerated_low_confidence(0.11) | benign(0.423) | TCGA-AN-A046-01 | Breast | breast invasive carcinoma | Female | >=65 | I/II | Unknown | Unknown | SD |
| ASPH | SNV | Missense_Mutation | novel | c.2270N>G | p.Ala757Gly | p.A757G | Q12797 | protein_coding | tolerated(0.1) | probably_damaging(0.917) | TCGA-BH-A0B8-01 | Breast | breast invasive carcinoma | Female | <65 | I/II | Hormone Therapy | arimidex | SD |
| ASPH | SNV | Missense_Mutation | c.733N>A | p.Asp245Asn | p.D245N | Q12797 | protein_coding | deleterious_low_confidence(0.04) | benign(0.424) | TCGA-E2-A15R-01 | Breast | breast invasive carcinoma | Female | <65 | I/II | Chemotherapy | cyclophosphamide | SD | |
| ASPH | deletion | Frame_Shift_Del | c.380_383delACAC | p.His127LeufsTer65 | p.H127Lfs*65 | Q12797 | protein_coding | TCGA-E2-A14V-01 | Breast | breast invasive carcinoma | Female | <65 | I/II | Chemotherapy | cyclophosphamide | SD | |||
| ASPH | SNV | Missense_Mutation | novel | c.1028N>T | p.Ala343Val | p.A343V | Q12797 | protein_coding | deleterious(0.03) | possibly_damaging(0.691) | TCGA-2W-A8YY-01 | Cervix | cervical & endocervical cancer | Female | <65 | I/II | Chemotherapy | cisplatin | CR |
| ASPH | SNV | Missense_Mutation | novel | c.975N>C | p.Lys325Asn | p.K325N | Q12797 | protein_coding | tolerated(0.3) | possibly_damaging(0.497) | TCGA-2W-A8YY-01 | Cervix | cervical & endocervical cancer | Female | <65 | I/II | Chemotherapy | cisplatin | CR |
| ASPH | SNV | Missense_Mutation | c.1516G>C | p.Glu506Gln | p.E506Q | Q12797 | protein_coding | deleterious(0.01) | probably_damaging(0.981) | TCGA-BI-A0VS-01 | Cervix | cervical & endocervical cancer | Female | <65 | I/II | Unknown | Unknown | SD | |
| ASPH | SNV | Missense_Mutation | c.338N>G | p.Ser113Cys | p.S113C | Q12797 | protein_coding | deleterious_low_confidence(0.05) | possibly_damaging(0.81) | TCGA-DR-A0ZM-01 | Cervix | cervical & endocervical cancer | Female | <65 | III/IV | Unspecific | Cisplatin | SD | |
| ASPH | SNV | Missense_Mutation | rs140478604 | c.1954N>A | p.Glu652Lys | p.E652K | Q12797 | protein_coding | deleterious(0) | possibly_damaging(0.612) | TCGA-EK-A2PG-01 | Cervix | cervical & endocervical cancer | Female | >=65 | I/II | Unknown | Unknown | SD |
| Page: 1 2 3 4 5 6 7 8 9 |
Top |
Related drugs of malignant transformation related genes |
| Identification of chemicals and drugs interact with genes involved in malignant transfromation |
| (DGIdb 4.0) |
| Entrez ID | Symbol | Category | Interaction Types | Drug Claim Name | Drug Name | PMIDs |
| 444 | ASPH | ENZYME, TRANSPORTER | warfarin | WARFARIN | 27488176 |
| Page: 1 |

Copyright 2023-Present -The University of Texas Health Science Center at Houston |