
|
|||||
|
 | |
| |
| |
| |
| |
| |
|
Gene: ASNS |
Gene summary for ASNS |
| Gene information | Species | Human | Gene symbol | ASNS | Gene ID | 440 |
| Gene name | asparagine synthetase (glutamine-hydrolyzing) | |
| Gene Alias | ASNSD | |
| Cytomap | 7q21.3 | |
| Gene Type | protein-coding | GO ID | GO:0000278 | UniProtAcc | P08243 |
Top |
Malignant transformation analysis |
| Identification of the aberrant gene expression in precancerous and cancerous lesions by comparing the gene expression of stem-like cells in diseased tissues with normal stem cells |
| Entrez ID | Symbol | Replicates | Species | Organ | Tissue | Adj P-value | Log2FC | Malignancy |
| 440 | ASNS | LZE21T | Human | Esophagus | ESCC | 3.91e-02 | 2.15e-01 | 0.0655 |
| 440 | ASNS | P2T-E | Human | Esophagus | ESCC | 2.28e-22 | 6.59e-01 | 0.1177 |
| 440 | ASNS | P4T-E | Human | Esophagus | ESCC | 3.35e-28 | 7.84e-01 | 0.1323 |
| 440 | ASNS | P5T-E | Human | Esophagus | ESCC | 1.47e-17 | 6.30e-01 | 0.1327 |
| 440 | ASNS | P8T-E | Human | Esophagus | ESCC | 5.51e-14 | 8.06e-02 | 0.0889 |
| 440 | ASNS | P9T-E | Human | Esophagus | ESCC | 2.55e-08 | 2.04e-01 | 0.1131 |
| 440 | ASNS | P10T-E | Human | Esophagus | ESCC | 7.33e-17 | 5.32e-01 | 0.116 |
| 440 | ASNS | P11T-E | Human | Esophagus | ESCC | 2.23e-10 | 2.61e-01 | 0.1426 |
| 440 | ASNS | P12T-E | Human | Esophagus | ESCC | 2.03e-16 | 5.06e-01 | 0.1122 |
| 440 | ASNS | P15T-E | Human | Esophagus | ESCC | 4.92e-18 | 5.68e-01 | 0.1149 |
| 440 | ASNS | P16T-E | Human | Esophagus | ESCC | 3.10e-32 | 9.58e-01 | 0.1153 |
| 440 | ASNS | P17T-E | Human | Esophagus | ESCC | 3.36e-08 | 1.00e+00 | 0.1278 |
| 440 | ASNS | P19T-E | Human | Esophagus | ESCC | 7.37e-03 | 2.53e-01 | 0.1662 |
| 440 | ASNS | P20T-E | Human | Esophagus | ESCC | 1.88e-13 | 3.81e-01 | 0.1124 |
| 440 | ASNS | P21T-E | Human | Esophagus | ESCC | 1.89e-26 | 8.52e-01 | 0.1617 |
| 440 | ASNS | P22T-E | Human | Esophagus | ESCC | 3.73e-08 | 2.11e-01 | 0.1236 |
| 440 | ASNS | P23T-E | Human | Esophagus | ESCC | 2.12e-18 | 9.79e-01 | 0.108 |
| 440 | ASNS | P24T-E | Human | Esophagus | ESCC | 2.90e-16 | 6.72e-01 | 0.1287 |
| 440 | ASNS | P26T-E | Human | Esophagus | ESCC | 1.31e-31 | 8.13e-01 | 0.1276 |
| 440 | ASNS | P27T-E | Human | Esophagus | ESCC | 2.35e-10 | 3.35e-01 | 0.1055 |
| Page: 1 2 3 4 |
| Tissue | Expression Dynamics | Abbreviation |
| Esophagus | 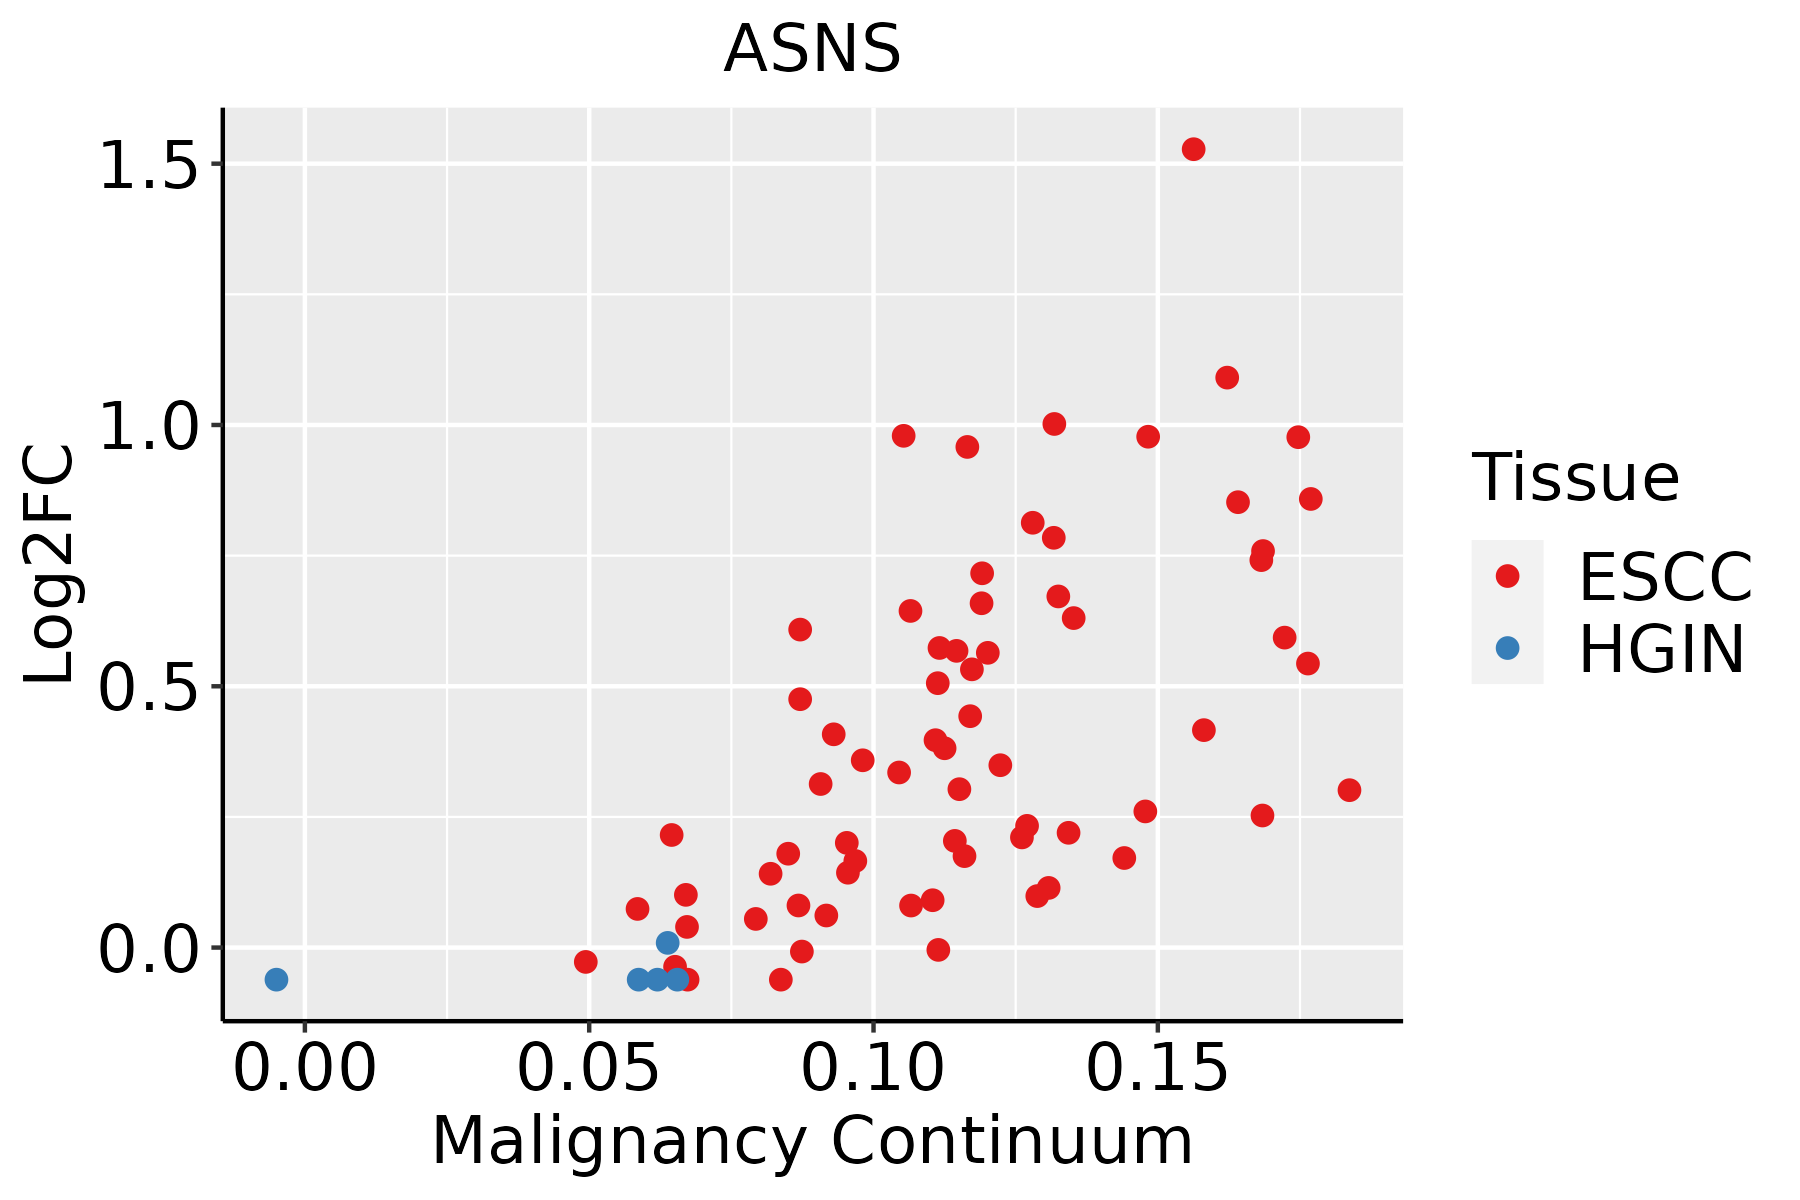 | ESCC: Esophageal squamous cell carcinoma |
| HGIN: High-grade intraepithelial neoplasias | ||
| LGIN: Low-grade intraepithelial neoplasias | ||
| Thyroid | 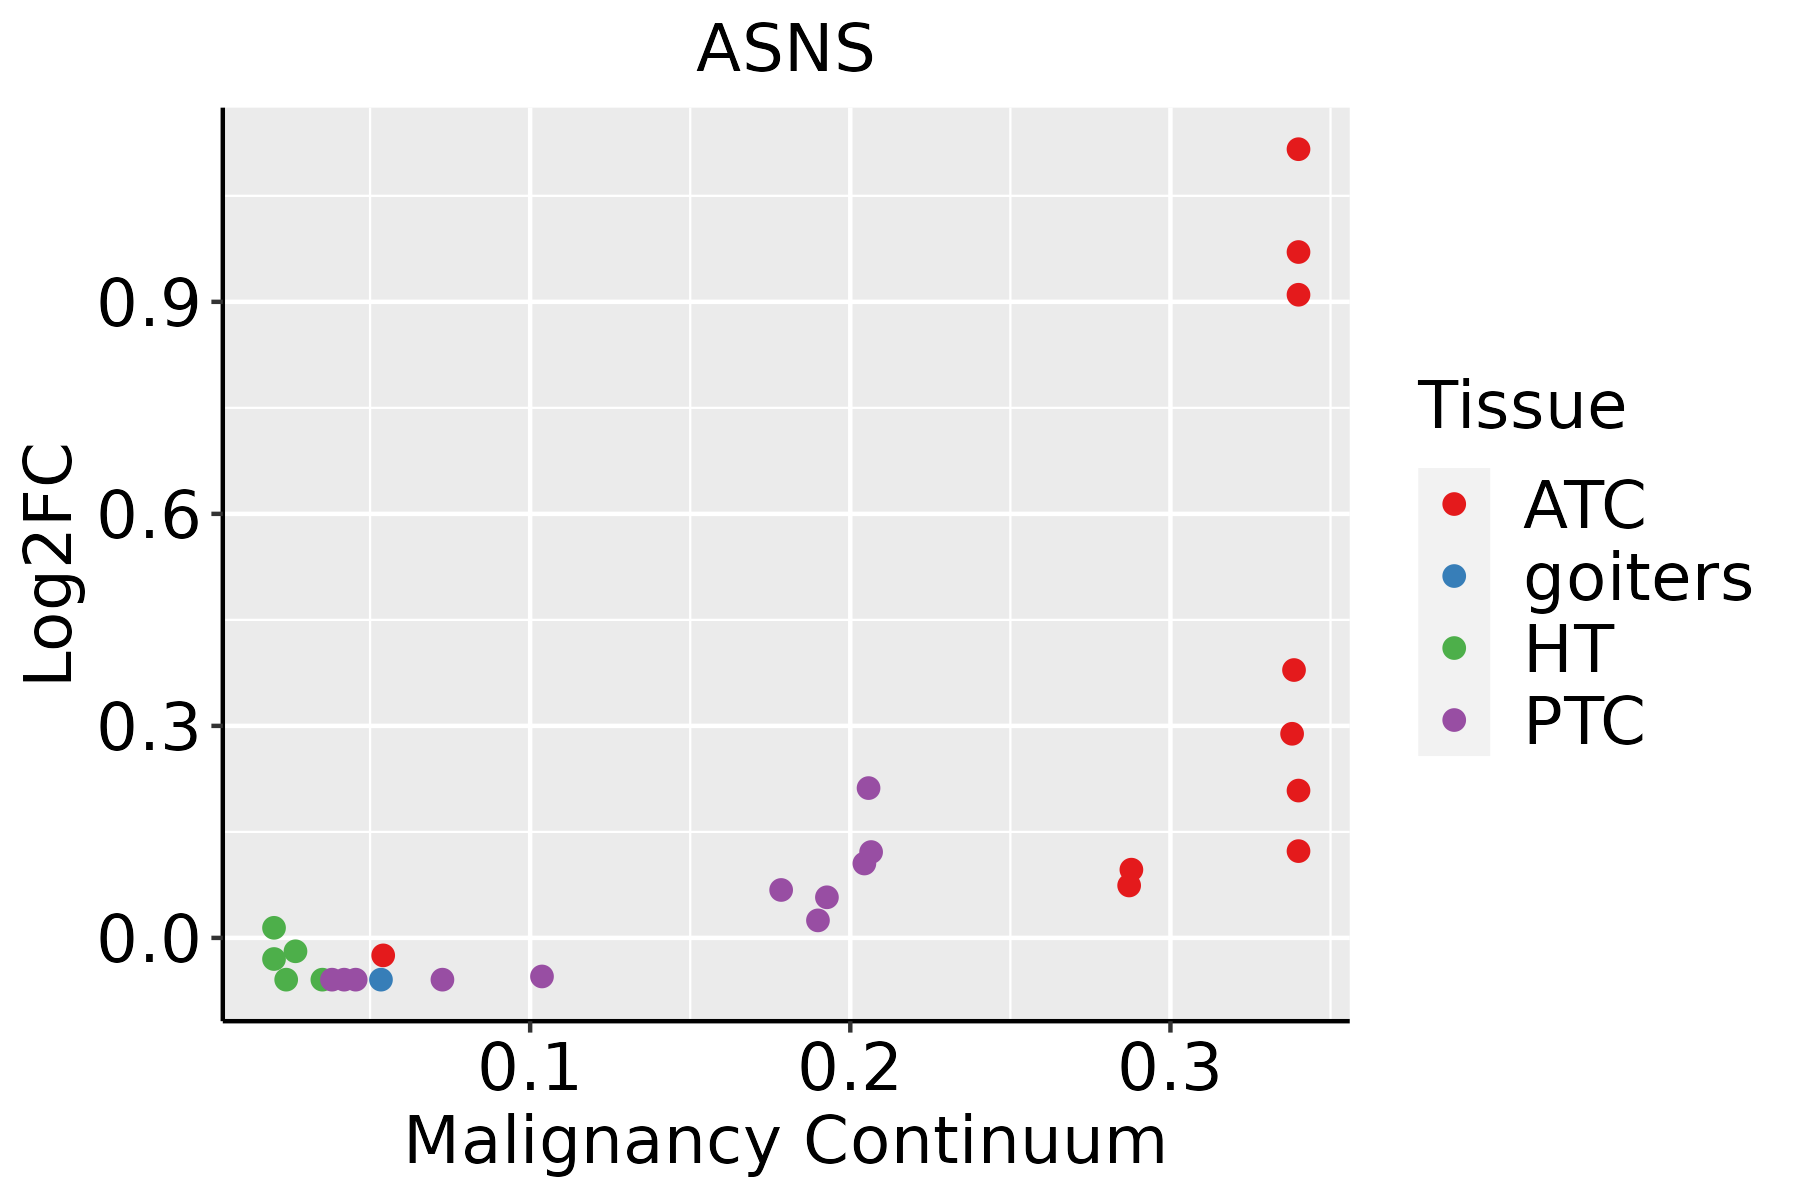 | ATC: Anaplastic thyroid cancer |
| HT: Hashimoto's thyroiditis | ||
| PTC: Papillary thyroid cancer |
| ∗log2FC in expression of this searched gene in stem-like cells from each diseased tissue sample relative to stem-like cells in normal samples in each tissue plotted against the malignancy continuum. Samples are colored based on if they are from different disease stage. |
Top |
Malignant transformation related pathway analysis |
| Find out the enriched GO biological processes and KEGG pathways involved in transition from healthy to precancer to cancer |
| Tissue | Disease Stage | Enriched GO biological Processes |
| Colorectum | AD |  |
| Colorectum | SER |  |
| Colorectum | MSS |  |
| Colorectum | MSI-H |  |
| Colorectum | FAP |  |
| ∗Top 15 enriched GO BP terms are showed in the bar plot of each disease state in each tissue. Each row represents a significant GO biological process which is colored according to the -log10(p.adjust). |
| Page: 1 2 3 4 5 6 7 8 9 |
| GO ID | Tissue | Disease Stage | Description | Gene Ratio | Bg Ratio | pvalue | p.adjust | Count |
| GO:000734615 | Esophagus | ESCC | regulation of mitotic cell cycle | 293/8552 | 457/18723 | 8.00e-16 | 5.64e-14 | 293 |
| GO:0071496111 | Esophagus | ESCC | cellular response to external stimulus | 215/8552 | 320/18723 | 4.29e-15 | 2.43e-13 | 215 |
| GO:0031668111 | Esophagus | ESCC | cellular response to extracellular stimulus | 168/8552 | 246/18723 | 4.93e-13 | 2.23e-11 | 168 |
| GO:0031669110 | Esophagus | ESCC | cellular response to nutrient levels | 148/8552 | 215/18723 | 4.58e-12 | 1.76e-10 | 148 |
| GO:0048732111 | Esophagus | ESCC | gland development | 269/8552 | 436/18723 | 7.81e-12 | 2.95e-10 | 269 |
| GO:0031667111 | Esophagus | ESCC | response to nutrient levels | 289/8552 | 474/18723 | 9.25e-12 | 3.47e-10 | 289 |
| GO:000931419 | Esophagus | ESCC | response to radiation | 277/8552 | 456/18723 | 4.42e-11 | 1.43e-09 | 277 |
| GO:0009267110 | Esophagus | ESCC | cellular response to starvation | 110/8552 | 156/18723 | 2.63e-10 | 7.37e-09 | 110 |
| GO:004259419 | Esophagus | ESCC | response to starvation | 133/8552 | 197/18723 | 4.31e-10 | 1.14e-08 | 133 |
| GO:004578710 | Esophagus | ESCC | positive regulation of cell cycle | 196/8552 | 313/18723 | 9.27e-10 | 2.24e-08 | 196 |
| GO:004593116 | Esophagus | ESCC | positive regulation of mitotic cell cycle | 83/8552 | 121/18723 | 2.78e-07 | 4.08e-06 | 83 |
| GO:0061008110 | Esophagus | ESCC | hepaticobiliary system development | 98/8552 | 150/18723 | 8.91e-07 | 1.15e-05 | 98 |
| GO:0001889110 | Esophagus | ESCC | liver development | 96/8552 | 147/18723 | 1.18e-06 | 1.47e-05 | 96 |
| GO:000941611 | Esophagus | ESCC | response to light stimulus | 183/8552 | 320/18723 | 2.03e-05 | 1.76e-04 | 183 |
| GO:00421492 | Esophagus | ESCC | cellular response to glucose starvation | 36/8552 | 48/18723 | 3.43e-05 | 2.80e-04 | 36 |
| GO:00432007 | Esophagus | ESCC | response to amino acid | 74/8552 | 116/18723 | 6.23e-05 | 4.76e-04 | 74 |
| GO:000110110 | Esophagus | ESCC | response to acid chemical | 84/8552 | 135/18723 | 7.70e-05 | 5.74e-04 | 84 |
| GO:000963620 | Esophagus | ESCC | response to toxic substance | 150/8552 | 262/18723 | 1.00e-04 | 7.12e-04 | 150 |
| GO:00086525 | Esophagus | ESCC | cellular amino acid biosynthetic process | 51/8552 | 76/18723 | 1.30e-04 | 8.88e-04 | 51 |
| GO:00463948 | Esophagus | ESCC | carboxylic acid biosynthetic process | 175/8552 | 314/18723 | 1.98e-04 | 1.26e-03 | 175 |
| Page: 1 2 3 4 5 |
| Pathway ID | Tissue | Disease Stage | Description | Gene Ratio | Bg Ratio | pvalue | p.adjust | qvalue | Count |
| hsa0123023 | Esophagus | ESCC | Biosynthesis of amino acids | 49/4205 | 75/8465 | 4.35e-03 | 1.12e-02 | 5.74e-03 | 49 |
| hsa0123033 | Esophagus | ESCC | Biosynthesis of amino acids | 49/4205 | 75/8465 | 4.35e-03 | 1.12e-02 | 5.74e-03 | 49 |
| Page: 1 |
Top |
Cell-cell communication analysis |
| Identification of potential cell-cell interactions between two cell types and their ligand-receptor pairs for different disease states |
| Ligand | Receptor | LRpair | Pathway | Tissue | Disease Stage |
| Page: 1 |
Top |
Single-cell gene regulatory network inference analysis |
| Find out the significant the regulons (TFs) and the target genes of each regulon across cell types for different disease states |
| TF | Cell Type | Tissue | Disease Stage | Target Gene | RSS | Regulon Activity |
| ∗The dot plots of a searched regulon are shown for all cell subpopulations in each disease state of each tissue based on the regulon specific score inferred using pySCENIC and by calculating the average expression. |
| Page: 1 |
Top |
Somatic mutation of malignant transformation related genes |
| Annotation of somatic variants for genes involved in malignant transformation |
| Hugo Symbol | Variant Class | Variant Classification | dbSNP RS | HGVSc | HGVSp | HGVSp Short | SWISSPROT | BIOTYPE | SIFT | PolyPhen | Tumor Sample Barcode | Tissue | Histology | Sex | Age | Stage | Therapy Types | Drugs | Outcome |
| ASNS | SNV | Missense_Mutation | c.1487N>T | p.Ala496Val | p.A496V | P08243 | protein_coding | tolerated(0.23) | benign(0) | TCGA-A2-A25B-01 | Breast | breast invasive carcinoma | Female | <65 | I/II | Chemotherapy | taxotere | PD | |
| ASNS | SNV | Missense_Mutation | c.169N>C | p.Phe57Leu | p.F57L | P08243 | protein_coding | tolerated(0.49) | benign(0.055) | TCGA-A7-A26G-01 | Breast | breast invasive carcinoma | Female | <65 | I/II | Chemotherapy | taxotere | SD | |
| ASNS | SNV | Missense_Mutation | c.1474N>A | p.Gln492Lys | p.Q492K | P08243 | protein_coding | tolerated(0.93) | benign(0.007) | TCGA-AC-A23H-01 | Breast | breast invasive carcinoma | Female | >=65 | I/II | Unknown | Unknown | PD | |
| ASNS | SNV | Missense_Mutation | novel | c.1176N>T | p.Arg392Ser | p.R392S | P08243 | protein_coding | deleterious(0) | probably_damaging(0.996) | TCGA-AR-A24Q-01 | Breast | breast invasive carcinoma | Female | <65 | I/II | Chemotherapy | doxorubicin | SD |
| ASNS | SNV | Missense_Mutation | novel | c.802N>A | p.Ala268Thr | p.A268T | P08243 | protein_coding | deleterious(0) | probably_damaging(0.965) | TCGA-XX-A89A-01 | Breast | breast invasive carcinoma | Female | >=65 | I/II | Unknown | Unknown | SD |
| ASNS | SNV | Missense_Mutation | c.1555C>T | p.Arg519Cys | p.R519C | P08243 | protein_coding | deleterious(0) | probably_damaging(0.983) | TCGA-2W-A8YY-01 | Cervix | cervical & endocervical cancer | Female | <65 | I/II | Chemotherapy | cisplatin | CR | |
| ASNS | SNV | Missense_Mutation | novel | c.1352C>T | p.Thr451Met | p.T451M | P08243 | protein_coding | deleterious(0) | benign(0.436) | TCGA-2W-A8YY-01 | Cervix | cervical & endocervical cancer | Female | <65 | I/II | Chemotherapy | cisplatin | CR |
| ASNS | SNV | Missense_Mutation | novel | c.541N>T | p.Leu181Phe | p.L181F | P08243 | protein_coding | tolerated(0.08) | benign(0.423) | TCGA-C5-A905-01 | Cervix | cervical & endocervical cancer | Female | <65 | I/II | Unknown | Unknown | SD |
| ASNS | SNV | Missense_Mutation | novel | c.1643C>G | p.Ser548Cys | p.S548C | P08243 | protein_coding | deleterious(0) | probably_damaging(1) | TCGA-VS-A94Z-01 | Cervix | cervical & endocervical cancer | Female | <65 | I/II | Chemotherapy | cisplatin | CR |
| ASNS | SNV | Missense_Mutation | c.632N>T | p.Pro211Leu | p.P211L | P08243 | protein_coding | deleterious(0.04) | probably_damaging(0.916) | TCGA-A6-3808-01 | Colorectum | colon adenocarcinoma | Male | >=65 | I/II | Unknown | Unknown | SD |
| Page: 1 2 3 4 5 6 7 |
Top |
Related drugs of malignant transformation related genes |
| Identification of chemicals and drugs interact with genes involved in malignant transfromation |
| (DGIdb 4.0) |
| Entrez ID | Symbol | Category | Interaction Types | Drug Claim Name | Drug Name | PMIDs |
| 440 | ASNS | CLINICALLY ACTIONABLE, ENZYME, DRUG RESISTANCE | ASPARAGINASE | ASPARAGINASE | 28069604 | |
| 440 | ASNS | CLINICALLY ACTIONABLE, ENZYME, DRUG RESISTANCE | asparaginase | ASPARAGINASE | 24268318 | |
| 440 | ASNS | CLINICALLY ACTIONABLE, ENZYME, DRUG RESISTANCE | L-ASPARAGINASE | ASPARAGINASE | 11556848 |
| Page: 1 |

Copyright 2023-Present -The University of Texas Health Science Center at Houston |