
|
|||||
|
 | |
| |
| |
| |
| |
| |
|
Gene: ASNA1 |
Gene summary for ASNA1 |
| Gene information | Species | Human | Gene symbol | ASNA1 | Gene ID | 439 |
| Gene name | guided entry of tail-anchored proteins factor 3, ATPase | |
| Gene Alias | ARSA-I | |
| Cytomap | 19p13.13 | |
| Gene Type | protein-coding | GO ID | GO:0006605 | UniProtAcc | O43681 |
Top |
Malignant transformation analysis |
| Identification of the aberrant gene expression in precancerous and cancerous lesions by comparing the gene expression of stem-like cells in diseased tissues with normal stem cells |
| Entrez ID | Symbol | Replicates | Species | Organ | Tissue | Adj P-value | Log2FC | Malignancy |
| 439 | ASNA1 | P1T-E | Human | Esophagus | ESCC | 1.81e-11 | 6.83e-01 | 0.0875 |
| 439 | ASNA1 | P2T-E | Human | Esophagus | ESCC | 2.51e-39 | 6.69e-01 | 0.1177 |
| 439 | ASNA1 | P4T-E | Human | Esophagus | ESCC | 7.59e-32 | 8.76e-01 | 0.1323 |
| 439 | ASNA1 | P5T-E | Human | Esophagus | ESCC | 3.16e-45 | 8.21e-01 | 0.1327 |
| 439 | ASNA1 | P8T-E | Human | Esophagus | ESCC | 1.77e-61 | 1.10e+00 | 0.0889 |
| 439 | ASNA1 | P9T-E | Human | Esophagus | ESCC | 1.03e-29 | 9.30e-01 | 0.1131 |
| 439 | ASNA1 | P10T-E | Human | Esophagus | ESCC | 4.92e-60 | 9.86e-01 | 0.116 |
| 439 | ASNA1 | P11T-E | Human | Esophagus | ESCC | 1.08e-24 | 1.12e+00 | 0.1426 |
| 439 | ASNA1 | P12T-E | Human | Esophagus | ESCC | 5.31e-59 | 1.04e+00 | 0.1122 |
| 439 | ASNA1 | P15T-E | Human | Esophagus | ESCC | 6.26e-43 | 9.44e-01 | 0.1149 |
| 439 | ASNA1 | P16T-E | Human | Esophagus | ESCC | 2.06e-37 | 6.27e-01 | 0.1153 |
| 439 | ASNA1 | P17T-E | Human | Esophagus | ESCC | 3.35e-23 | 1.14e+00 | 0.1278 |
| 439 | ASNA1 | P19T-E | Human | Esophagus | ESCC | 1.90e-12 | 1.33e+00 | 0.1662 |
| 439 | ASNA1 | P20T-E | Human | Esophagus | ESCC | 1.74e-42 | 1.03e+00 | 0.1124 |
| 439 | ASNA1 | P21T-E | Human | Esophagus | ESCC | 1.47e-91 | 1.62e+00 | 0.1617 |
| 439 | ASNA1 | P22T-E | Human | Esophagus | ESCC | 4.72e-68 | 1.11e+00 | 0.1236 |
| 439 | ASNA1 | P23T-E | Human | Esophagus | ESCC | 1.41e-68 | 1.80e+00 | 0.108 |
| 439 | ASNA1 | P24T-E | Human | Esophagus | ESCC | 2.32e-55 | 1.21e+00 | 0.1287 |
| 439 | ASNA1 | P26T-E | Human | Esophagus | ESCC | 4.88e-74 | 1.31e+00 | 0.1276 |
| 439 | ASNA1 | P27T-E | Human | Esophagus | ESCC | 4.60e-58 | 1.16e+00 | 0.1055 |
| Page: 1 2 3 4 5 6 7 |
| Tissue | Expression Dynamics | Abbreviation |
| Esophagus |  | ESCC: Esophageal squamous cell carcinoma |
| HGIN: High-grade intraepithelial neoplasias | ||
| LGIN: Low-grade intraepithelial neoplasias | ||
| Liver | 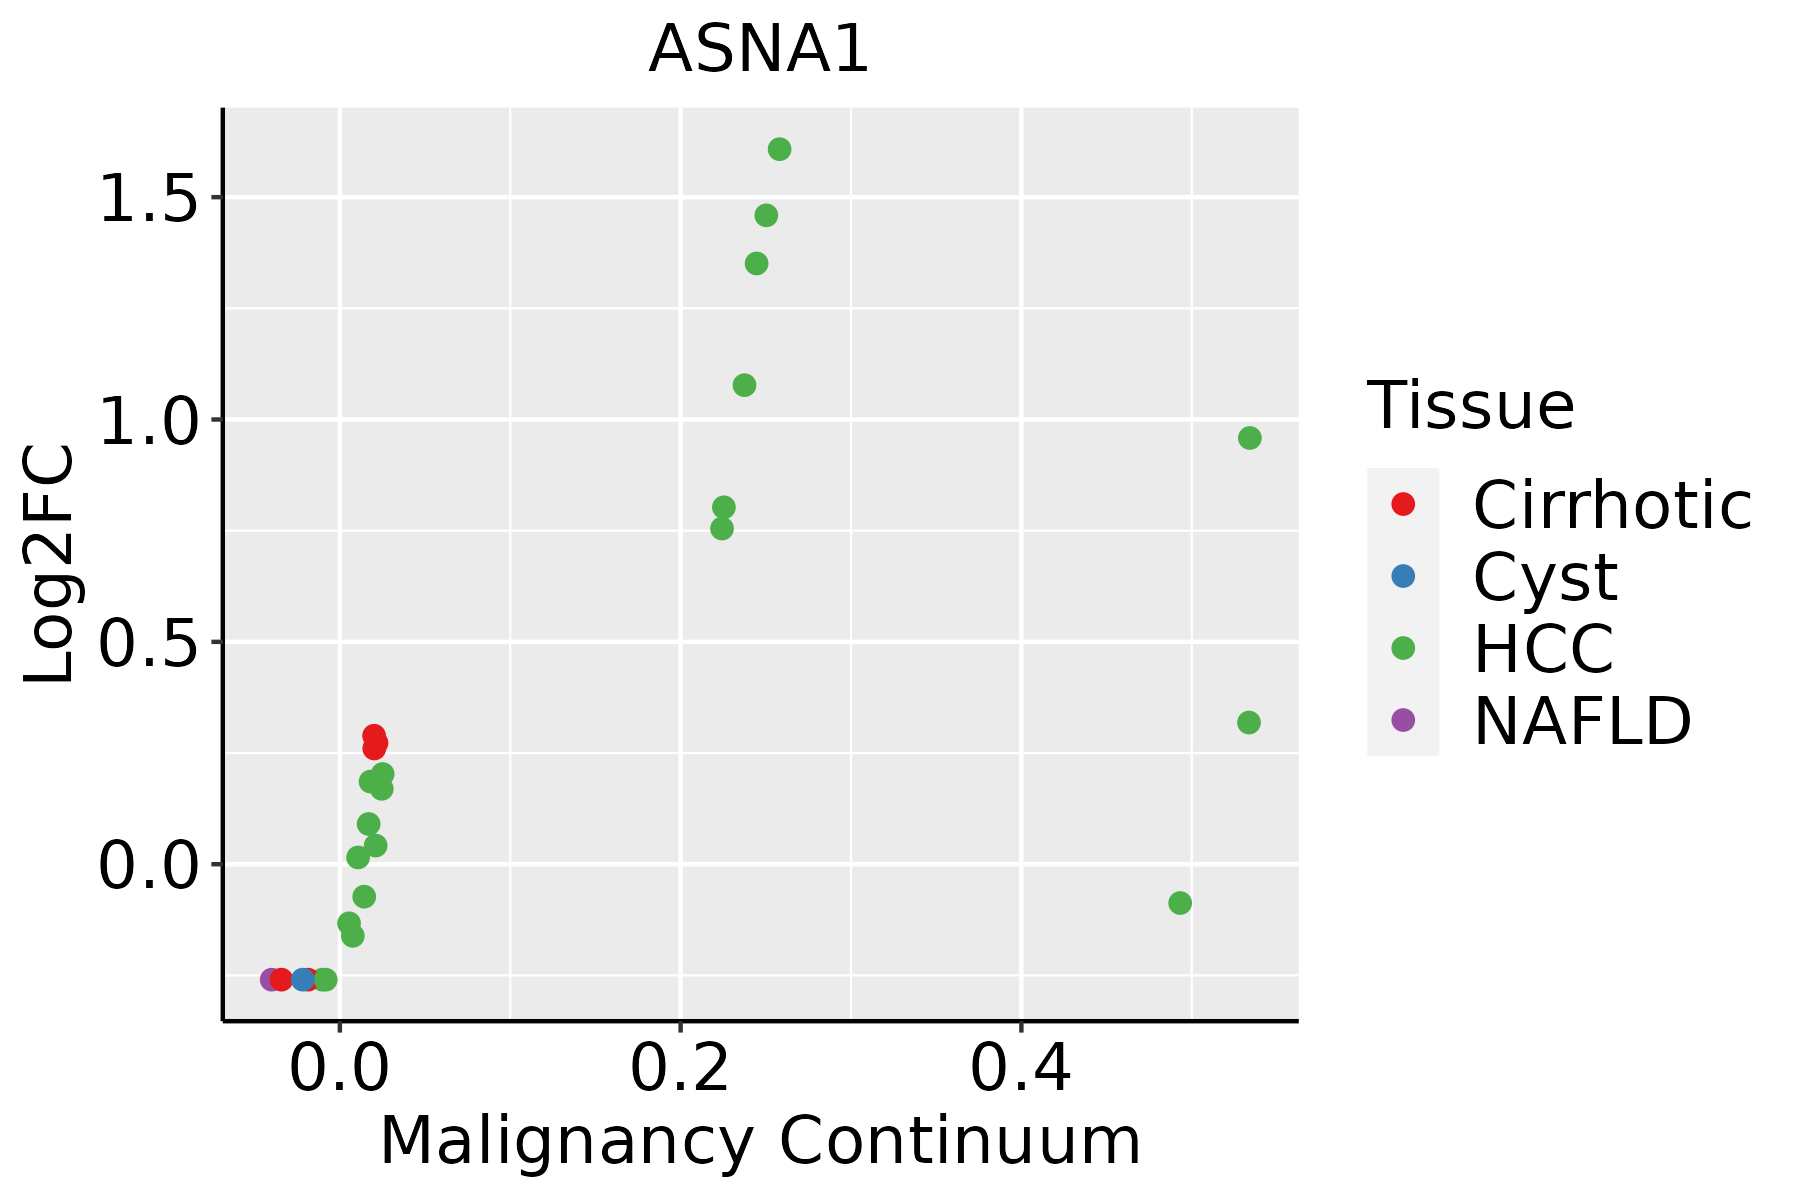 | HCC: Hepatocellular carcinoma |
| NAFLD: Non-alcoholic fatty liver disease | ||
| Oral Cavity | 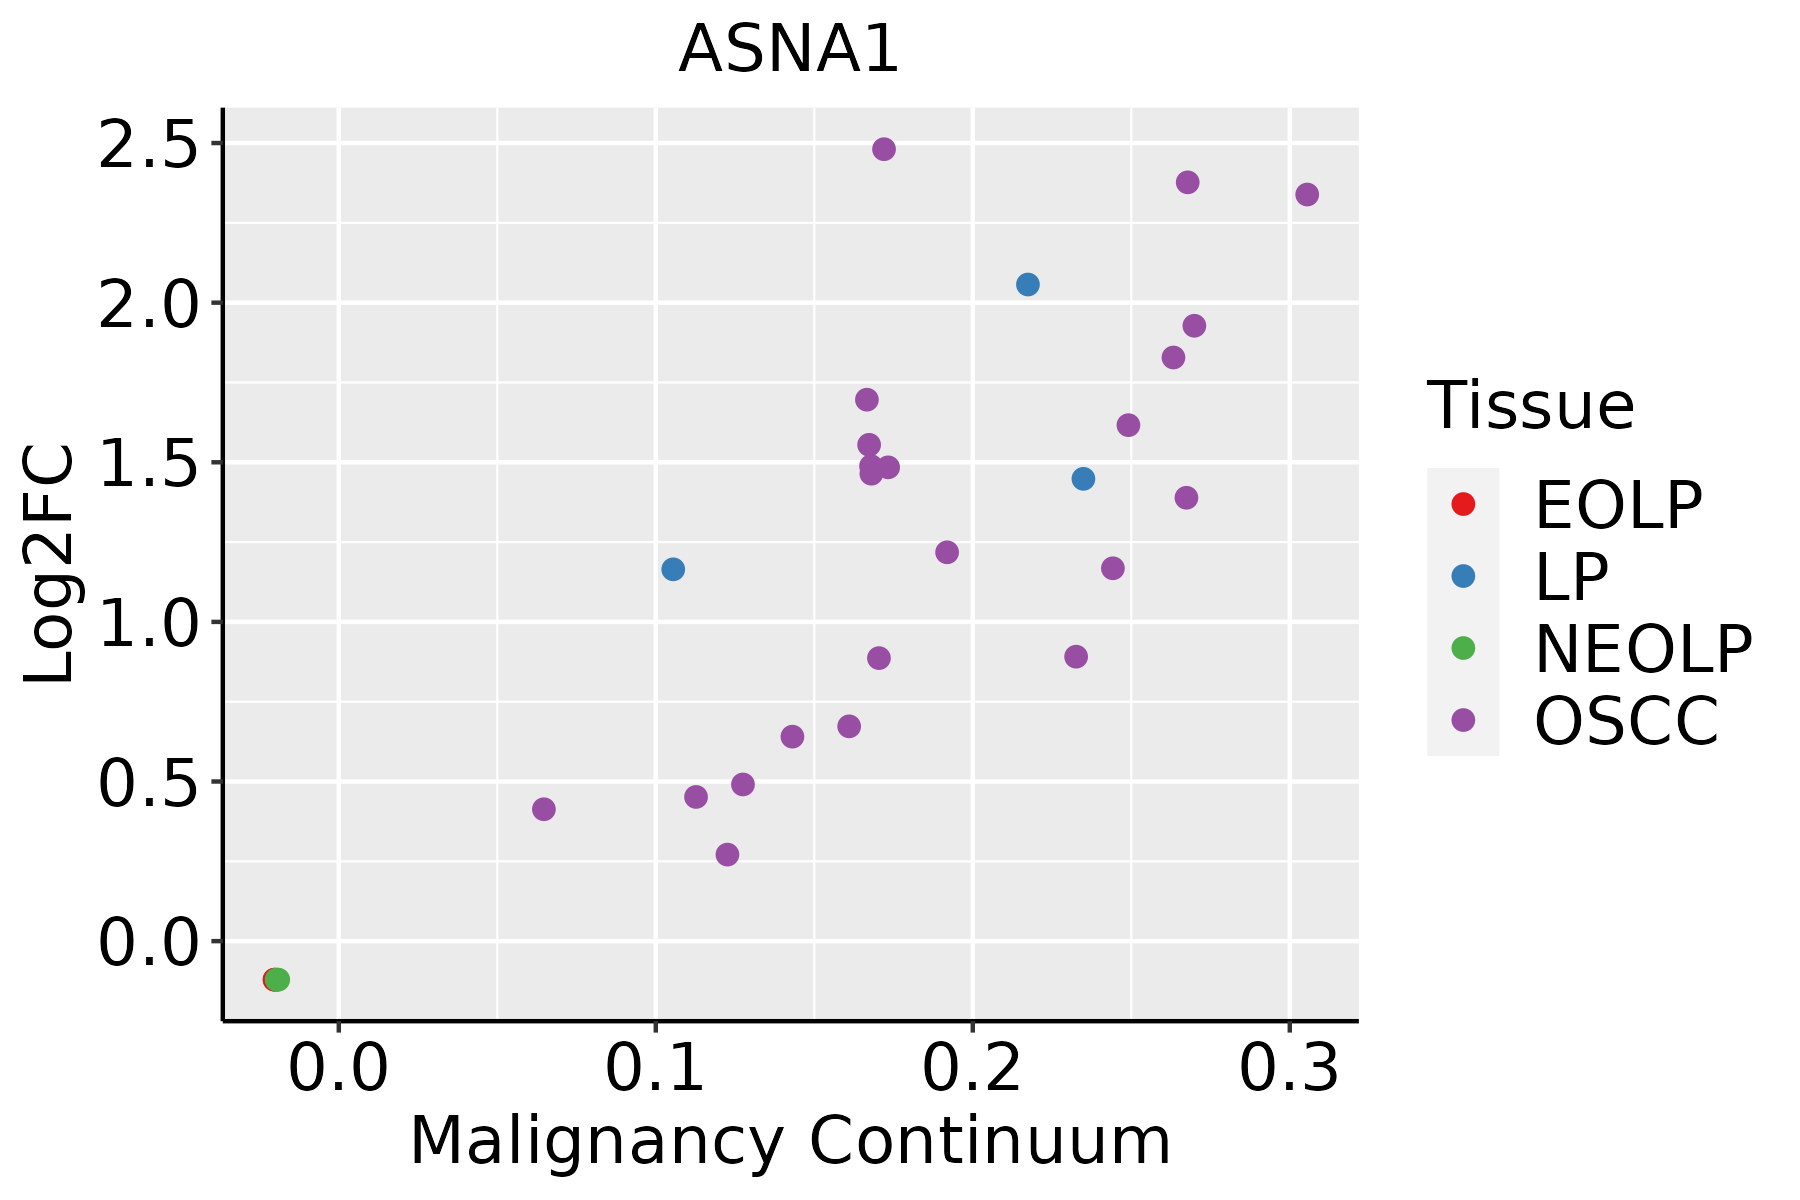 | EOLP: Erosive Oral lichen planus |
| LP: leukoplakia | ||
| NEOLP: Non-erosive oral lichen planus | ||
| OSCC: Oral squamous cell carcinoma | ||
| Prostate | 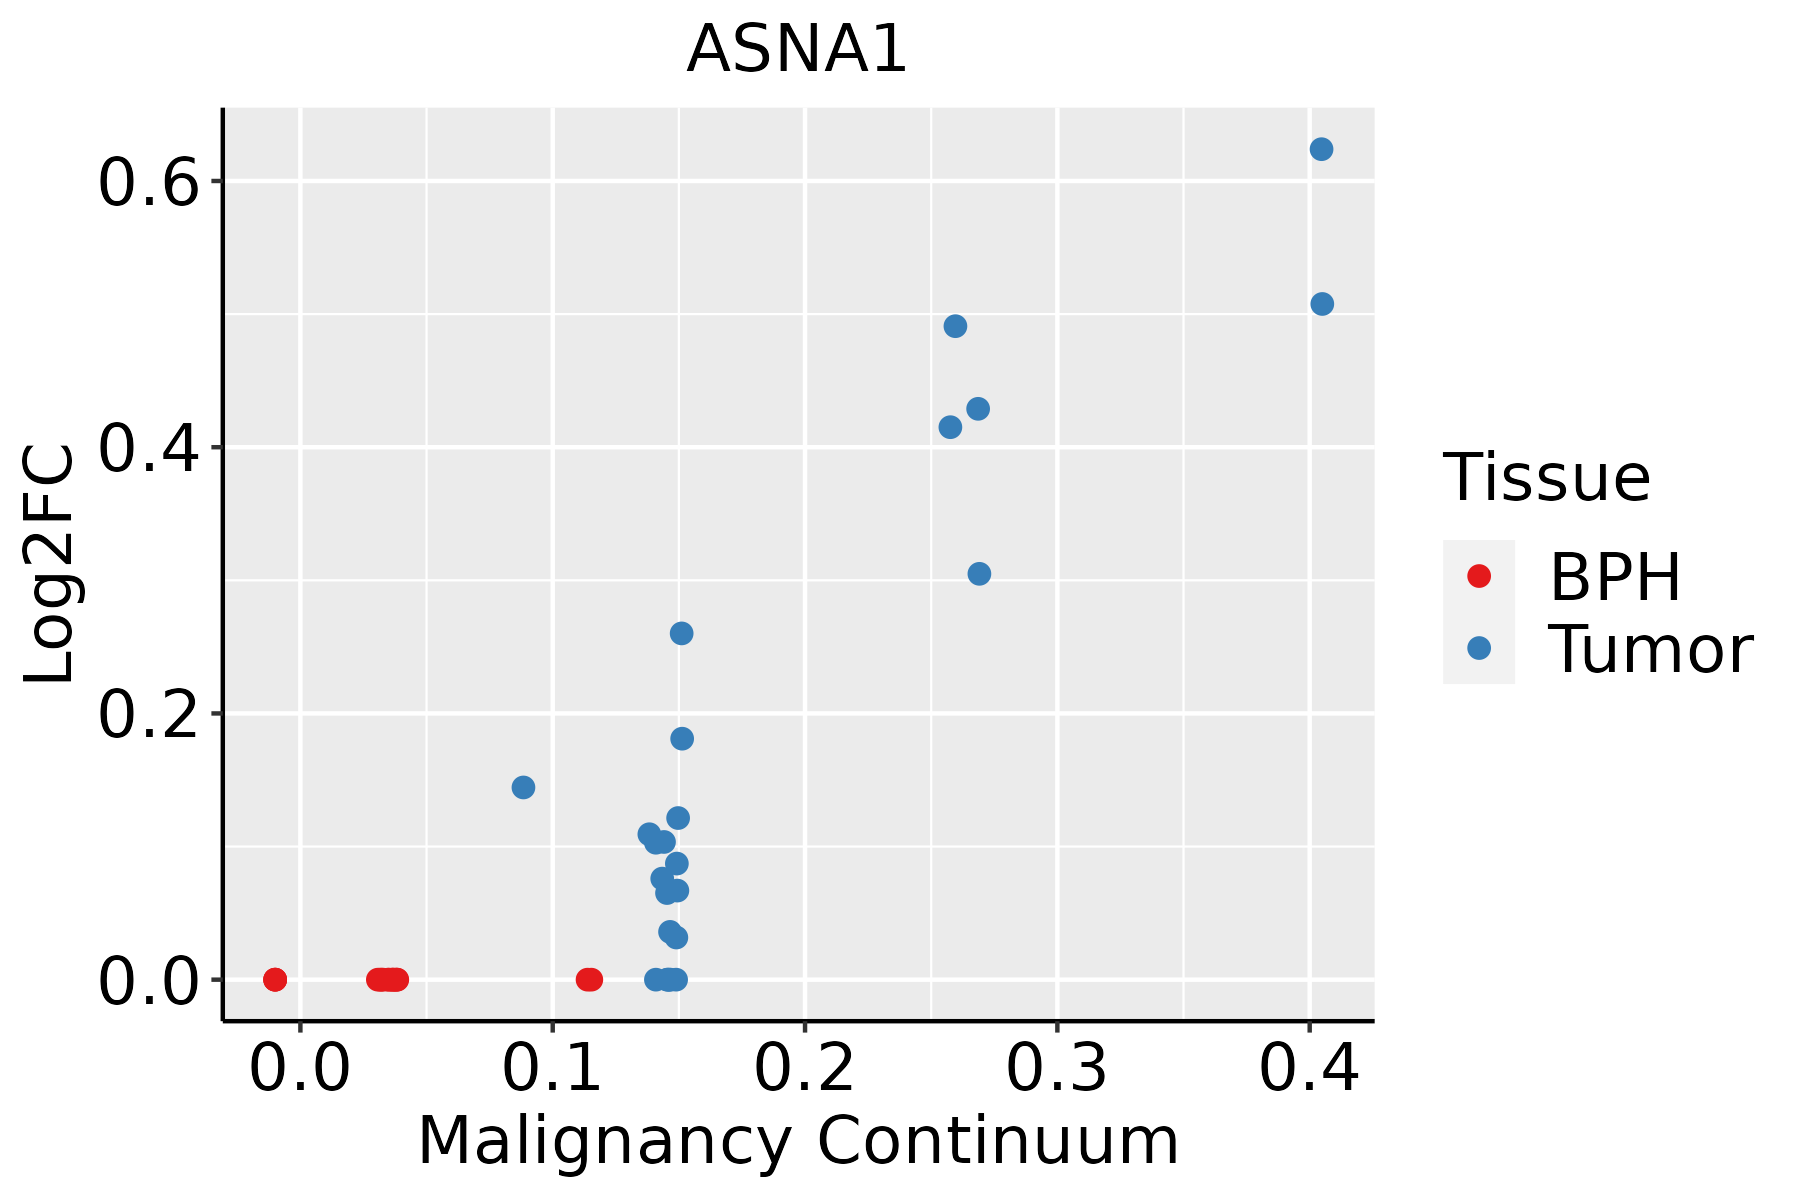 | BPH: Benign Prostatic Hyperplasia |
| Skin | 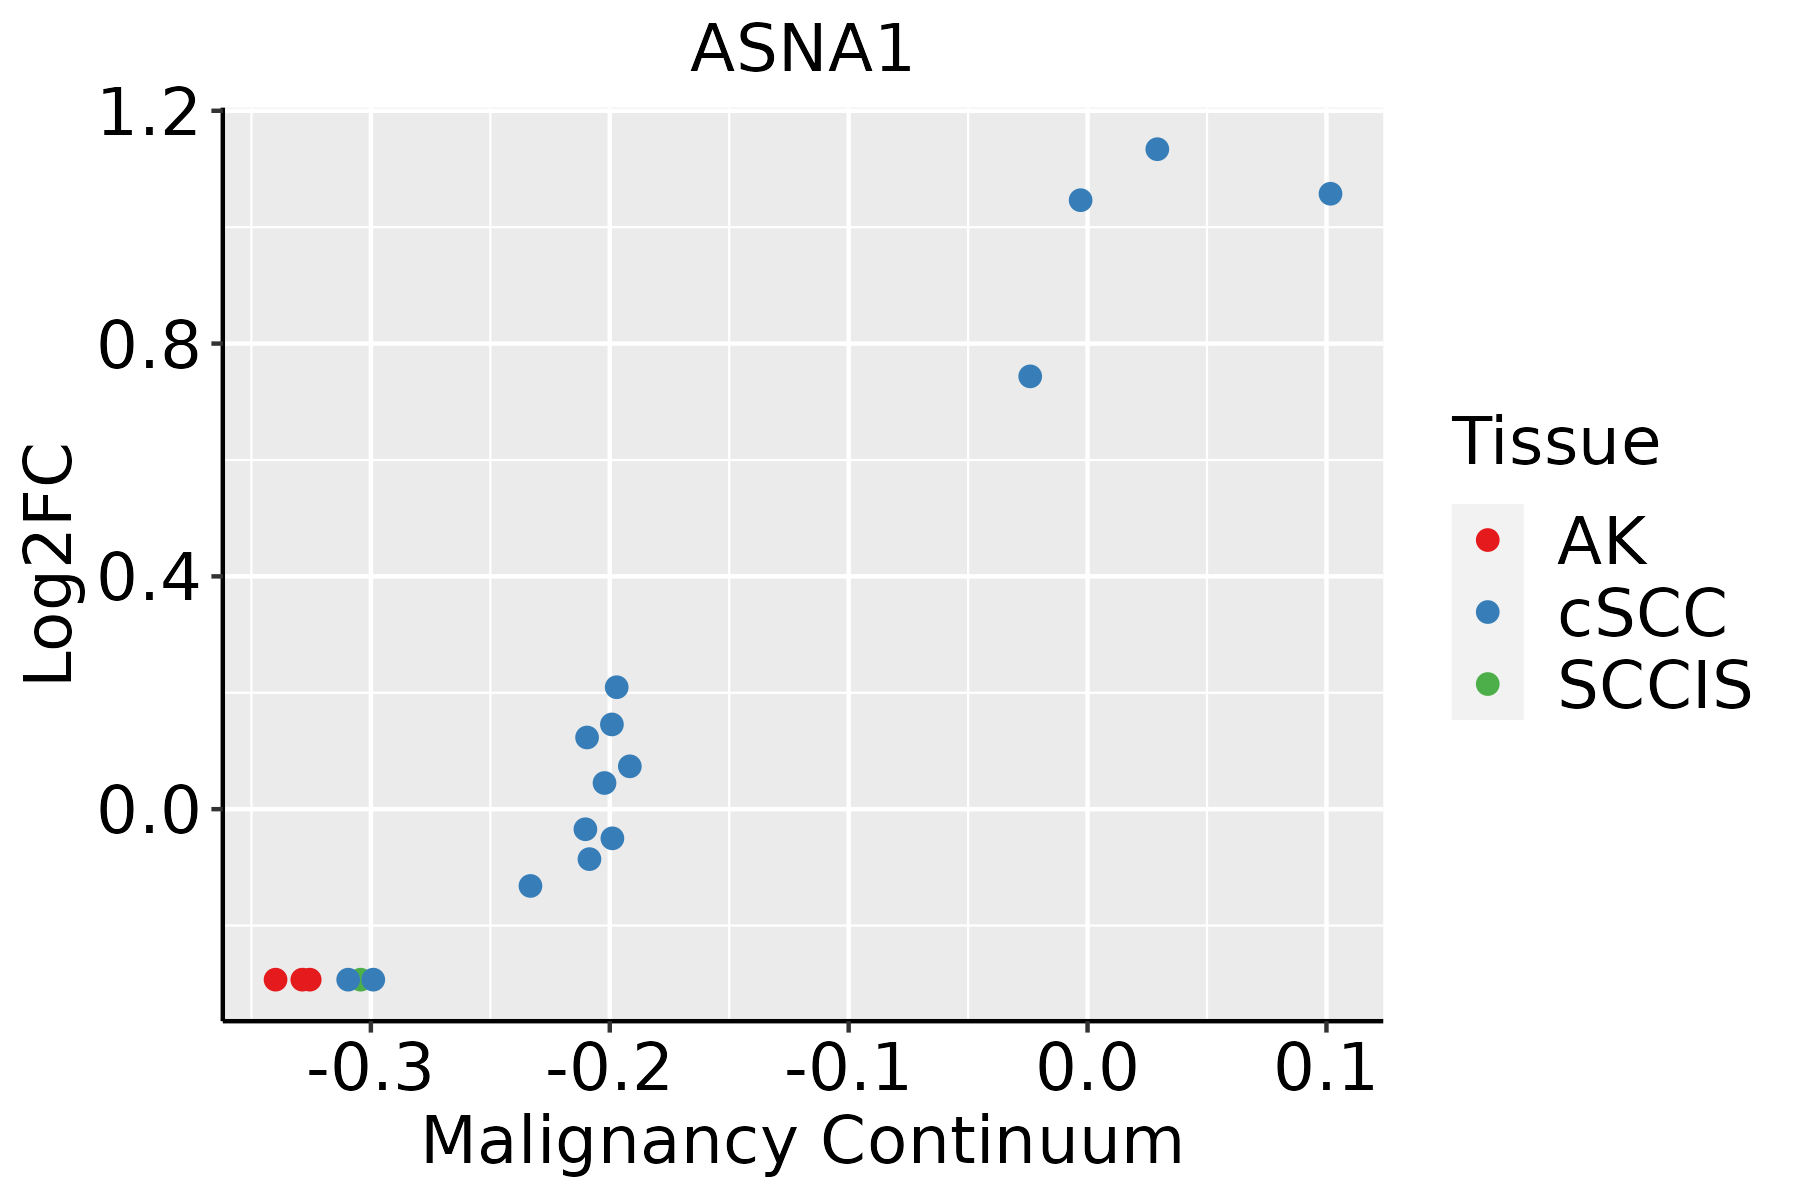 | AK: Actinic keratosis |
| cSCC: Cutaneous squamous cell carcinoma | ||
| SCCIS:squamous cell carcinoma in situ | ||
| Thyroid |  | ATC: Anaplastic thyroid cancer |
| HT: Hashimoto's thyroiditis | ||
| PTC: Papillary thyroid cancer |
| ∗log2FC in expression of this searched gene in stem-like cells from each diseased tissue sample relative to stem-like cells in normal samples in each tissue plotted against the malignancy continuum. Samples are colored based on if they are from different disease stage. |
Top |
Malignant transformation related pathway analysis |
| Find out the enriched GO biological processes and KEGG pathways involved in transition from healthy to precancer to cancer |
| Tissue | Disease Stage | Enriched GO biological Processes |
| Colorectum | AD |  |
| Colorectum | SER |  |
| Colorectum | MSS |  |
| Colorectum | MSI-H |  |
| Colorectum | FAP |  |
| ∗Top 15 enriched GO BP terms are showed in the bar plot of each disease state in each tissue. Each row represents a significant GO biological process which is colored according to the -log10(p.adjust). |
| Page: 1 2 3 4 5 6 7 8 9 |
| GO ID | Tissue | Disease Stage | Description | Gene Ratio | Bg Ratio | pvalue | p.adjust | Count |
| Page: 1 |
| Pathway ID | Tissue | Disease Stage | Description | Gene Ratio | Bg Ratio | pvalue | p.adjust | qvalue | Count |
| Page: 1 |
Top |
Cell-cell communication analysis |
| Identification of potential cell-cell interactions between two cell types and their ligand-receptor pairs for different disease states |
| Ligand | Receptor | LRpair | Pathway | Tissue | Disease Stage |
| Page: 1 |
Top |
Single-cell gene regulatory network inference analysis |
| Find out the significant the regulons (TFs) and the target genes of each regulon across cell types for different disease states |
| TF | Cell Type | Tissue | Disease Stage | Target Gene | RSS | Regulon Activity |
| ∗The dot plots of a searched regulon are shown for all cell subpopulations in each disease state of each tissue based on the regulon specific score inferred using pySCENIC and by calculating the average expression. |
| Page: 1 |
Top |
Somatic mutation of malignant transformation related genes |
| Annotation of somatic variants for genes involved in malignant transformation |
| Hugo Symbol | Variant Class | Variant Classification | dbSNP RS | HGVSc | HGVSp | HGVSp Short | SWISSPROT | BIOTYPE | SIFT | PolyPhen | Tumor Sample Barcode | Tissue | Histology | Sex | Age | Stage | Therapy Types | Drugs | Outcome |
| ASNA1 | SNV | Missense_Mutation | rs760898791 | c.358N>A | p.Glu120Lys | p.E120K | O43681 | protein_coding | tolerated(0.14) | benign(0.005) | TCGA-AN-A046-01 | Breast | breast invasive carcinoma | Female | >=65 | I/II | Unknown | Unknown | SD |
| ASNA1 | SNV | Missense_Mutation | c.967N>A | p.His323Asn | p.H323N | O43681 | protein_coding | tolerated(0.35) | benign(0.01) | TCGA-E2-A1LA-01 | Breast | breast invasive carcinoma | Female | <65 | I/II | Hormone Therapy | arimidex | SD | |
| ASNA1 | insertion | In_Frame_Ins | novel | c.347_348insCGAGTTCTT | p.Phe118_Glu120dup | p.F118_E120dup | O43681 | protein_coding | TCGA-S3-AA12-01 | Breast | breast invasive carcinoma | Female | >=65 | III/IV | Hormone Therapy | anastrozole | SD | ||
| ASNA1 | SNV | Missense_Mutation | novel | c.241G>C | p.Asp81His | p.D81H | O43681 | protein_coding | deleterious(0) | probably_damaging(1) | TCGA-C5-A2LZ-01 | Cervix | cervical & endocervical cancer | Female | >=65 | III/IV | Unknown | Unknown | PD |
| ASNA1 | SNV | Missense_Mutation | novel | c.908N>A | p.Leu303Gln | p.L303Q | O43681 | protein_coding | deleterious(0) | probably_damaging(0.989) | TCGA-EK-A2IP-01 | Cervix | cervical & endocervical cancer | Female | <65 | I/II | Unknown | Unknown | SD |
| ASNA1 | SNV | Missense_Mutation | c.154N>G | p.Thr52Ala | p.T52A | O43681 | protein_coding | deleterious(0.04) | probably_damaging(0.974) | TCGA-D5-6540-01 | Colorectum | colon adenocarcinoma | Male | >=65 | I/II | Unknown | Unknown | SD | |
| ASNA1 | SNV | Missense_Mutation | rs779733037 | c.919N>A | p.Glu307Lys | p.E307K | O43681 | protein_coding | tolerated(0.66) | benign(0.024) | TCGA-DM-A288-01 | Colorectum | colon adenocarcinoma | Male | >=65 | III/IV | Unknown | Unknown | PD |
| ASNA1 | SNV | Missense_Mutation | rs779152850 | c.674C>T | p.Thr225Met | p.T225M | O43681 | protein_coding | tolerated(1) | benign(0.019) | TCGA-A5-A0G1-01 | Endometrium | uterine corpus endometrioid carcinoma | Female | >=65 | I/II | Unknown | Unknown | SD |
| ASNA1 | SNV | Missense_Mutation | novel | c.480C>A | p.Phe160Leu | p.F160L | O43681 | protein_coding | tolerated(0.05) | benign(0.189) | TCGA-A5-A0G2-01 | Endometrium | uterine corpus endometrioid carcinoma | Female | <65 | III/IV | Unknown | Unknown | SD |
| ASNA1 | SNV | Missense_Mutation | rs780011838 | c.739G>A | p.Val247Ile | p.V247I | O43681 | protein_coding | deleterious(0.01) | possibly_damaging(0.777) | TCGA-A5-A2K5-01 | Endometrium | uterine corpus endometrioid carcinoma | Female | >=65 | I/II | Unknown | Unknown | SD |
| Page: 1 2 3 |
Top |
Related drugs of malignant transformation related genes |
| Identification of chemicals and drugs interact with genes involved in malignant transfromation |
| (DGIdb 4.0) |
| Entrez ID | Symbol | Category | Interaction Types | Drug Claim Name | Drug Name | PMIDs |
| Page: 1 |

Copyright 2023-Present -The University of Texas Health Science Center at Houston |