
|
|||||
|
 | |
| |
| |
| |
| |
| |
|
Gene: ASMTL |
Gene summary for ASMTL |
| Gene information | Species | Human | Gene symbol | ASMTL | Gene ID | 8623 |
| Gene name | acetylserotonin O-methyltransferase like | |
| Gene Alias | ASMTLX | |
| Cytomap | X | |
| Gene Type | protein-coding | GO ID | GO:0006139 | UniProtAcc | O95671 |
Top |
Malignant transformation analysis |
| Identification of the aberrant gene expression in precancerous and cancerous lesions by comparing the gene expression of stem-like cells in diseased tissues with normal stem cells |
| Entrez ID | Symbol | Replicates | Species | Organ | Tissue | Adj P-value | Log2FC | Malignancy |
| 8623 | ASMTL | LZE4T | Human | Esophagus | ESCC | 9.80e-07 | 3.26e-01 | 0.0811 |
| 8623 | ASMTL | LZE8T | Human | Esophagus | ESCC | 1.53e-04 | 7.21e-02 | 0.067 |
| 8623 | ASMTL | LZE22T | Human | Esophagus | ESCC | 3.17e-06 | 4.08e-01 | 0.068 |
| 8623 | ASMTL | LZE24T | Human | Esophagus | ESCC | 7.46e-05 | 2.19e-02 | 0.0596 |
| 8623 | ASMTL | P1T-E | Human | Esophagus | ESCC | 8.04e-10 | 3.73e-01 | 0.0875 |
| 8623 | ASMTL | P2T-E | Human | Esophagus | ESCC | 5.82e-17 | 2.57e-01 | 0.1177 |
| 8623 | ASMTL | P4T-E | Human | Esophagus | ESCC | 3.07e-17 | 3.53e-01 | 0.1323 |
| 8623 | ASMTL | P5T-E | Human | Esophagus | ESCC | 1.25e-17 | 4.19e-01 | 0.1327 |
| 8623 | ASMTL | P8T-E | Human | Esophagus | ESCC | 1.95e-19 | 2.95e-01 | 0.0889 |
| 8623 | ASMTL | P9T-E | Human | Esophagus | ESCC | 2.14e-04 | 1.15e-01 | 0.1131 |
| 8623 | ASMTL | P10T-E | Human | Esophagus | ESCC | 1.70e-23 | 2.69e-01 | 0.116 |
| 8623 | ASMTL | P11T-E | Human | Esophagus | ESCC | 2.61e-13 | 6.20e-01 | 0.1426 |
| 8623 | ASMTL | P12T-E | Human | Esophagus | ESCC | 3.22e-34 | 7.05e-01 | 0.1122 |
| 8623 | ASMTL | P15T-E | Human | Esophagus | ESCC | 6.32e-14 | 2.70e-01 | 0.1149 |
| 8623 | ASMTL | P16T-E | Human | Esophagus | ESCC | 2.63e-16 | 1.90e-01 | 0.1153 |
| 8623 | ASMTL | P17T-E | Human | Esophagus | ESCC | 2.44e-02 | 1.00e-01 | 0.1278 |
| 8623 | ASMTL | P19T-E | Human | Esophagus | ESCC | 4.00e-04 | 4.66e-01 | 0.1662 |
| 8623 | ASMTL | P20T-E | Human | Esophagus | ESCC | 2.74e-10 | 2.13e-01 | 0.1124 |
| 8623 | ASMTL | P21T-E | Human | Esophagus | ESCC | 3.73e-23 | 1.50e-01 | 0.1617 |
| 8623 | ASMTL | P22T-E | Human | Esophagus | ESCC | 4.46e-19 | 1.96e-01 | 0.1236 |
| Page: 1 2 3 4 5 |
| Tissue | Expression Dynamics | Abbreviation |
| Esophagus | 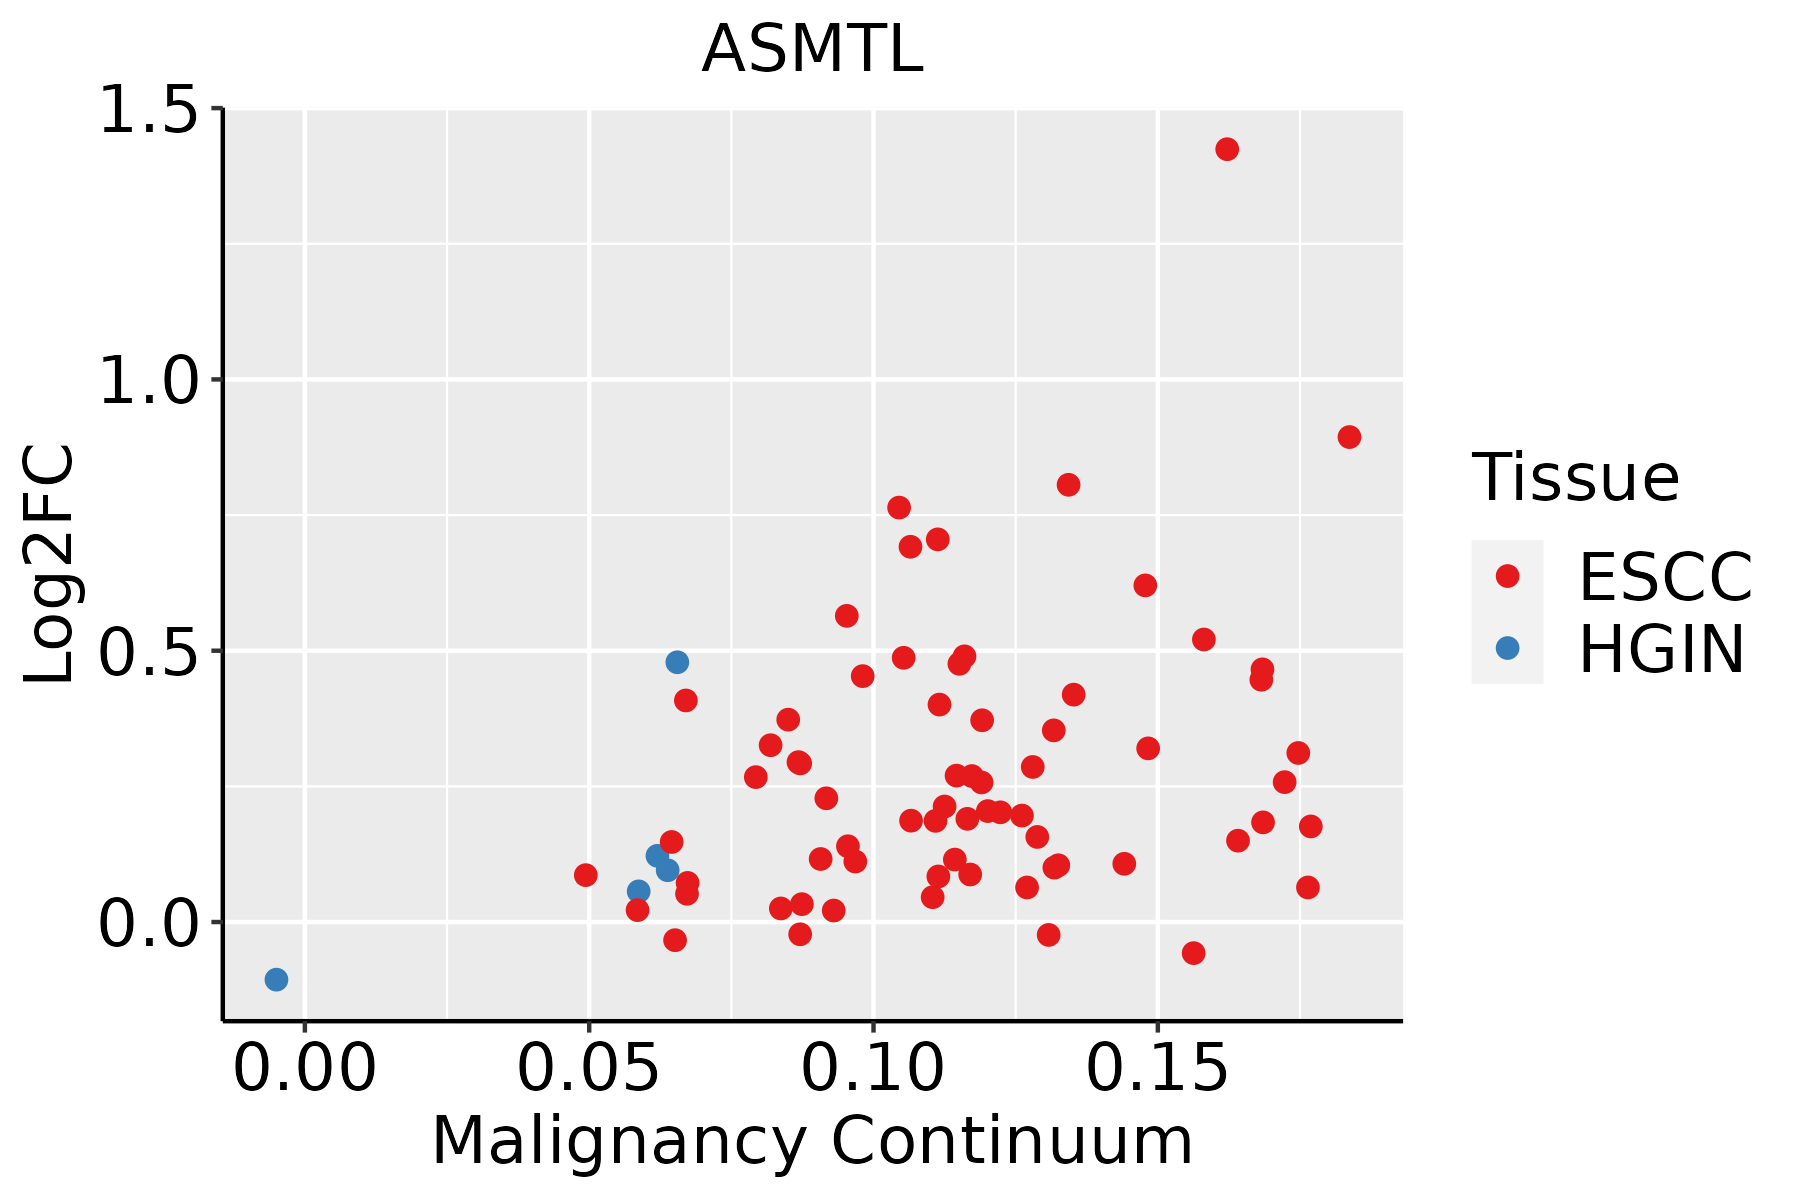 | ESCC: Esophageal squamous cell carcinoma |
| HGIN: High-grade intraepithelial neoplasias | ||
| LGIN: Low-grade intraepithelial neoplasias | ||
| Liver | 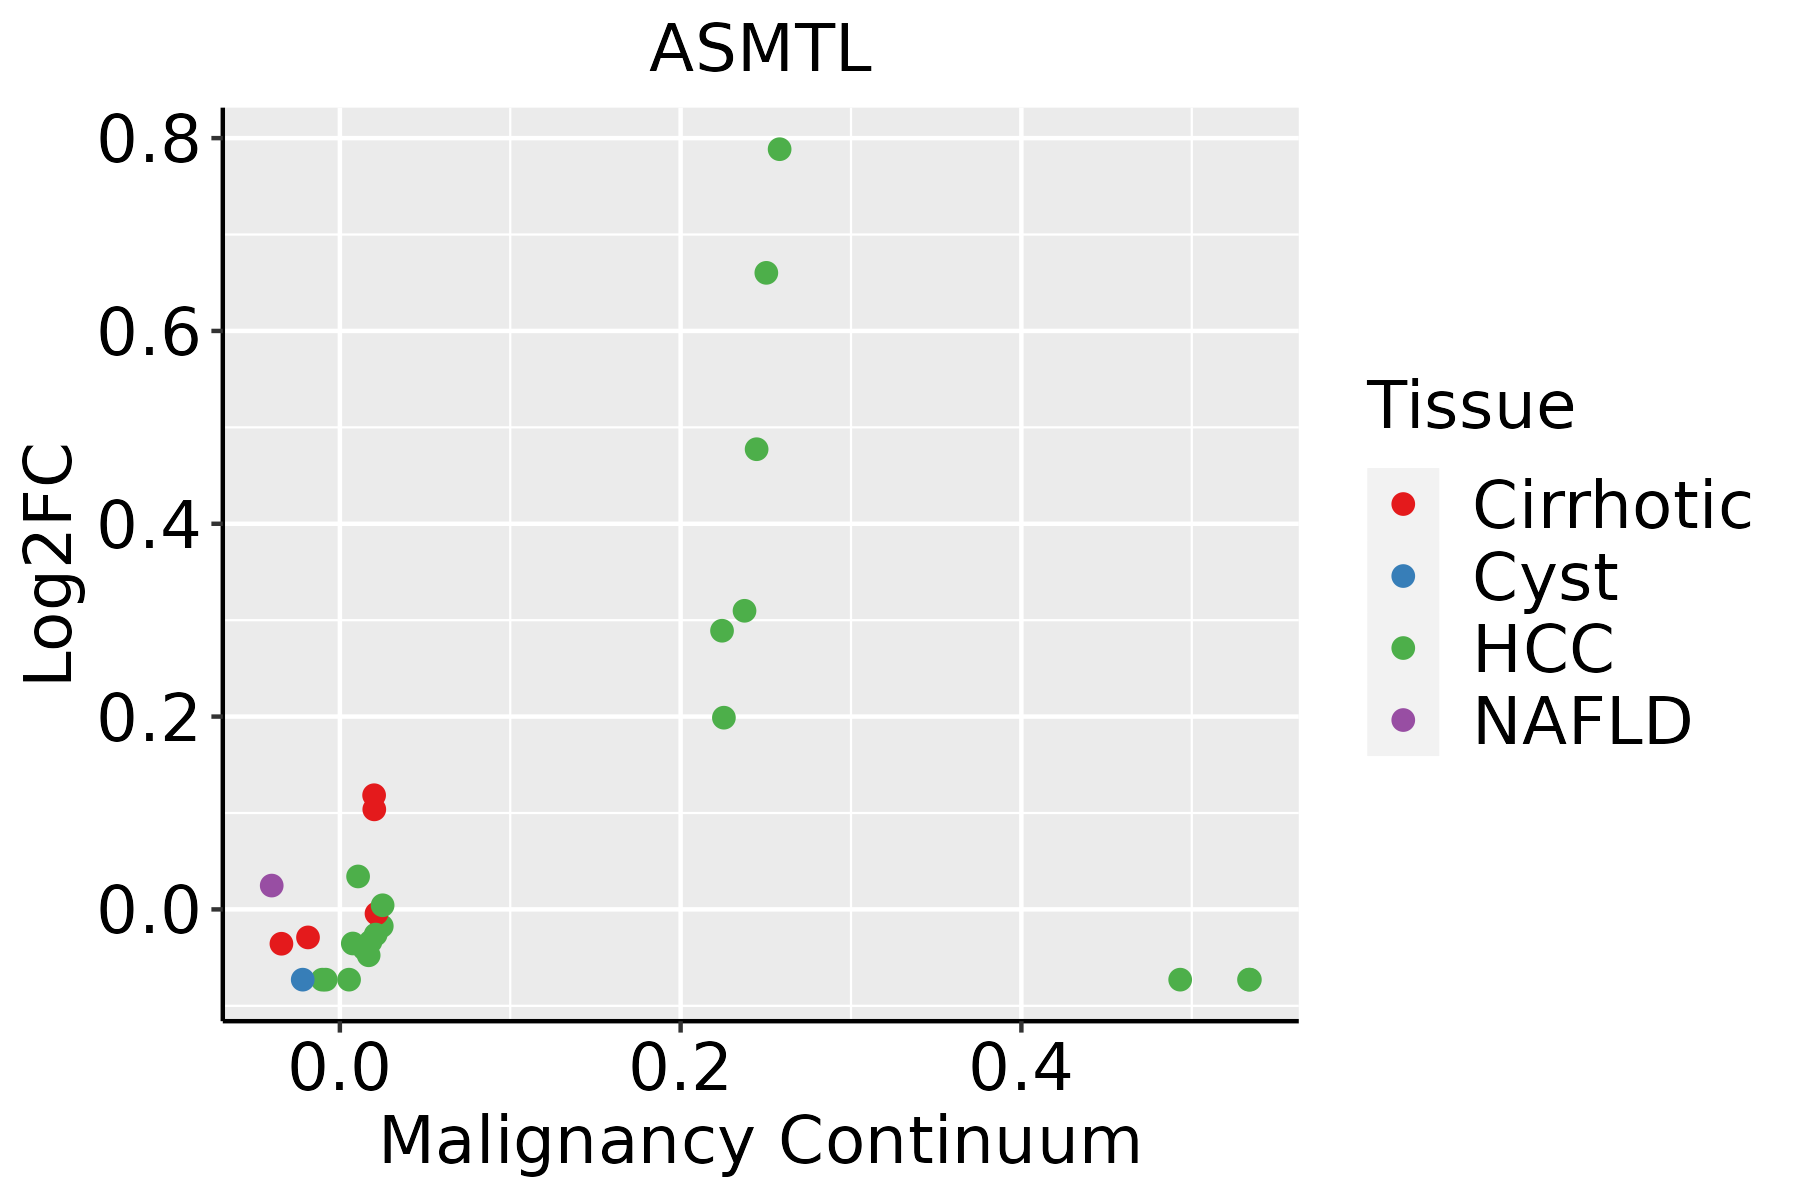 | HCC: Hepatocellular carcinoma |
| NAFLD: Non-alcoholic fatty liver disease | ||
| Oral Cavity | 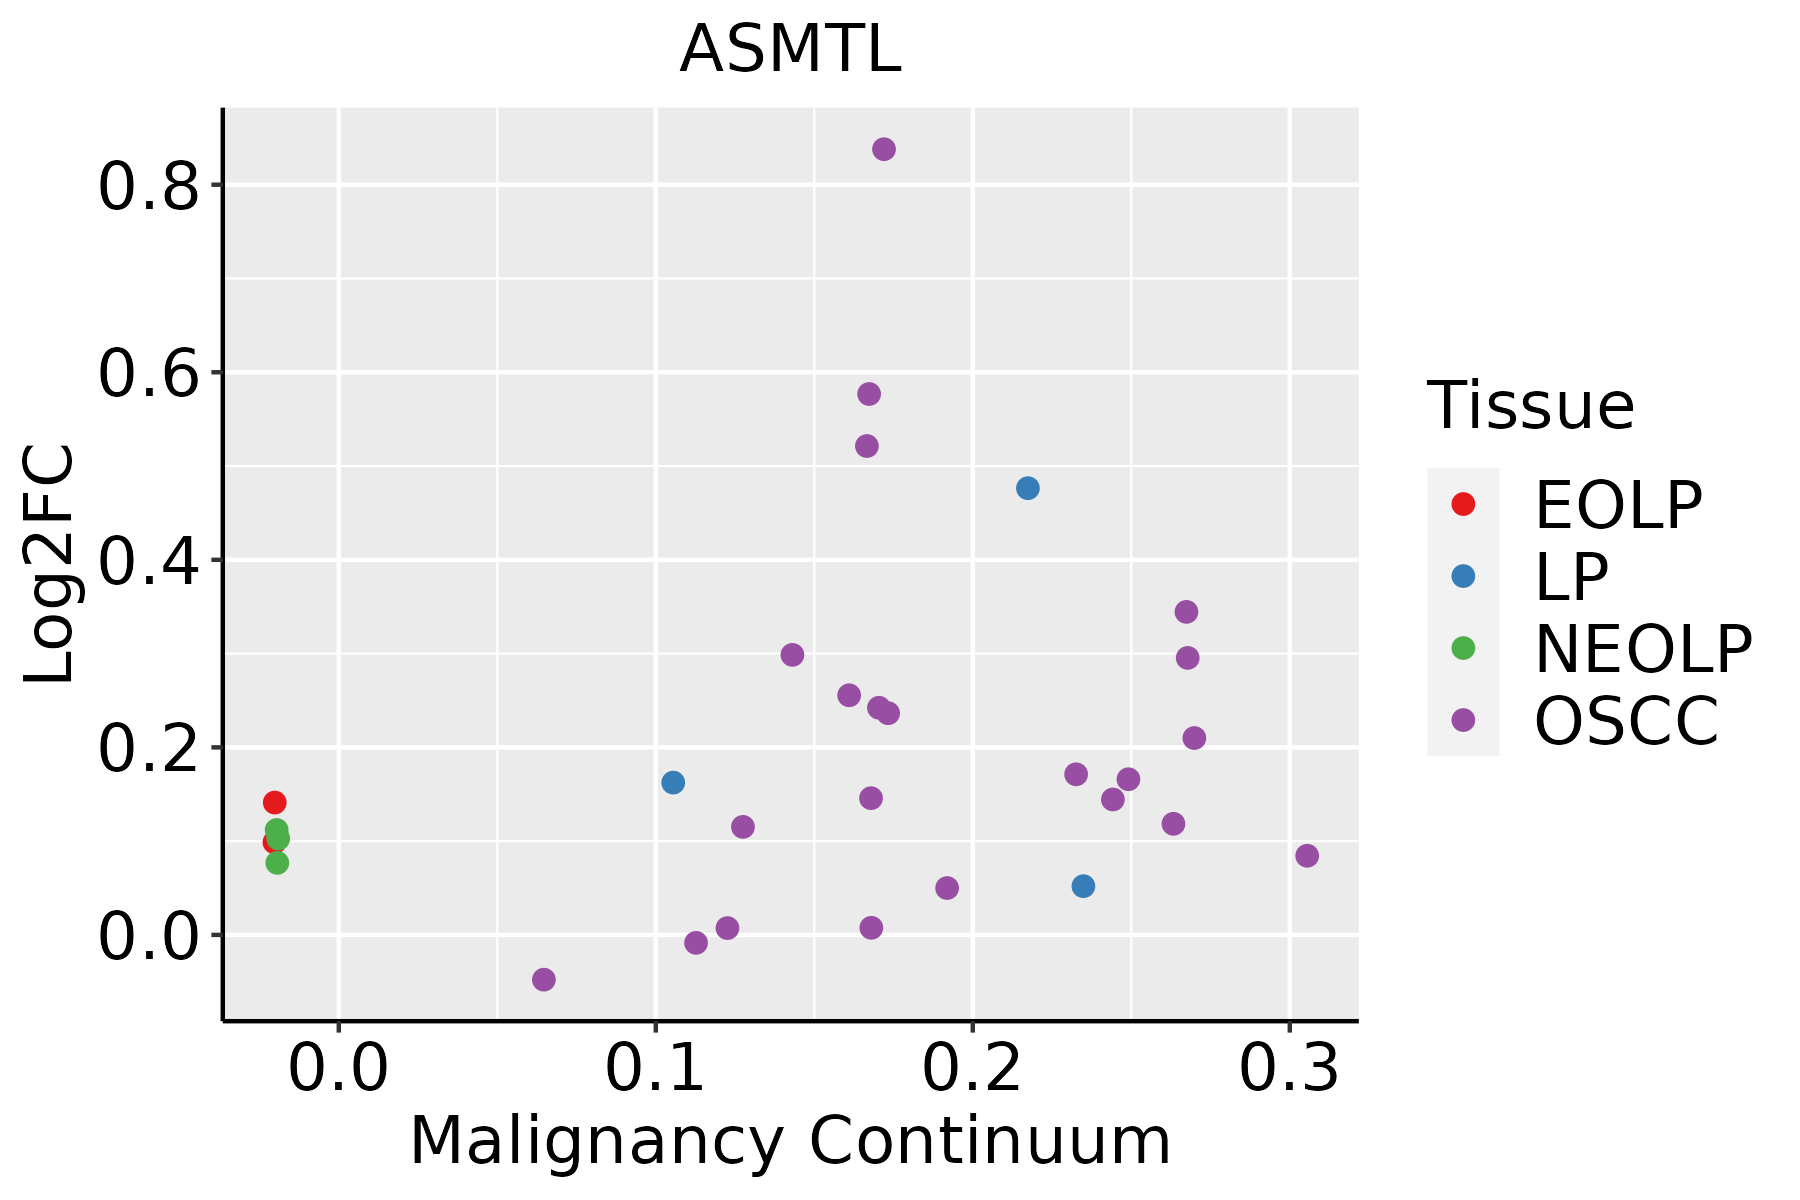 | EOLP: Erosive Oral lichen planus |
| LP: leukoplakia | ||
| NEOLP: Non-erosive oral lichen planus | ||
| OSCC: Oral squamous cell carcinoma | ||
| Thyroid | 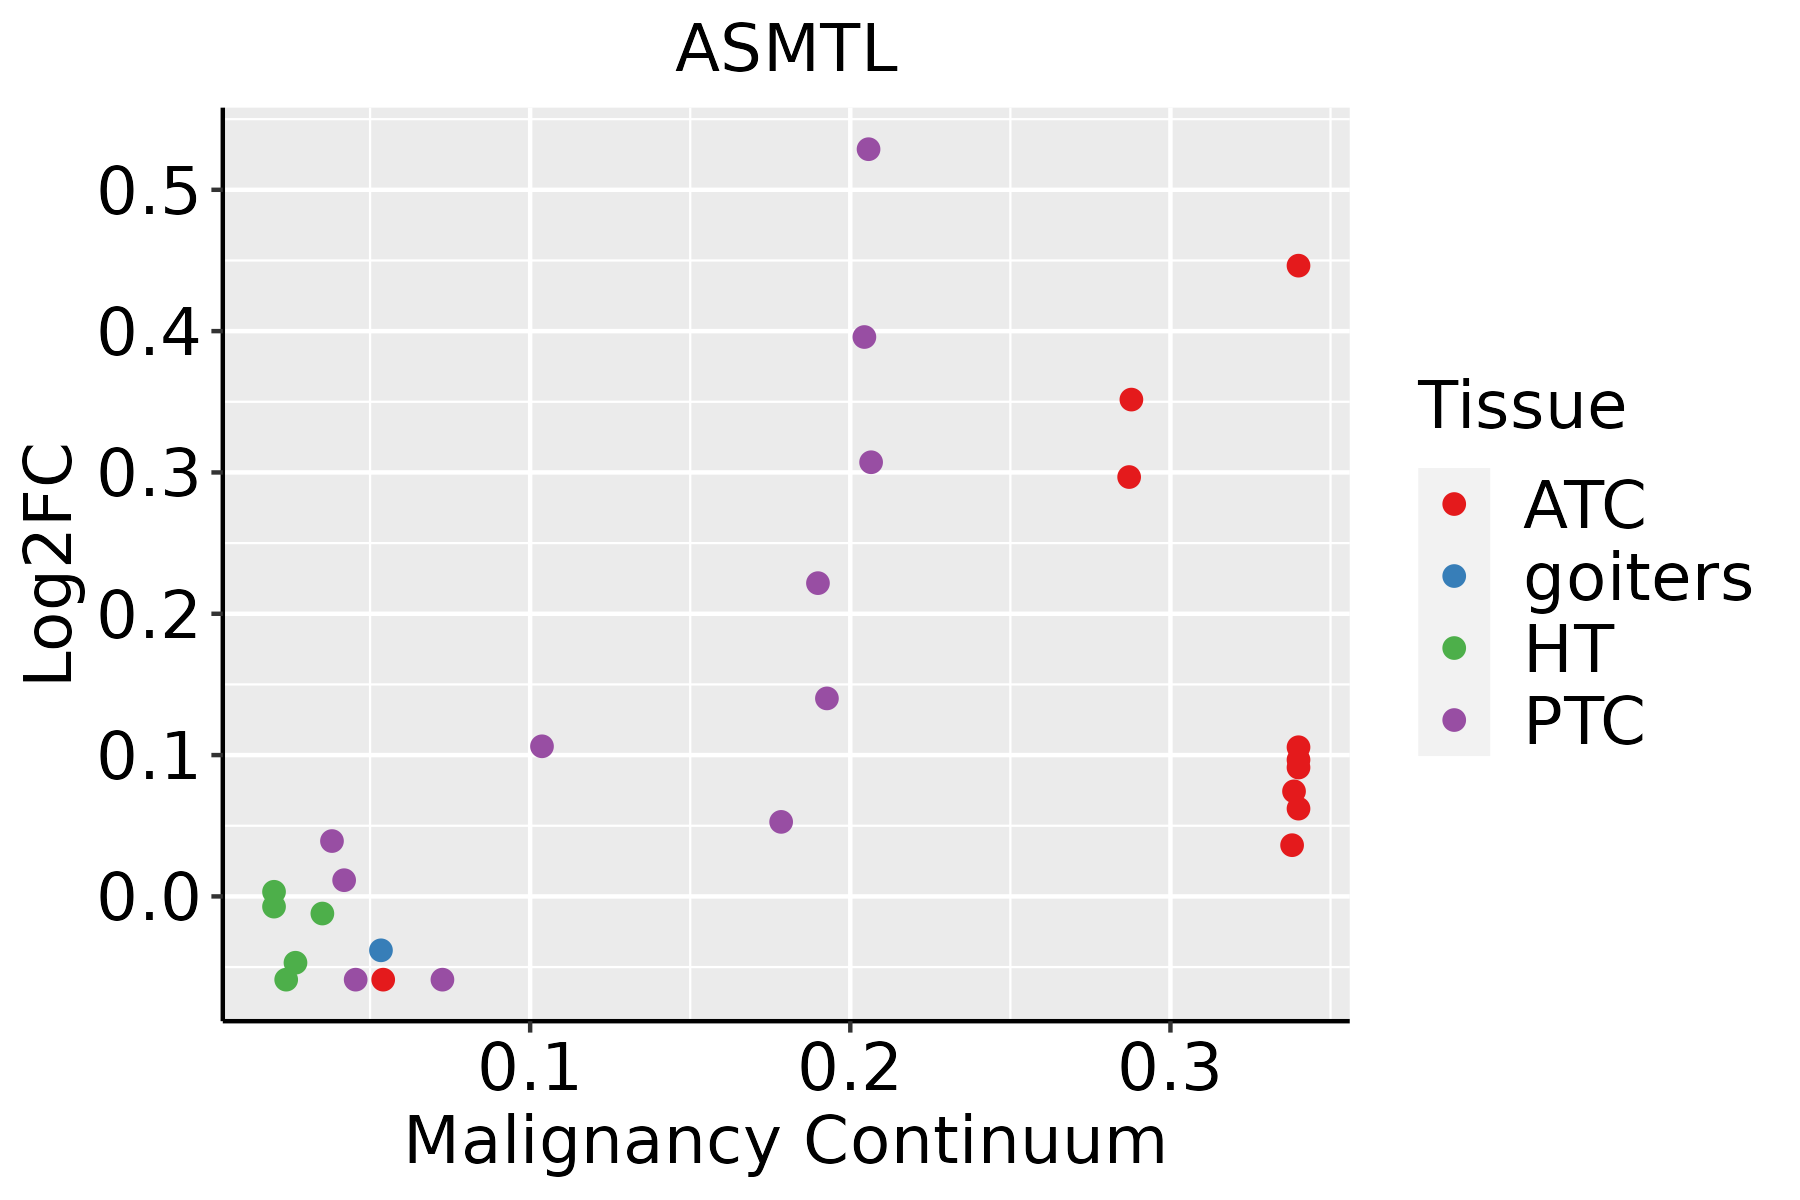 | ATC: Anaplastic thyroid cancer |
| HT: Hashimoto's thyroiditis | ||
| PTC: Papillary thyroid cancer |
| ∗log2FC in expression of this searched gene in stem-like cells from each diseased tissue sample relative to stem-like cells in normal samples in each tissue plotted against the malignancy continuum. Samples are colored based on if they are from different disease stage. |
Top |
Malignant transformation related pathway analysis |
| Find out the enriched GO biological processes and KEGG pathways involved in transition from healthy to precancer to cancer |
| Tissue | Disease Stage | Enriched GO biological Processes |
| Colorectum | AD |  |
| Colorectum | SER |  |
| Colorectum | MSS |  |
| Colorectum | MSI-H |  |
| Colorectum | FAP |  |
| ∗Top 15 enriched GO BP terms are showed in the bar plot of each disease state in each tissue. Each row represents a significant GO biological process which is colored according to the -log10(p.adjust). |
| Page: 1 2 3 4 5 6 7 8 9 |
| GO ID | Tissue | Disease Stage | Description | Gene Ratio | Bg Ratio | pvalue | p.adjust | Count |
| GO:00322592 | Esophagus | ESCC | methylation | 222/8552 | 364/18723 | 2.26e-09 | 5.09e-08 | 222 |
| GO:0006753110 | Esophagus | ESCC | nucleoside phosphate metabolic process | 288/8552 | 497/18723 | 1.80e-08 | 3.50e-07 | 288 |
| GO:0009117111 | Esophagus | ESCC | nucleotide metabolic process | 282/8552 | 489/18723 | 4.70e-08 | 8.50e-07 | 282 |
| GO:000675312 | Liver | Cirrhotic | nucleoside phosphate metabolic process | 190/4634 | 497/18723 | 1.10e-11 | 6.96e-10 | 190 |
| GO:000911712 | Liver | Cirrhotic | nucleotide metabolic process | 187/4634 | 489/18723 | 1.55e-11 | 9.63e-10 | 187 |
| GO:000911722 | Liver | HCC | nucleotide metabolic process | 300/7958 | 489/18723 | 1.61e-17 | 1.71e-15 | 300 |
| GO:000675322 | Liver | HCC | nucleoside phosphate metabolic process | 304/7958 | 497/18723 | 1.78e-17 | 1.85e-15 | 304 |
| GO:0032259 | Liver | HCC | methylation | 206/7958 | 364/18723 | 3.35e-08 | 7.53e-07 | 206 |
| GO:000675318 | Oral cavity | OSCC | nucleoside phosphate metabolic process | 247/7305 | 497/18723 | 6.28e-07 | 8.96e-06 | 247 |
| GO:000911719 | Oral cavity | OSCC | nucleotide metabolic process | 243/7305 | 489/18723 | 7.80e-07 | 1.09e-05 | 243 |
| GO:00322591 | Oral cavity | OSCC | methylation | 168/7305 | 364/18723 | 3.03e-03 | 1.31e-02 | 168 |
| GO:000675319 | Oral cavity | LP | nucleoside phosphate metabolic process | 161/4623 | 497/18723 | 5.31e-05 | 7.39e-04 | 161 |
| GO:0009117110 | Oral cavity | LP | nucleotide metabolic process | 158/4623 | 489/18723 | 7.17e-05 | 9.49e-04 | 158 |
| GO:000675325 | Thyroid | PTC | nucleoside phosphate metabolic process | 205/5968 | 497/18723 | 5.24e-06 | 6.35e-05 | 205 |
| GO:000911725 | Thyroid | PTC | nucleotide metabolic process | 202/5968 | 489/18723 | 5.46e-06 | 6.60e-05 | 202 |
| GO:00322594 | Thyroid | PTC | methylation | 146/5968 | 364/18723 | 4.99e-04 | 3.26e-03 | 146 |
| GO:0006753111 | Thyroid | ATC | nucleoside phosphate metabolic process | 219/6293 | 497/18723 | 5.92e-07 | 8.29e-06 | 219 |
| GO:0009117112 | Thyroid | ATC | nucleotide metabolic process | 215/6293 | 489/18723 | 9.09e-07 | 1.20e-05 | 215 |
| GO:003225911 | Thyroid | ATC | methylation | 148/6293 | 364/18723 | 2.69e-03 | 1.23e-02 | 148 |
| Page: 1 |
| Pathway ID | Tissue | Disease Stage | Description | Gene Ratio | Bg Ratio | pvalue | p.adjust | qvalue | Count |
| hsa012325 | Esophagus | ESCC | Nucleotide metabolism | 59/4205 | 85/8465 | 1.67e-04 | 6.58e-04 | 3.37e-04 | 59 |
| hsa002405 | Esophagus | ESCC | Pyrimidine metabolism | 41/4205 | 58/8465 | 9.14e-04 | 2.92e-03 | 1.49e-03 | 41 |
| hsa0123212 | Esophagus | ESCC | Nucleotide metabolism | 59/4205 | 85/8465 | 1.67e-04 | 6.58e-04 | 3.37e-04 | 59 |
| hsa0024012 | Esophagus | ESCC | Pyrimidine metabolism | 41/4205 | 58/8465 | 9.14e-04 | 2.92e-03 | 1.49e-03 | 41 |
| hsa01232 | Liver | Cirrhotic | Nucleotide metabolism | 39/2530 | 85/8465 | 1.27e-03 | 6.73e-03 | 4.15e-03 | 39 |
| hsa00240 | Liver | Cirrhotic | Pyrimidine metabolism | 27/2530 | 58/8465 | 5.31e-03 | 1.88e-02 | 1.16e-02 | 27 |
| hsa012321 | Liver | Cirrhotic | Nucleotide metabolism | 39/2530 | 85/8465 | 1.27e-03 | 6.73e-03 | 4.15e-03 | 39 |
| hsa002401 | Liver | Cirrhotic | Pyrimidine metabolism | 27/2530 | 58/8465 | 5.31e-03 | 1.88e-02 | 1.16e-02 | 27 |
| hsa002402 | Liver | HCC | Pyrimidine metabolism | 44/4020 | 58/8465 | 9.34e-06 | 7.11e-05 | 3.95e-05 | 44 |
| hsa012322 | Liver | HCC | Nucleotide metabolism | 59/4020 | 85/8465 | 3.30e-05 | 1.88e-04 | 1.04e-04 | 59 |
| hsa002403 | Liver | HCC | Pyrimidine metabolism | 44/4020 | 58/8465 | 9.34e-06 | 7.11e-05 | 3.95e-05 | 44 |
| hsa012323 | Liver | HCC | Nucleotide metabolism | 59/4020 | 85/8465 | 3.30e-05 | 1.88e-04 | 1.04e-04 | 59 |
| hsa012324 | Oral cavity | OSCC | Nucleotide metabolism | 54/3704 | 85/8465 | 1.78e-04 | 5.95e-04 | 3.03e-04 | 54 |
| hsa002404 | Oral cavity | OSCC | Pyrimidine metabolism | 37/3704 | 58/8465 | 1.62e-03 | 4.45e-03 | 2.26e-03 | 37 |
| hsa0123211 | Oral cavity | OSCC | Nucleotide metabolism | 54/3704 | 85/8465 | 1.78e-04 | 5.95e-04 | 3.03e-04 | 54 |
| hsa0024011 | Oral cavity | OSCC | Pyrimidine metabolism | 37/3704 | 58/8465 | 1.62e-03 | 4.45e-03 | 2.26e-03 | 37 |
| hsa0123221 | Oral cavity | LP | Nucleotide metabolism | 42/2418 | 85/8465 | 3.62e-05 | 2.36e-04 | 1.52e-04 | 42 |
| hsa0123231 | Oral cavity | LP | Nucleotide metabolism | 42/2418 | 85/8465 | 3.62e-05 | 2.36e-04 | 1.52e-04 | 42 |
| Page: 1 |
Top |
Cell-cell communication analysis |
| Identification of potential cell-cell interactions between two cell types and their ligand-receptor pairs for different disease states |
| Ligand | Receptor | LRpair | Pathway | Tissue | Disease Stage |
| Page: 1 |
Top |
Single-cell gene regulatory network inference analysis |
| Find out the significant the regulons (TFs) and the target genes of each regulon across cell types for different disease states |
| TF | Cell Type | Tissue | Disease Stage | Target Gene | RSS | Regulon Activity |
| ∗The dot plots of a searched regulon are shown for all cell subpopulations in each disease state of each tissue based on the regulon specific score inferred using pySCENIC and by calculating the average expression. |
| Page: 1 |
Top |
Somatic mutation of malignant transformation related genes |
| Annotation of somatic variants for genes involved in malignant transformation |
| Hugo Symbol | Variant Class | Variant Classification | dbSNP RS | HGVSc | HGVSp | HGVSp Short | SWISSPROT | BIOTYPE | SIFT | PolyPhen | Tumor Sample Barcode | Tissue | Histology | Sex | Age | Stage | Therapy Types | Drugs | Outcome |
| ASMTL | SNV | Missense_Mutation | novel | c.537N>C | p.Gln179His | p.Q179H | O95671 | protein_coding | deleterious(0) | probably_damaging(1) | TCGA-3C-AALI-01 | Breast | breast invasive carcinoma | Female | <65 | I/II | Unspecific | Poly E | Complete Response |
| ASMTL | SNV | Missense_Mutation | rs746367030 | c.239N>A | p.Ala80Asp | p.A80D | O95671 | protein_coding | deleterious(0) | benign(0.024) | TCGA-A2-A25A-01 | Breast | breast invasive carcinoma | Female | <65 | I/II | Unspecific | Cytoxan | SD |
| ASMTL | SNV | Missense_Mutation | c.1688N>C | p.Lys563Thr | p.K563T | O95671 | protein_coding | tolerated(0.1) | benign(0.297) | TCGA-AO-A03V-01 | Breast | breast invasive carcinoma | Female | <65 | I/II | Chemotherapy | fluorouracil | SD | |
| ASMTL | SNV | Missense_Mutation | rs746554233 | c.236N>A | p.Arg79Gln | p.R79Q | O95671 | protein_coding | tolerated(0.06) | benign(0.024) | TCGA-AR-A24H-01 | Breast | breast invasive carcinoma | Female | >=65 | I/II | Hormone Therapy | tamoxiphen | SD |
| ASMTL | SNV | Missense_Mutation | c.1237N>G | p.Leu413Val | p.L413V | O95671 | protein_coding | tolerated(0.25) | benign(0.063) | TCGA-BH-A0B0-01 | Breast | breast invasive carcinoma | Female | <65 | I/II | Chemotherapy | adriamycin | CR | |
| ASMTL | insertion | Nonsense_Mutation | novel | c.926_927insAGACAGATACATAGATAGATGATAAATGCATAGAC | p.Phe310AspfsTer7 | p.F310Dfs*7 | O95671 | protein_coding | TCGA-A2-A0CP-01 | Breast | breast invasive carcinoma | Female | <65 | I/II | Chemotherapy | cytoxan | SD | ||
| ASMTL | insertion | Frame_Shift_Ins | novel | c.1158_1159insTTAGACATCCT | p.Phe388AspfsTer43 | p.F388Dfs*43 | O95671 | protein_coding | TCGA-A8-A06Y-01 | Breast | breast invasive carcinoma | Female | >=65 | I/II | Hormone Therapy | anastrozole | PD | ||
| ASMTL | insertion | In_Frame_Ins | novel | c.701_702insTTCCTGCCT | p.Thr234_Phe235insSerCysLeu | p.T234_F235insSCL | O95671 | protein_coding | TCGA-A8-A07U-01 | Breast | breast invasive carcinoma | Female | >=65 | III/IV | Chemotherapy | 5-fluorouracil | SD | ||
| ASMTL | insertion | In_Frame_Ins | novel | c.1068_1069insTTGCAAAGC | p.Ser356_Asn357insLeuGlnSer | p.S356_N357insLQS | O95671 | protein_coding | TCGA-BH-A0BV-01 | Breast | breast invasive carcinoma | Female | >=65 | I/II | Chemotherapy | doxorubicin | SD | ||
| ASMTL | insertion | Frame_Shift_Ins | novel | c.1066_1067insATGGAACTGACACTTGCTTATCTGAGGCCGCT | p.Ser356AsnfsTer82 | p.S356Nfs*82 | O95671 | protein_coding | TCGA-BH-A0BV-01 | Breast | breast invasive carcinoma | Female | >=65 | I/II | Chemotherapy | doxorubicin | SD |
| Page: 1 2 3 4 5 6 7 8 9 10 |
Top |
Related drugs of malignant transformation related genes |
| Identification of chemicals and drugs interact with genes involved in malignant transfromation |
| (DGIdb 4.0) |
| Entrez ID | Symbol | Category | Interaction Types | Drug Claim Name | Drug Name | PMIDs |
| Page: 1 |

Copyright 2023-Present -The University of Texas Health Science Center at Houston |